The ScyllaDB team is pleased to announce the release of ScyllaDB Monitoring Stack 2.2.
ScyllaDB Monitoring Stack is an open source stack for monitoring ScyllaDB Enterprise and ScyllaDB Open Source, based on Prometheus and Grafana. ScyllaDB Monitoring Stack 2.2 supports:
- ScyllaDB Open Source versions 2.3 and 3.0
- ScyllaDB Enterprise versions 2017.x and 2018.x
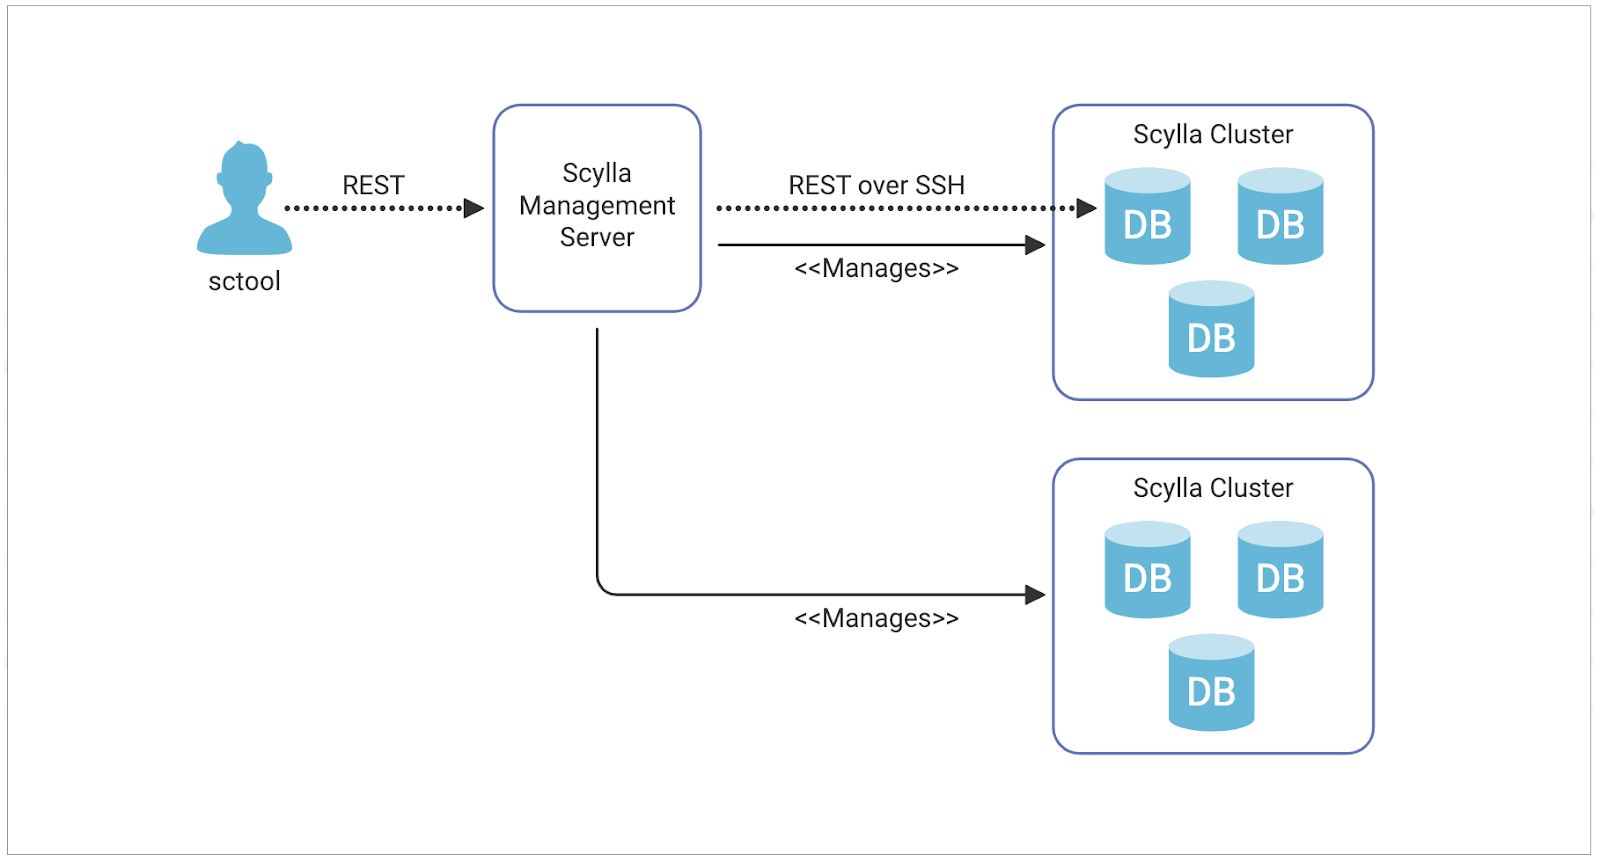
- ScyllaDB Manager 1.3.x
Related Links
- ScyllaDB New Optimization Dashboard
- Download ScyllaDB Monitoring 2.2
- ScyllaDB Monitoring Stack Docs
- Upgrade from ScyllaDB Monitoring 2.1 to 2.2
- Upgrade from ScyllaDB Monitoring 1.x to 2.x
New in ScyllaDB Monitoring Stack 2.2
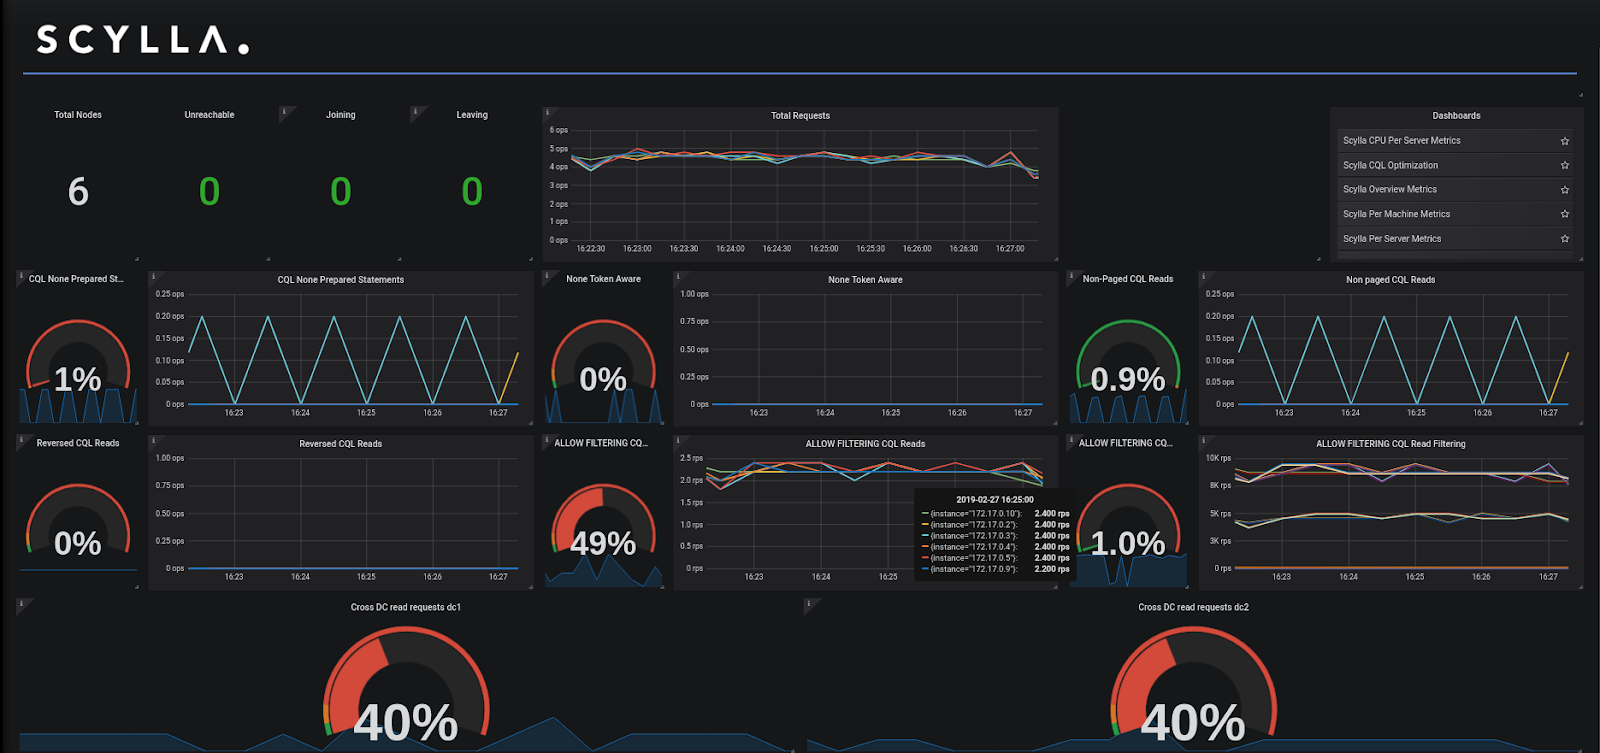
- CQL optimization dashboard (#471)
The CQL optimization dashboard helps identify issues when developing an application with ScyllaDB such as non-prepared statements, queries that are not token aware, non paged queries, and requests from a remote DC. Before using the new dashboard, make sure you correctly defined the DC names (see Align Data Center Names below). More on the new Optimization Dashboard. A blog post on the optimization dashboard, and how to use it will be published soon.
- Unified target files for ScyllaDB and node_exporter (#378)
To simplify the Prometheus configuration of ScyllaDB nodes and the node_exporter targets, you only need to configure ScyllaDB targets. Prometheus assumes that there is a node_exporter running on each of the ScyllaDB servers and will use the same IPs as those set in the targets. It is still possible to configure a specific node_exporter target file. - Per machine (node_exporter related) dashboard added to Enterprise (#495)
The per-machine dashboard shows information about the host disk and network. It is now available for Enterprise. - Prometheus container uses the current user ID and group (#487)
There is an ongoing issue with the volume the Prometheus container uses to store its data. From ScyllaDB manager version 2.2, the container will run as the current user and with the user group ID. This means, that the data directory should have the current user permissions. While this does not require any changes, it is recommended to check your Docker installation and make sure you are not running Docker as root. kill-all.shkills Prometheus instances gracefully (#438)
Thekill-allcommand will now attempt to kill Prometheus gracefully. By doing so, Prometheus will start quickly after shutdown. This means that shutdowns can take longer than anticipated. Thekill-allwill wait for up to two minutes for Prometheus to shut down. Once the time has lapsed, the command will forcefully kill the container.start-all.shnow supports--versionflag (#374)
To verify your Monitoring stack version, you can now run./start-all.sh --version- Remove the version from the dashboard names (#486)
Following the move to Grafana 5 and the use of the dashboard folders, the version was removed from the dashboard names. - Dashboard loaded from API should have overwritten properties set to true (#474)
For users who upload the dashboard with the API, dashboards have the overwrite flag set to true, so you can upload the same dashboard twice. - Update Alertmanager to 0.16 (#478)
Following the changes in Alertmanager see the changelog for details
Align Data Center Names
The new Optimization Dashboard (above) relies on the definition of nodes per Data Center in the Monitoring Stack, to match the Data Center names used in ScyllaDB Cluster. For example:
nodetool status

Datacenter: DC1

===============

Status=Up/Down

|/ State=Normal/Leaving/Joining/Moving

-- Address     Load       Tokens   Owns Host ID                              Rack

UN 172.20.0.4  108.83 KB  256      ?    fae7039a-21ad-4e94-9474-430abcf48158 Rack1

UN 172.20.0.2  108.86 KB  256      ?    fe2986de-9c8a-44bb-8b3b-923519095a23 Rack1

UN 172.20.0.3  108.84 KB  256      ?    2a10a36f-365f-455a-85d4-18cd40b6b765 Rack1

Datacenter: DC2

===============

Status=Up/Down

|/ State=Normal/Leaving/Joining/Moving

-- Address     Load       Tokens   Owns Host ID                              Rack

UN 172.20.0.5  108.8 KB   256      ?    edbc46cb-d948-4745-a90b-28d3bc90c034 Rack1

UN 172.20.0.6  108.76 KB  256      ?    58a5a43c-8ec1-4369-91d9-6bd79d1d706a Rack1

UN 172.20.0.7  108.27 KB  256      ?    c5886895-be75-4e18-8fa5-3633a10f9ee8 Rack1
Should match the data center names, in this case, DC1 and DC2 found in scylla-grafana-monitoring/prometheus/scylla_servers.yml
Such as:
- targets:
- 172.20.0.2:9180
- 172.20.0.3:9180
- 172.20.0.4:9180
labels:
cluster: my-cluster
dc: DC1
- targets:
- 172.20.0.5:9180
- 172.20.0.6:9180
- 172.20.0.7:9180
labels:
cluster: my-cluster
dc: DC2
Bug Fixes