The ScyllaDB team is pleased to announce the release of ScyllaDB Monitoring Stack 2.3.
ScyllaDB Monitoring Stack is an open source stack for monitoring ScyllaDB Enterprise and ScyllaDB Open Source, based on Prometheus and Grafana. ScyllaDB Monitoring Stack 2.2 supports:
- ScyllaDB Open Source versions 2.3 and 3.0
- ScyllaDB Enterprise versions 2018.x and 2019.x (upcoming release)
- ScyllaDB Manager 1.3.x, 1.4.x (upcoming release)
Related Links
- Download ScyllaDB Monitoring 2.3
- ScyllaDB Monitoring Stack Docs
- Upgrade from ScyllaDB Monitoring 2.x to 2.3
New in ScyllaDB Monitoring Stack 2.3
- ScyllaDB enterprise dashboards for 2019.1 (#538)
Getting ready for ScyllaDB Enterprise 2019.1, the dashboards for ScyllaDB Enterprise 2019.1 are included. - ScyllaDB manager dashboard for 1.4 (#557)
Getting ready for ScyllaDB Manager 1.4, the dashboard for ScyllaDB Manager 1.4 is included. - Dashboards are precompiled in the release
ScyllaDB Monitoring Stack uses templates for simpler dashboard representation. A python script is used to generate the dashboards from the templates. As of ScyllaDB Monitoring version 2.3, the dashboards will be packaged pre-compiled part of the release. This will remove the dependency in python for users that do not make changes to the dashboards.In addition, the starting script will not generate new dashboards on change, but will only issue a warning that a dashboard was changed and would ask the user to run the generation script. - Add cross_shard_ops panel to cql optimization (#553)
ScyllaDB uses a shared-nothing model that shards all requests onto individual cores. ScyllaDB runs one application thread-per-core, and depends on explicit message passing, not shared memory between threads. This design avoids slow, unscalable lock primitives and cache bounces.Ideally, each request to a ScyllaDB node reaches the right core (shard), avoiding internal communication between cores. This is not always the case, for example, when using a non-shard-aware ScyllaDB driver (see more here)New panels in the cql optimization dashboard were added to help identify cross-shard traffic.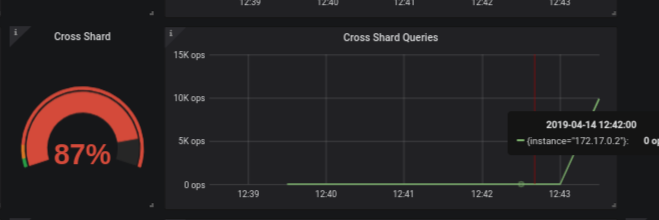
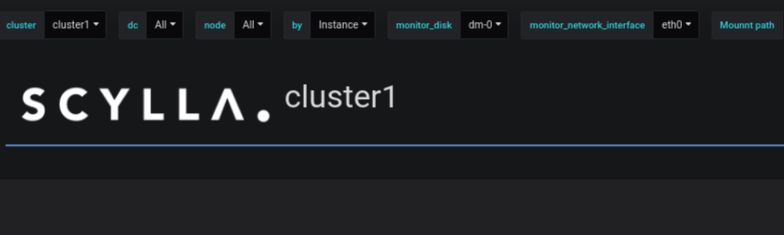
- Cluster name in use is shown in the dashboard (#533)
To simplify monitoring multi-cluster installation the cluster name is now shown on the dashboards header.
- genconfig.py with multi dc support (#513)
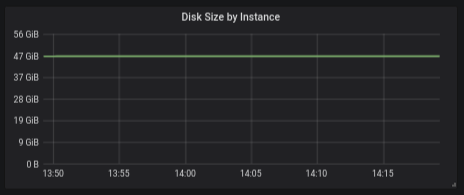
The genconfig.py utility can accept datacenter name, it can also be used with nodetool output for simpler configuration. - Add a storage usage over time panel (#466)
Add a panel to the per-machine dashboard that shows the disk usage over time.
- Upgrade Prometheus to 2.7.2 (#456)
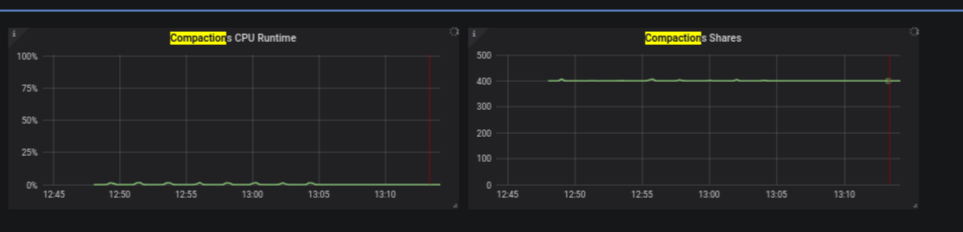
Prometheus container now uses Prometheus version 2.7.2, see Prometheus releases for more information - Show more information about compaction (#491)
Two panels were added to the per-server dashboard, one that shows the percentage of CPU used by compaction, and one that shows the compaction shares over time.
- Alertmanager and Prometheus alerts can be configured from the command line
It is now possible to override the Prometheus alert file and the alertmanager configuration files from the command line.To specify the alert manager config file use the-rcommand line argument withstart-all.sh
For example:./start-all.sh -r rules.ymlTo specify the prometheus alert file use the-Rcommand line argument with start-alls.hFor example:./start-all.sh -R prometheus.rules.yml - Warn users when starting docker as root and make grafana volume sharable
Users should avoid running Docker containers as root. When a user would start the Monitoring stack as root, a warning will be issued. - Prometheus data directory to accept relative path (#527)
No need to specify the full path to the Prometheus data directory.
Bug Fixes