
The ScyllaDB team is pleased to announce the release of ScyllaDB Monitoring Stack 3.0.
ScyllaDB Monitoring Stack is an open-source stack for monitoring ScyllaDB Enterprise and ScyllaDB Open Source, based on Prometheus and Grafana. ScyllaDB Monitoring Stack 3.0 supports:
- ScyllaDB Open Source versions 2.3, 3.0 and 3.1
- ScyllaDB Enterprise versions 2018.x and 2019.x
- ScyllaDB Manager 1.4.x
Related Links
- ScyllaDB Monitoring 3.0 highlights
- Download ScyllaDB Monitoring 3.0
- ScyllaDB Monitoring Stack Docs
- Upgrade from ScyllaDB Monitoring 2.x to 3.y
ScyllaDB Monitoring 3.0 is not fully backward compatible, make sure to follow the upgrade guide for more details.
New in ScyllaDB Monitoring Stack 3.0
- A general reorganization of all dashboards
After the reorganization the dashboard names are:- Overview – Quick overview of a cluster
- Detailed – In-depth detailed look, focusing on the server level
- CQL – Covers CQL metrics and points out potential problems such as shard aware drivers, non paged queries, etc.
- OS – OS-related metrics, about disk and network as reported by the
node_exporteragent - IO – ScyllaDB IO metrics, focusing on the IO Queue
- CPU – CPU related metrics
- Errors – A single place for errors generated by ScyllaDB
- Manager – The ScyllaDB Manager Dashboard
- Metrics clean up – While moving to 3.0 there are both metrics changes and label changes:
- ScyllaDB monitoring uses
node_exporterto export OS-related metrics. When installing ScyllaDB Open Source versions 2.3 and above, the installation package installsnode_exporterversion 0.17, which is not backward compatible with previous versions ofnode_exporter.
Make sure you are usingnode_exporterversion 0.17 as explained in the upgrade guide. - Label cleanup: Removed redundant labels in Prometheus, saving some memory on the Prometheus side. The changes will cause a visible effect on the metrics during the upgrade, the grafana graphs change their color, but historical data will still be persistent.
- ScyllaDB monitoring uses
- Removal of the targets configuration files from the repository: There are two target files ScyllaDB monitoring uses, one for ScyllaDB servers (
prometheus/scylla_servers.yml) and one for ScyllaDB Manager (prometheus/scylla_manager_servers.yml).
As these files are different for each deployment, they were removed from the repository. Make sure to follow the upgrade guide and copy the files from their old locations. - Switch from Grafana 5 to Grafana 6 – Grafana 6 includes a facelift and changes to their plugin architecture. Switching to the newer version, allows us (when going forward) to use newer Grafana features.
- Switch to python3 – python 2 is getting closer to its end of life. Python is only used when modifying dashboards with the
make_dashboard.shscript or when using thegenconfig.pyscript to generate thescylla_server.ymlfile. - Switch from Prometheus 2.7.2 to Prometheus 2.10 – you can read about Prometheus releases here
- New Alerts. Prometheus Alert Manager allows you to set alerts for your ScyllaDB cluster. ScyllaDB Monitoring Stack comes with a few out of the box alerts. ScyllaDB Monitoring 3.0 adds two new default alerts:
- Alert on low free disk space on the root partition
- Alert when a node changes its status to leaving
- The Nodes table, in the Overview dashboard now shows the state and ScyllaDB version of each node and provides a quick link to the Node Detailed dashboard.
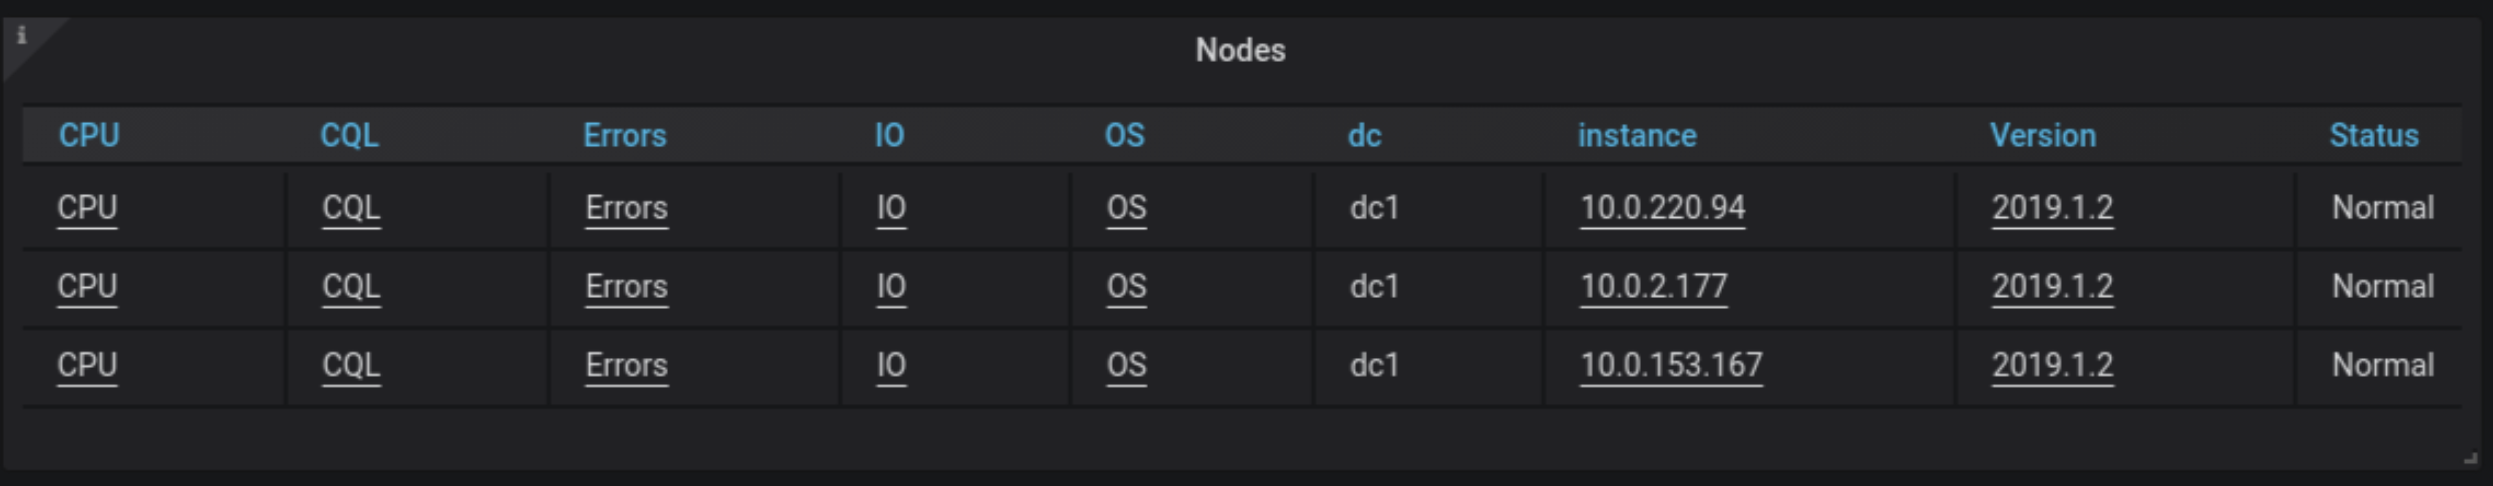
Nodes table in upcoming ScyllaDB Monitoring 3.0 provides Each node’s version in real-time