We just released ScyllaDB Monitoring Stack version 2.4. The new version comes with dashboards to support the coming ScyllaDB Open Source 3.1 release.
New Ways To Look at Shards Information
ScyllaDB uses a thread-per-core architecture. This means that each thread-core (called a shard) acts as an individual processing unit.
Almost all metrics are reported at the shard level. When looking at ScyllaDB’s dashboards you can choose between Cluster, Data Center, Instance or Shard view.
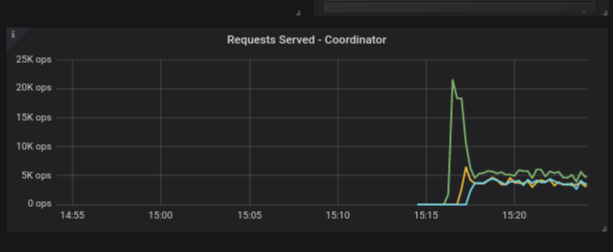
Consider the requests served panel found on the overview-dashboard. When looking at it in the instance view all the information from the shards on each of the instances are summed, like in this example:
The behavior when switching to shard view is now changed, starting in version 2.4. When switching to shard view you would see the information from all shards from all instances. For example:
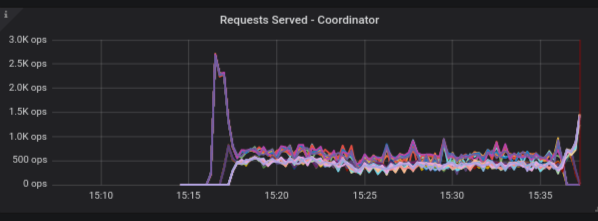
As you can this can become quite crowded as the number of lines in a panel is the number of shards multiplied by the number of instances.
So you usually would like to choose a specific instance (or a few instances).
To help you choose the instance, an additional enhancement allows you to choose the aggregation function.
Think about a situation when you look at a graph at a shard granularity, you can see that from all the shards only one or two are very high or very low.
Switch back to instance view and change the aggregation function to something else (i.e. per minute), this will help you to see what instance the misbehaving shard belongs to.
New Dashboard
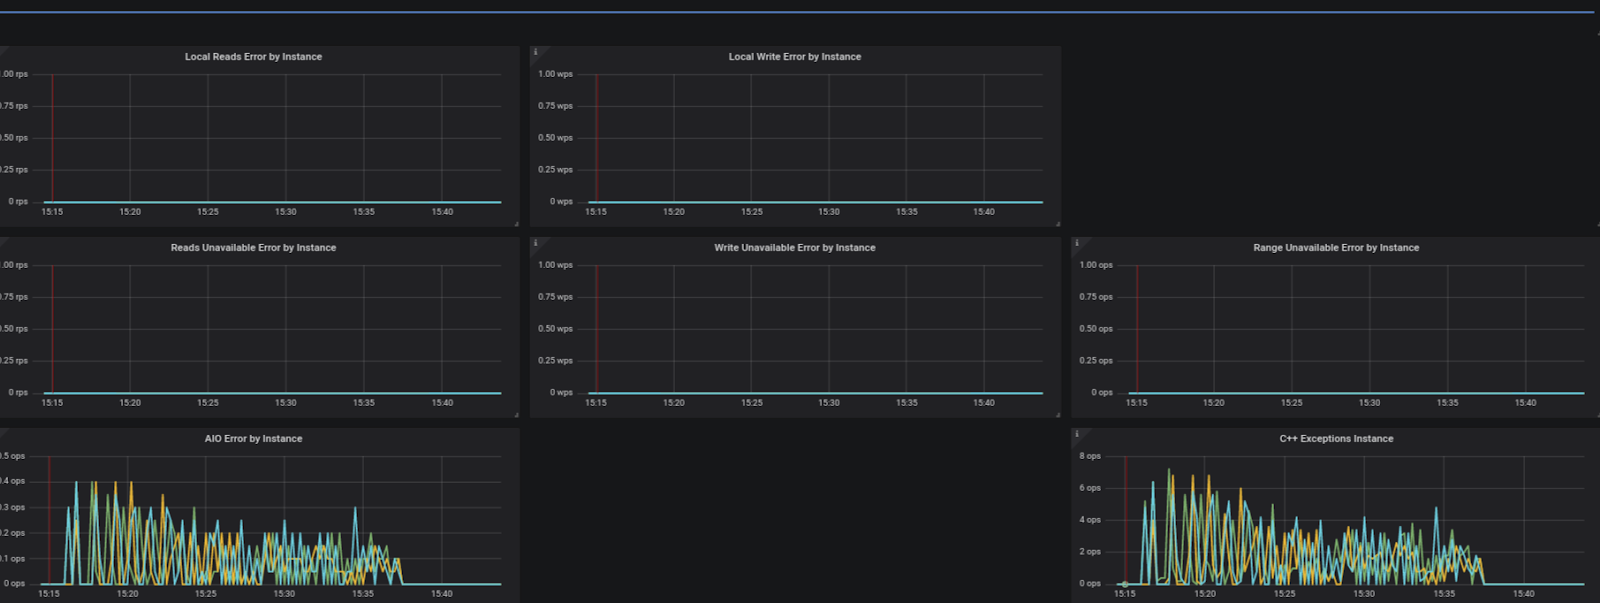
ScyllaDB Errors
In the lifetime of the system, there are situations where things are not working as expected. Examples are system overload, network problem or disk errors.
To help our support and field engineers get a view of what is not working as expected we added the error dashboard, which simply put, shows different metrics indicating that some error occurred in the system.
Changes in existing Dashboards
Replica vs Coordinator
ScyllaDB’s data model uses replication for availability and redundancy. This means that when a node gets a request (e.g. insert) it would send that request to multiple instances.
The node that gets the original request is called a Coordinator because it coordinates the work between the other nodes.
The nodes that hold the replicated data and perform the actual action are called Replicas, as you probably guessed.
It’s sometimes confusing to understand if a metric comes from a coordinator or from a replica and the difference is important, for example, assume we are using consistency level 3 when we’ll do a write, for every insert-operation at the coordinator level we are going to see 3 inserts on the Replication level. To make it clearer all panels are now labeled if they come from the replicas or from the coordinator.
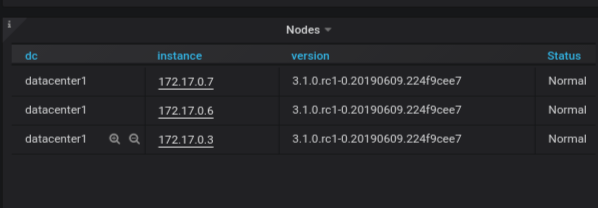
The Nodes Table
We added a new table in the overview dashboard for all the nodes, for each node we have the datacenter it belongs to, its IP, its current version and its status.
The node status information is based on a metric that is only available in ScyllaDB 3.1 and later and ScyllaDB Enterprise 3.1 and later.
Next steps
Now you’ve seen the changes that were made in ScyllaDB Monitoring Stack 2.4 to make it even clearer. The next step is yours! Download ScyllaDB Monitoring Stack 2.4 directly from Github. It’s free and open source. If you try it, we’d love to hear your feedback, either by contacting us privately or sharing your experience with your fellow users on our Slack channel.