
We just released ScyllaDB Monitoring Stack version 3.0. The new version includes reorganization of the dashboards, upgrading to Grafana version 6, and a metrics clean up.
Dashboards Reorganization
Each ScyllaDB Release adds metrics and panels to the dashboards, until at some point, they become too crowded. In ScyllaDB Monitoring 3.0 we put some order to the dashboards, in an attempt to simplify the usage, and improve the ScyllaDB Monitoring UX. In the process, some of the dashboard names (and URLs) were updated to represent their content.
Overview
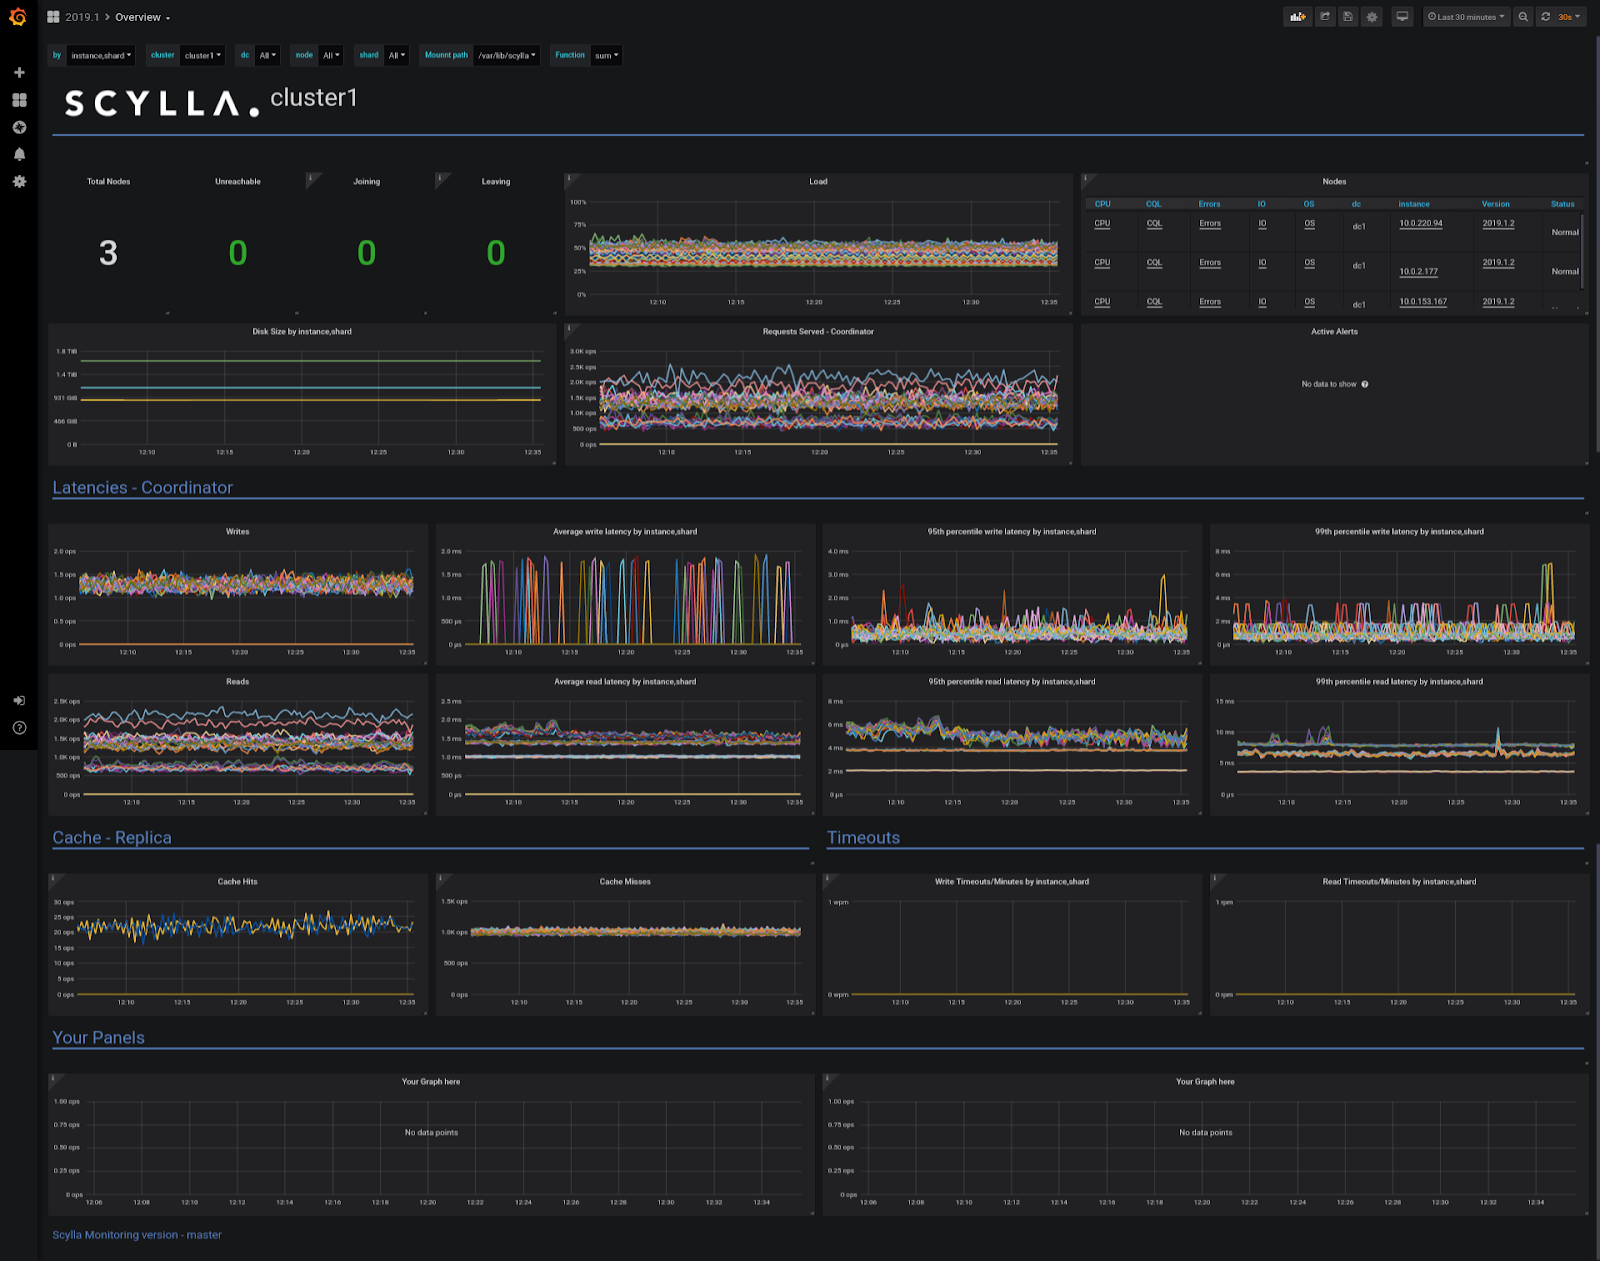
The Overview dashboard is the entry point for monitoring the cluster, it gives you a quick overview, highlighting the key metrics. Looking at this dashboard would tell you how busy the cluster is, what is the status of the nodes, the current latencies and timeouts.
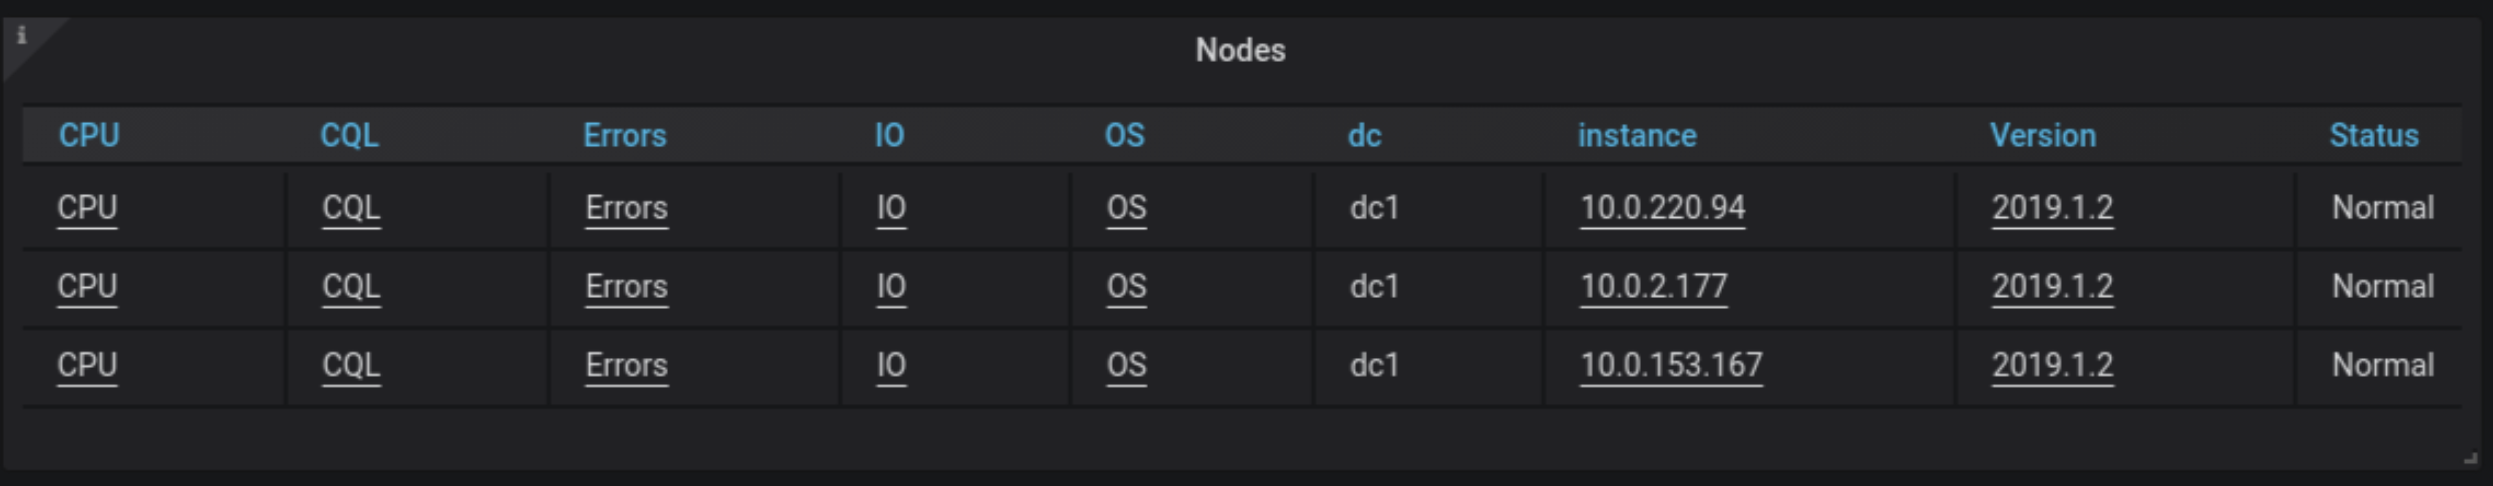
The Nodes table serves both as a single place to get the nodes version and status, and as a quick link to drill down to per node dashboards. Click on each of the links to jump to a specific dashboard.
Detail
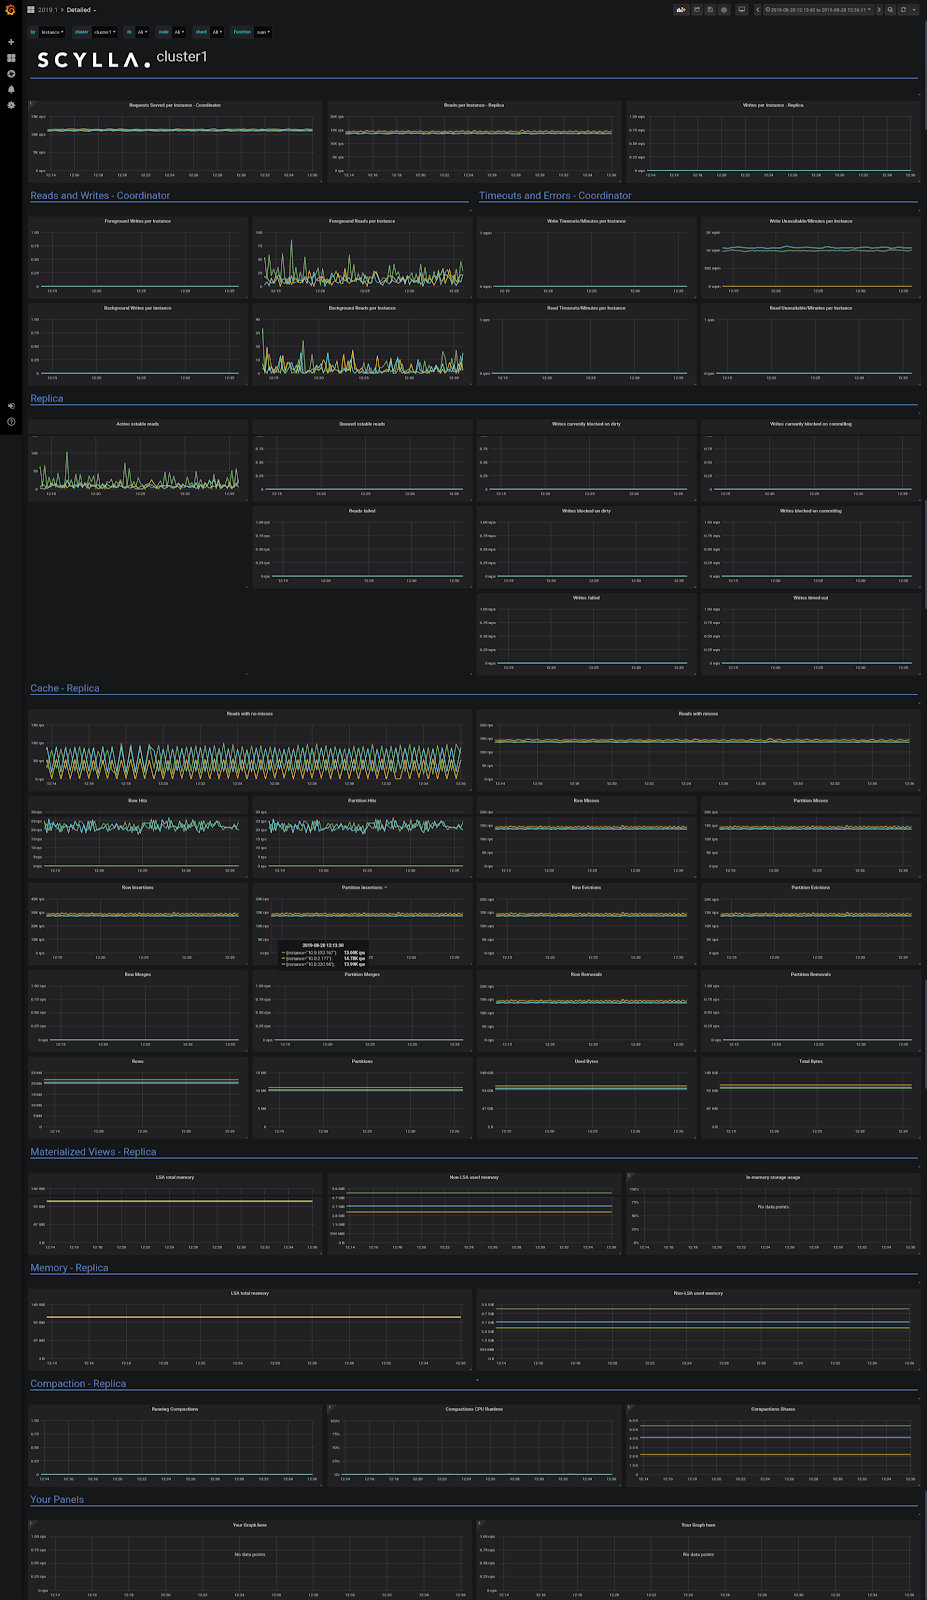
Use the Detail dashboard for an in-depth view of one or more nodes. The panels are gathered in sections, covering Read and Writes, Memory, Cache, and Materialized Views.
Each section states if the information is relevant to a coordinator (a node that received the request) or a Replica (a node that handles the request).
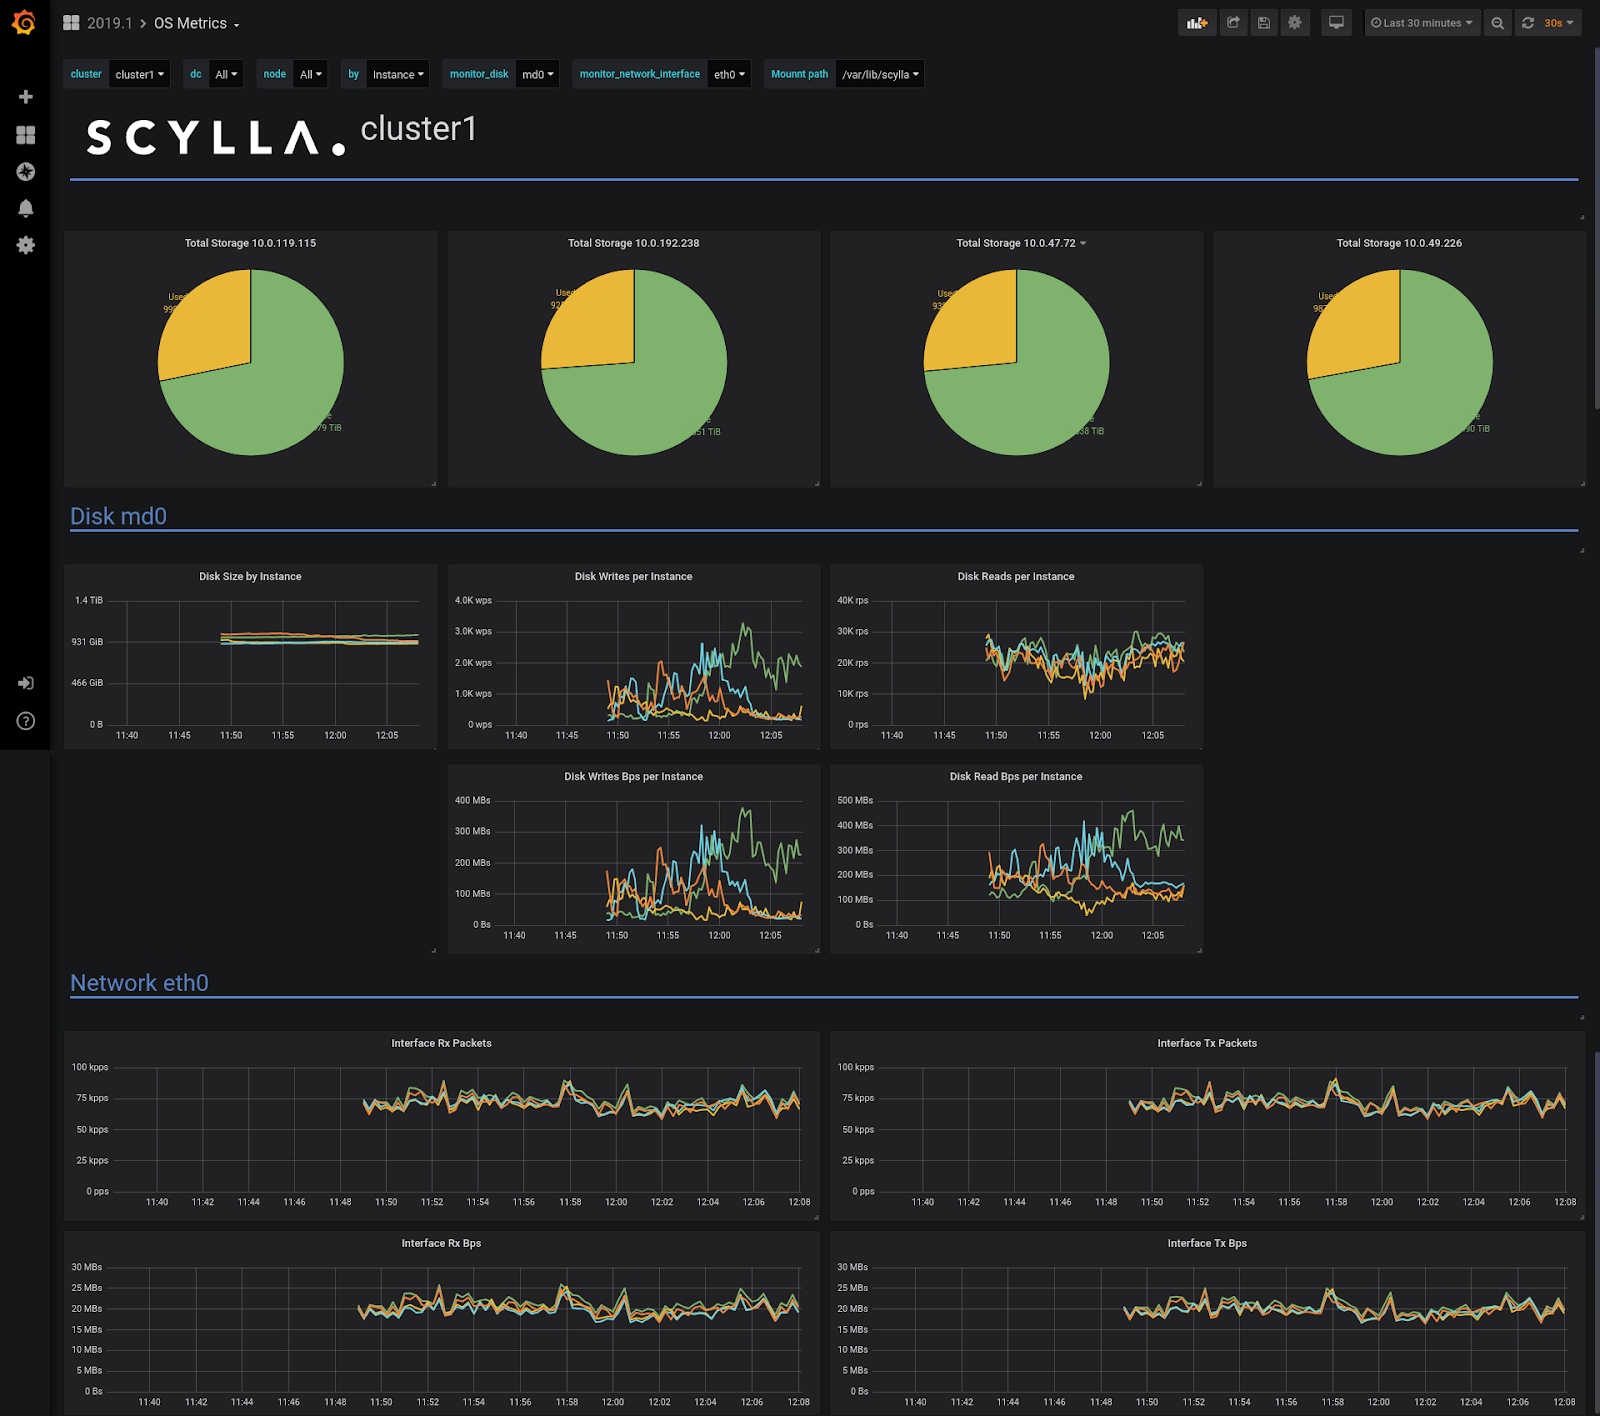
OS Metrics
Covers information that relates to the OS level: Disk and Network
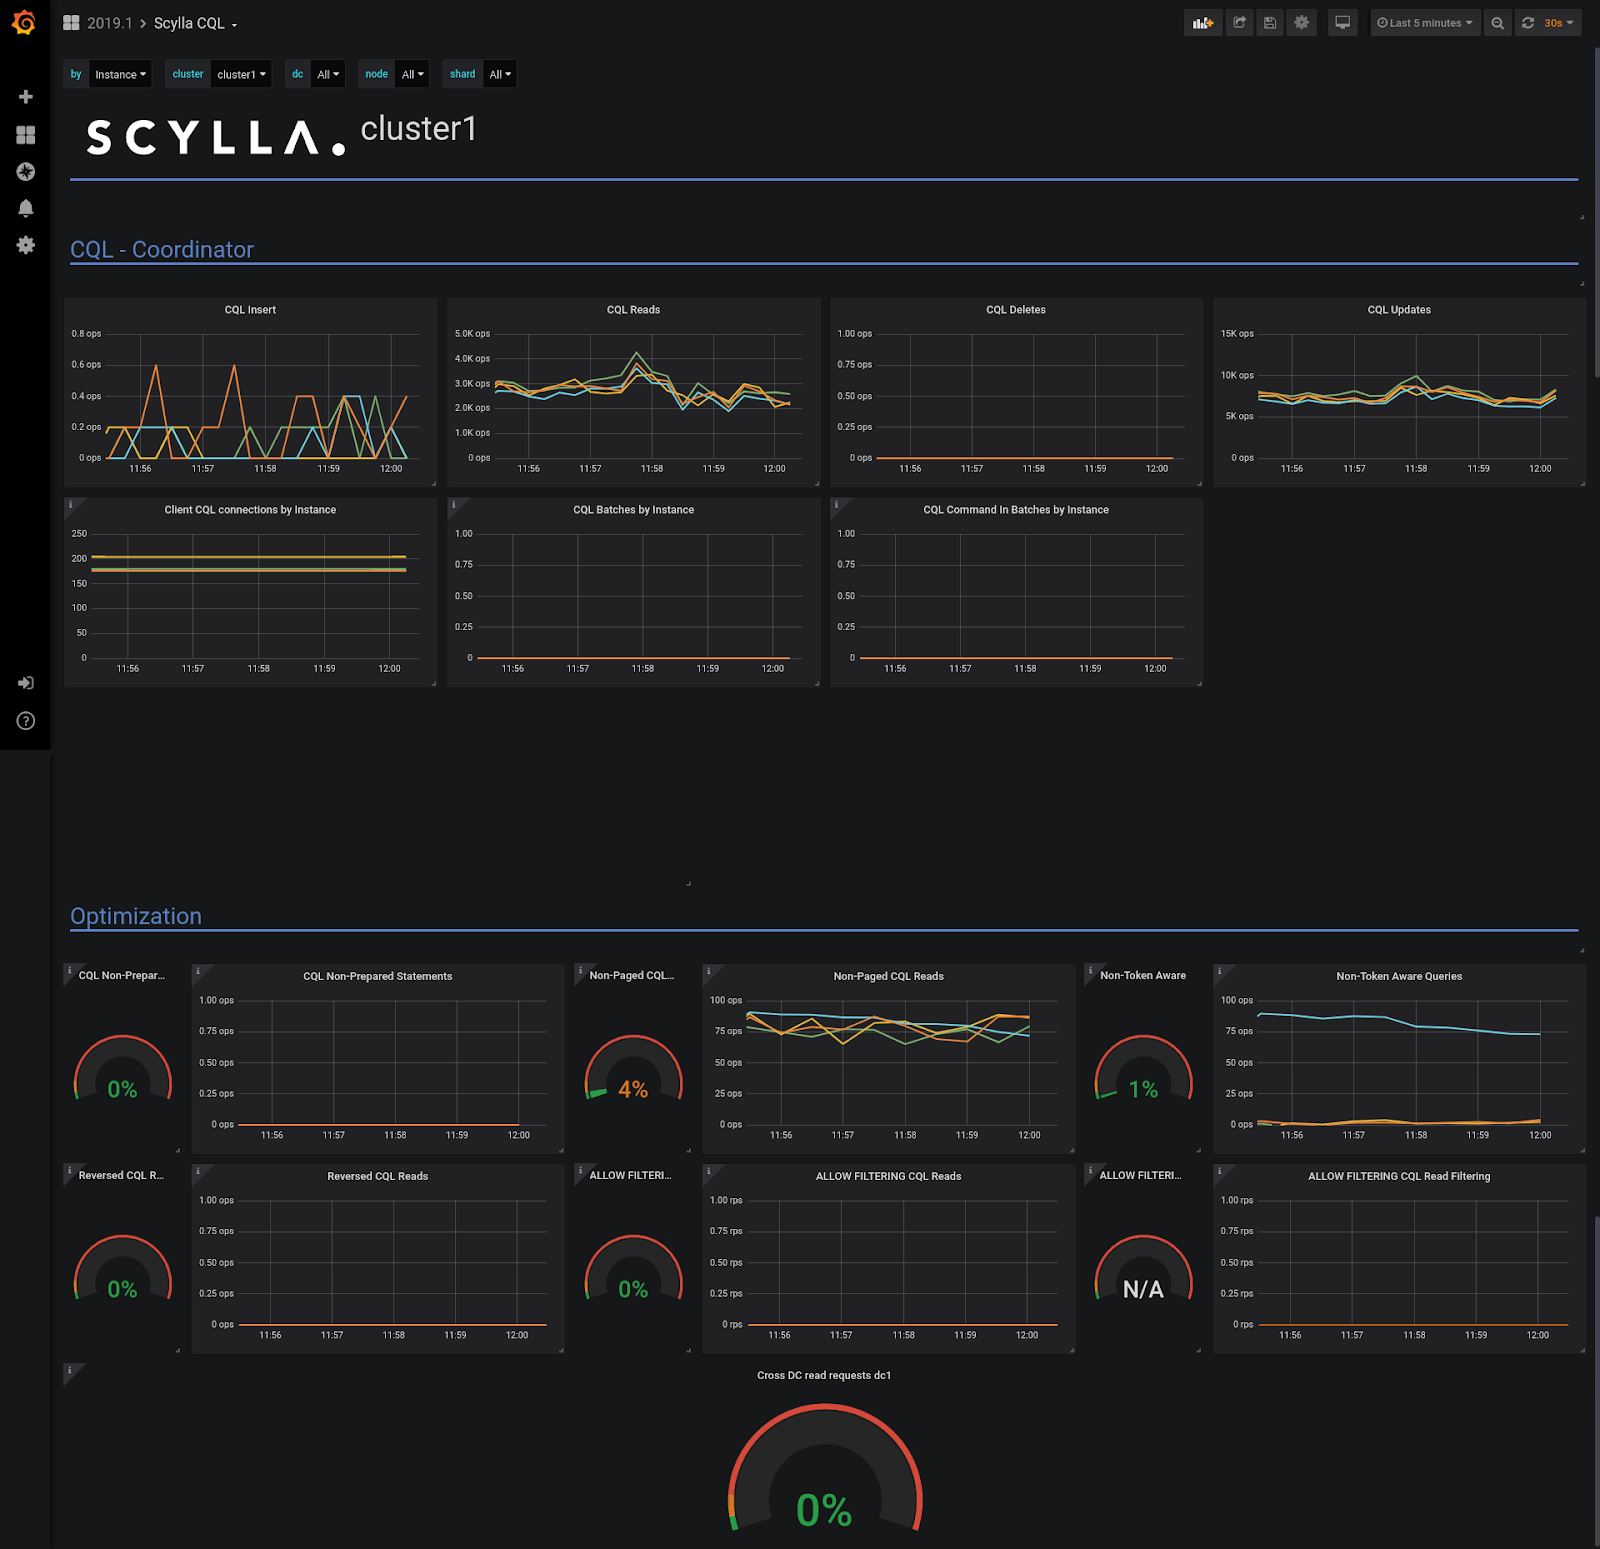
CQL
Covers cql related metrics. It contains two parts, the first, covers general CQL metrics, such as the number of Inserts and deletes. The second part is the CQL optimization section that can help you identify issues with the data model or the drivers.
Metrics Cleanup
Moved to node_exporter 0.17 metrics
ScyllaDB Monitoring relies on a node_exporter agent on each ScyllaDB node to report OS metrics. As of ScyllaDB version 2.2, we ship an installation for node_exporter 0.17 that has different metrics names than the previously used node_exporter 0.14
Make sure you are running a newer version of node_exporter, check the upgrade guide for details on how to upgrade the node_exporter, if needed.
Stack Components Upgrade
Switched to Grafana 6
We upgraded to Grafana version 6.3. There are minor visual changes, but the upgrade will allow us to use newer functionality in the future.
Switched to Python3
We use Python for dashboards generation and for the genconfig utility. If you are using one of these you will need python3 installed on your system.
Next steps
Now that you’ve seen the changes that were made in ScyllaDB Monitoring Stack 3.0 to make it even better the next step is yours! Download ScyllaDB Monitoring Stack 3.0 directly from Github. It’s free and open source. If you try it, we’d love to hear your feedback, either by contacting us privately or sharing your experience with fellow users on our Slack channel.