
If you are a ScyllaDB user, you must be familiar by now with ScyllaDB Monitoring Stack (downloadable for free from Github) which is the recommended way to monitor ScyllaDB.
We just released ScyllaDB Monitoring Stack version 2.2. There are a few configuration simplifications you should be aware of and there is an exciting new dashboard for CQL optimization we hope you’ll find useful.
CQL Optimization Dashboard
The new CQL Optimization Dashboard is a tool to help identify potential issues with queries, data model and driver.
The concept of the dashboard was introduced in ScyllaDB Summit 2018. If you missed it, you can see the talk by Shlomi Livne below:
And you can see the slides here.
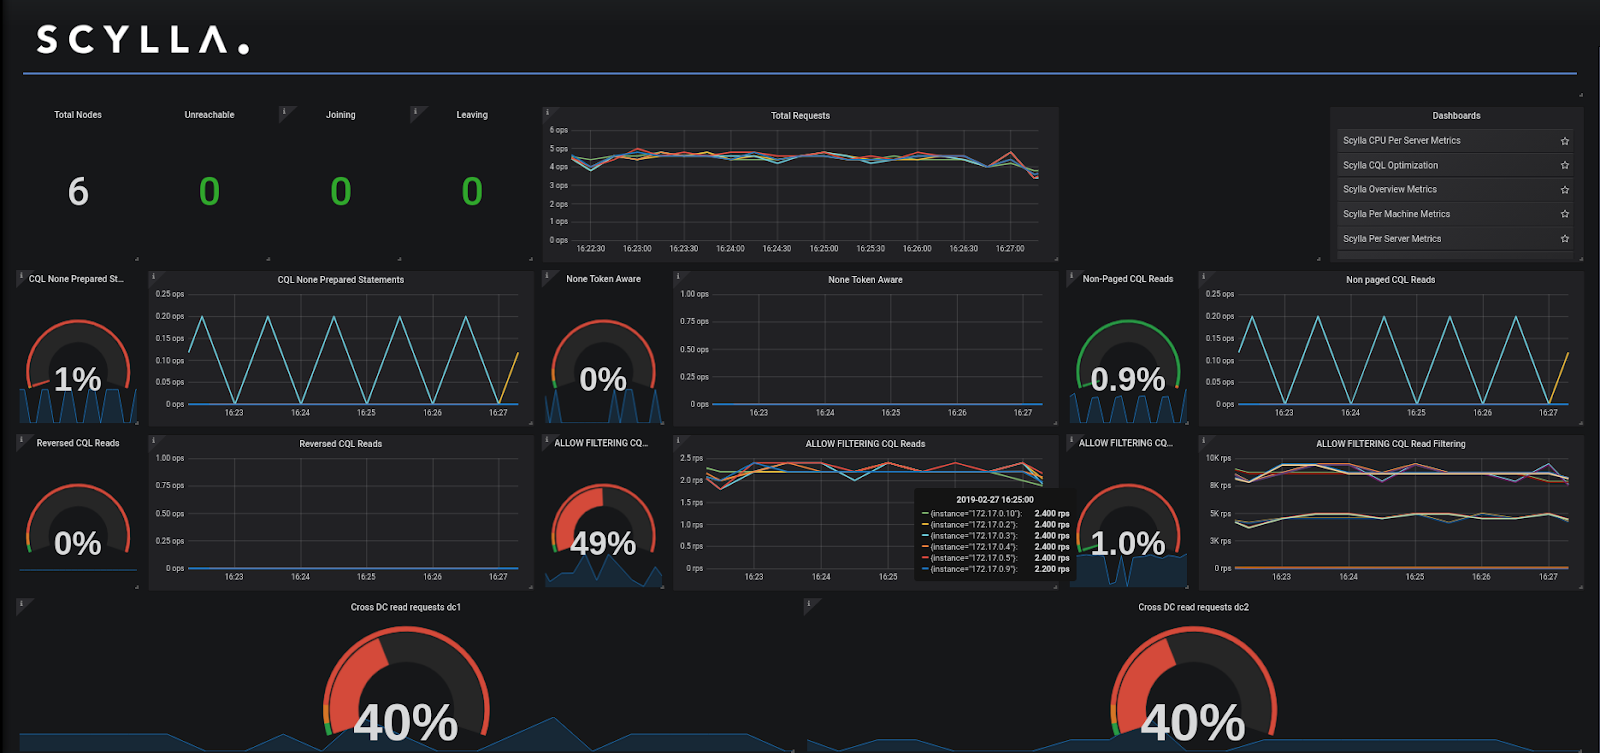
The dashboard holds gauges and graphs, which we’ll describe in detail below. When inspecting the system, apart from transactions per second (tps, ops, rps, wps), we’d like the gauges to be near zero and the graphs as low as possible.
Note that besides your queries, there are queries generated by the cql driver and internal queries to the system tables which can be misleading when testing with low traffic, as you maybe looking at traffic not generated by your application. The numbers are negligible compared to real traffic, but when the system is idle or close to it, it may look like you have high percent of non-optimized queries.
Let’s go over the panels and see what do they mean and how can we use them to get better performance.
The examples below are written in Python, using the Cassandra Python Driver, but the same optimization advises apply to all other Cassandra and ScyllaDB drivers
Prepared Statements
Prepared statements are queries that are first defined as a template with place holders for the values and then that template is used multiple times with different values.
Using prepared statements have the following benefits:
- The database only needs to parse the query once.
- The driver can route the query to the right node.
- Using place-holders and values is safer and prevent CQL-Injection.
Look at the two queries below:
cluster = Cluster()
session = cluster.connect()
# Option 1, Tempting, but wrong
query = "SELECT * FROM users where user_id = ID".replace(‘ID’,id);
session.execute(query)
# Option 2, Prepare for the rescue
stmt = session.prepare("SELECT * FROM users WHERE user_id=?")
session.execute(stmt, [id])
We have two examples for a select query that is performed multiple times, each time with a different user_id.
As you can see in Option 2, we prepare a statement (called stmt) and use it later when needed. Using the first option is not only unsafe (rife for a potential CQL injection) but would also cause the server to spend cycles to parse the query on each call.
Use these panels to quickly identify Non-Prepared Queries on your cluster and fix them:
- The CQL Non-Prepared Queries Gauge shows the percentage of queries that are not prepared.
- The CQL Non-Prepared Queries Graph shows the rate at which non-prepared queries are executed.
Make sure both are low, and as close to zero as possible.
Token Aware
ScyllaDB is a distributed database where each node contains only a part of the data. Despite that, any node can serve as a coordinator for a given query and in case the data is in a different node the request coordinator will contact the correct node.
Although requests can be routed through any node, ideally a request will reach a node that holds the data (either the primary owner or one of the replicas) doing away for the need of the extra network hop, which in turn results in increased latency.
Typically, your driver would know how to route the queries to a replication node, but using non-prepared statements, non-token-aware driver or external load-balancer can cause the query to reach a node that is not a replica.
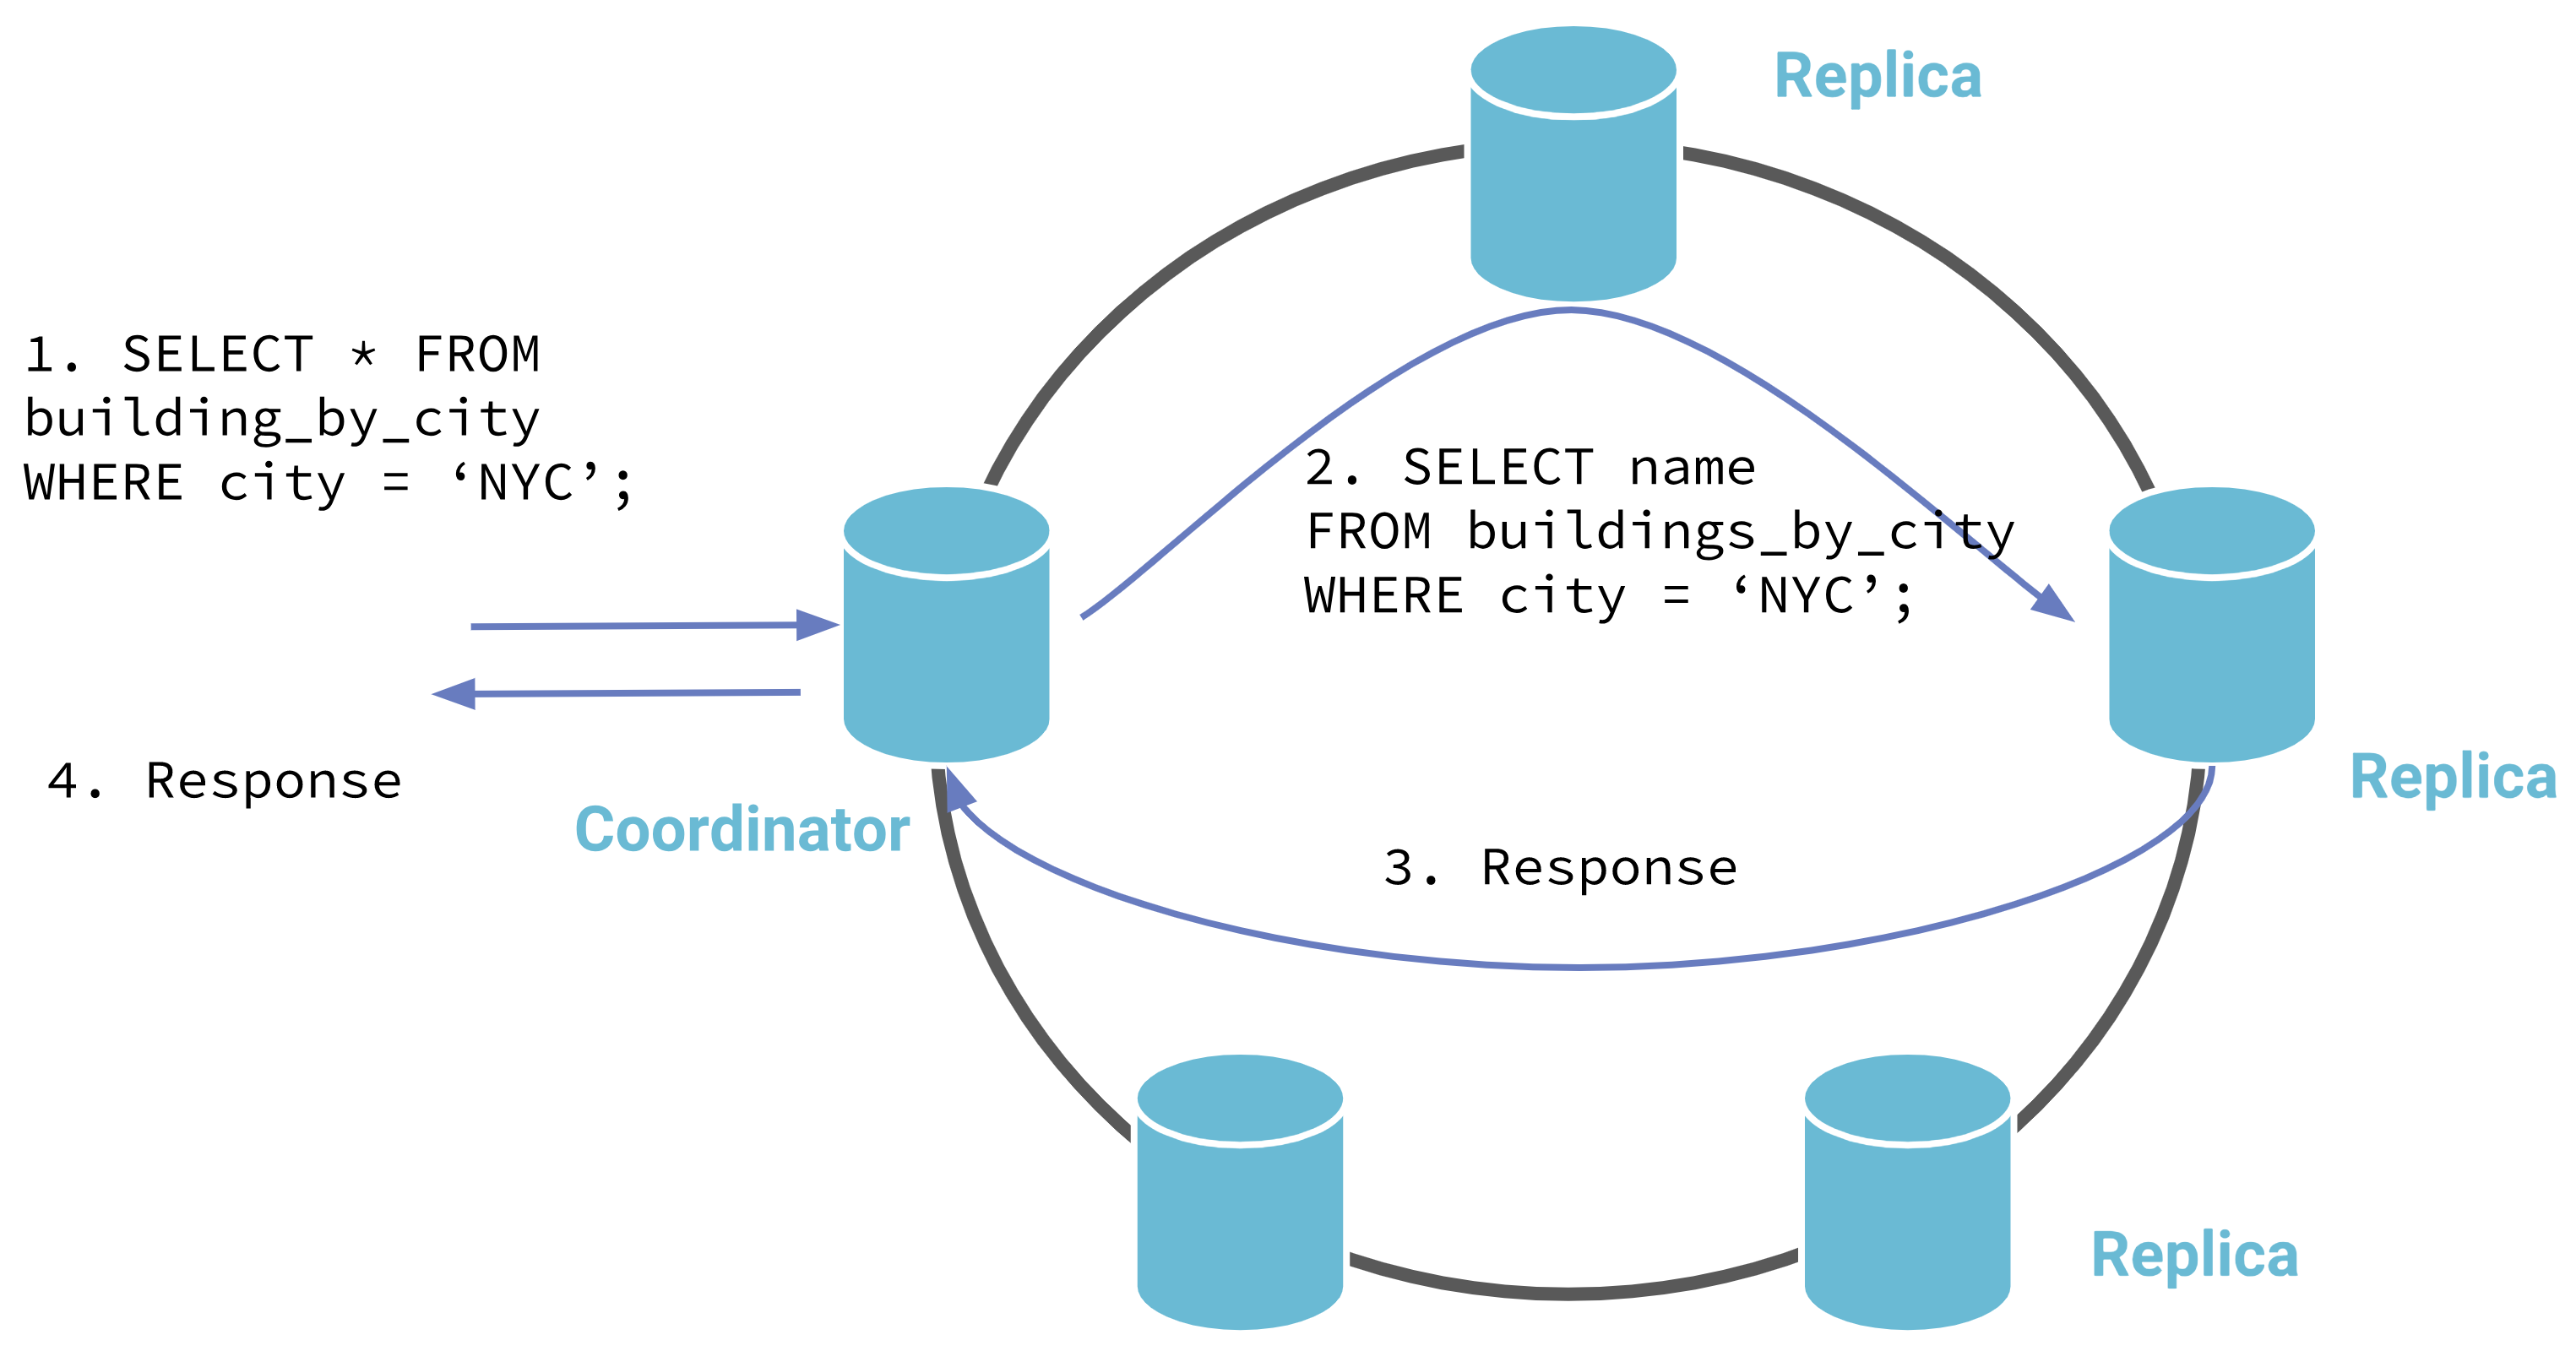
Non-Token Aware Driver: coordinator is chosen randomly Token
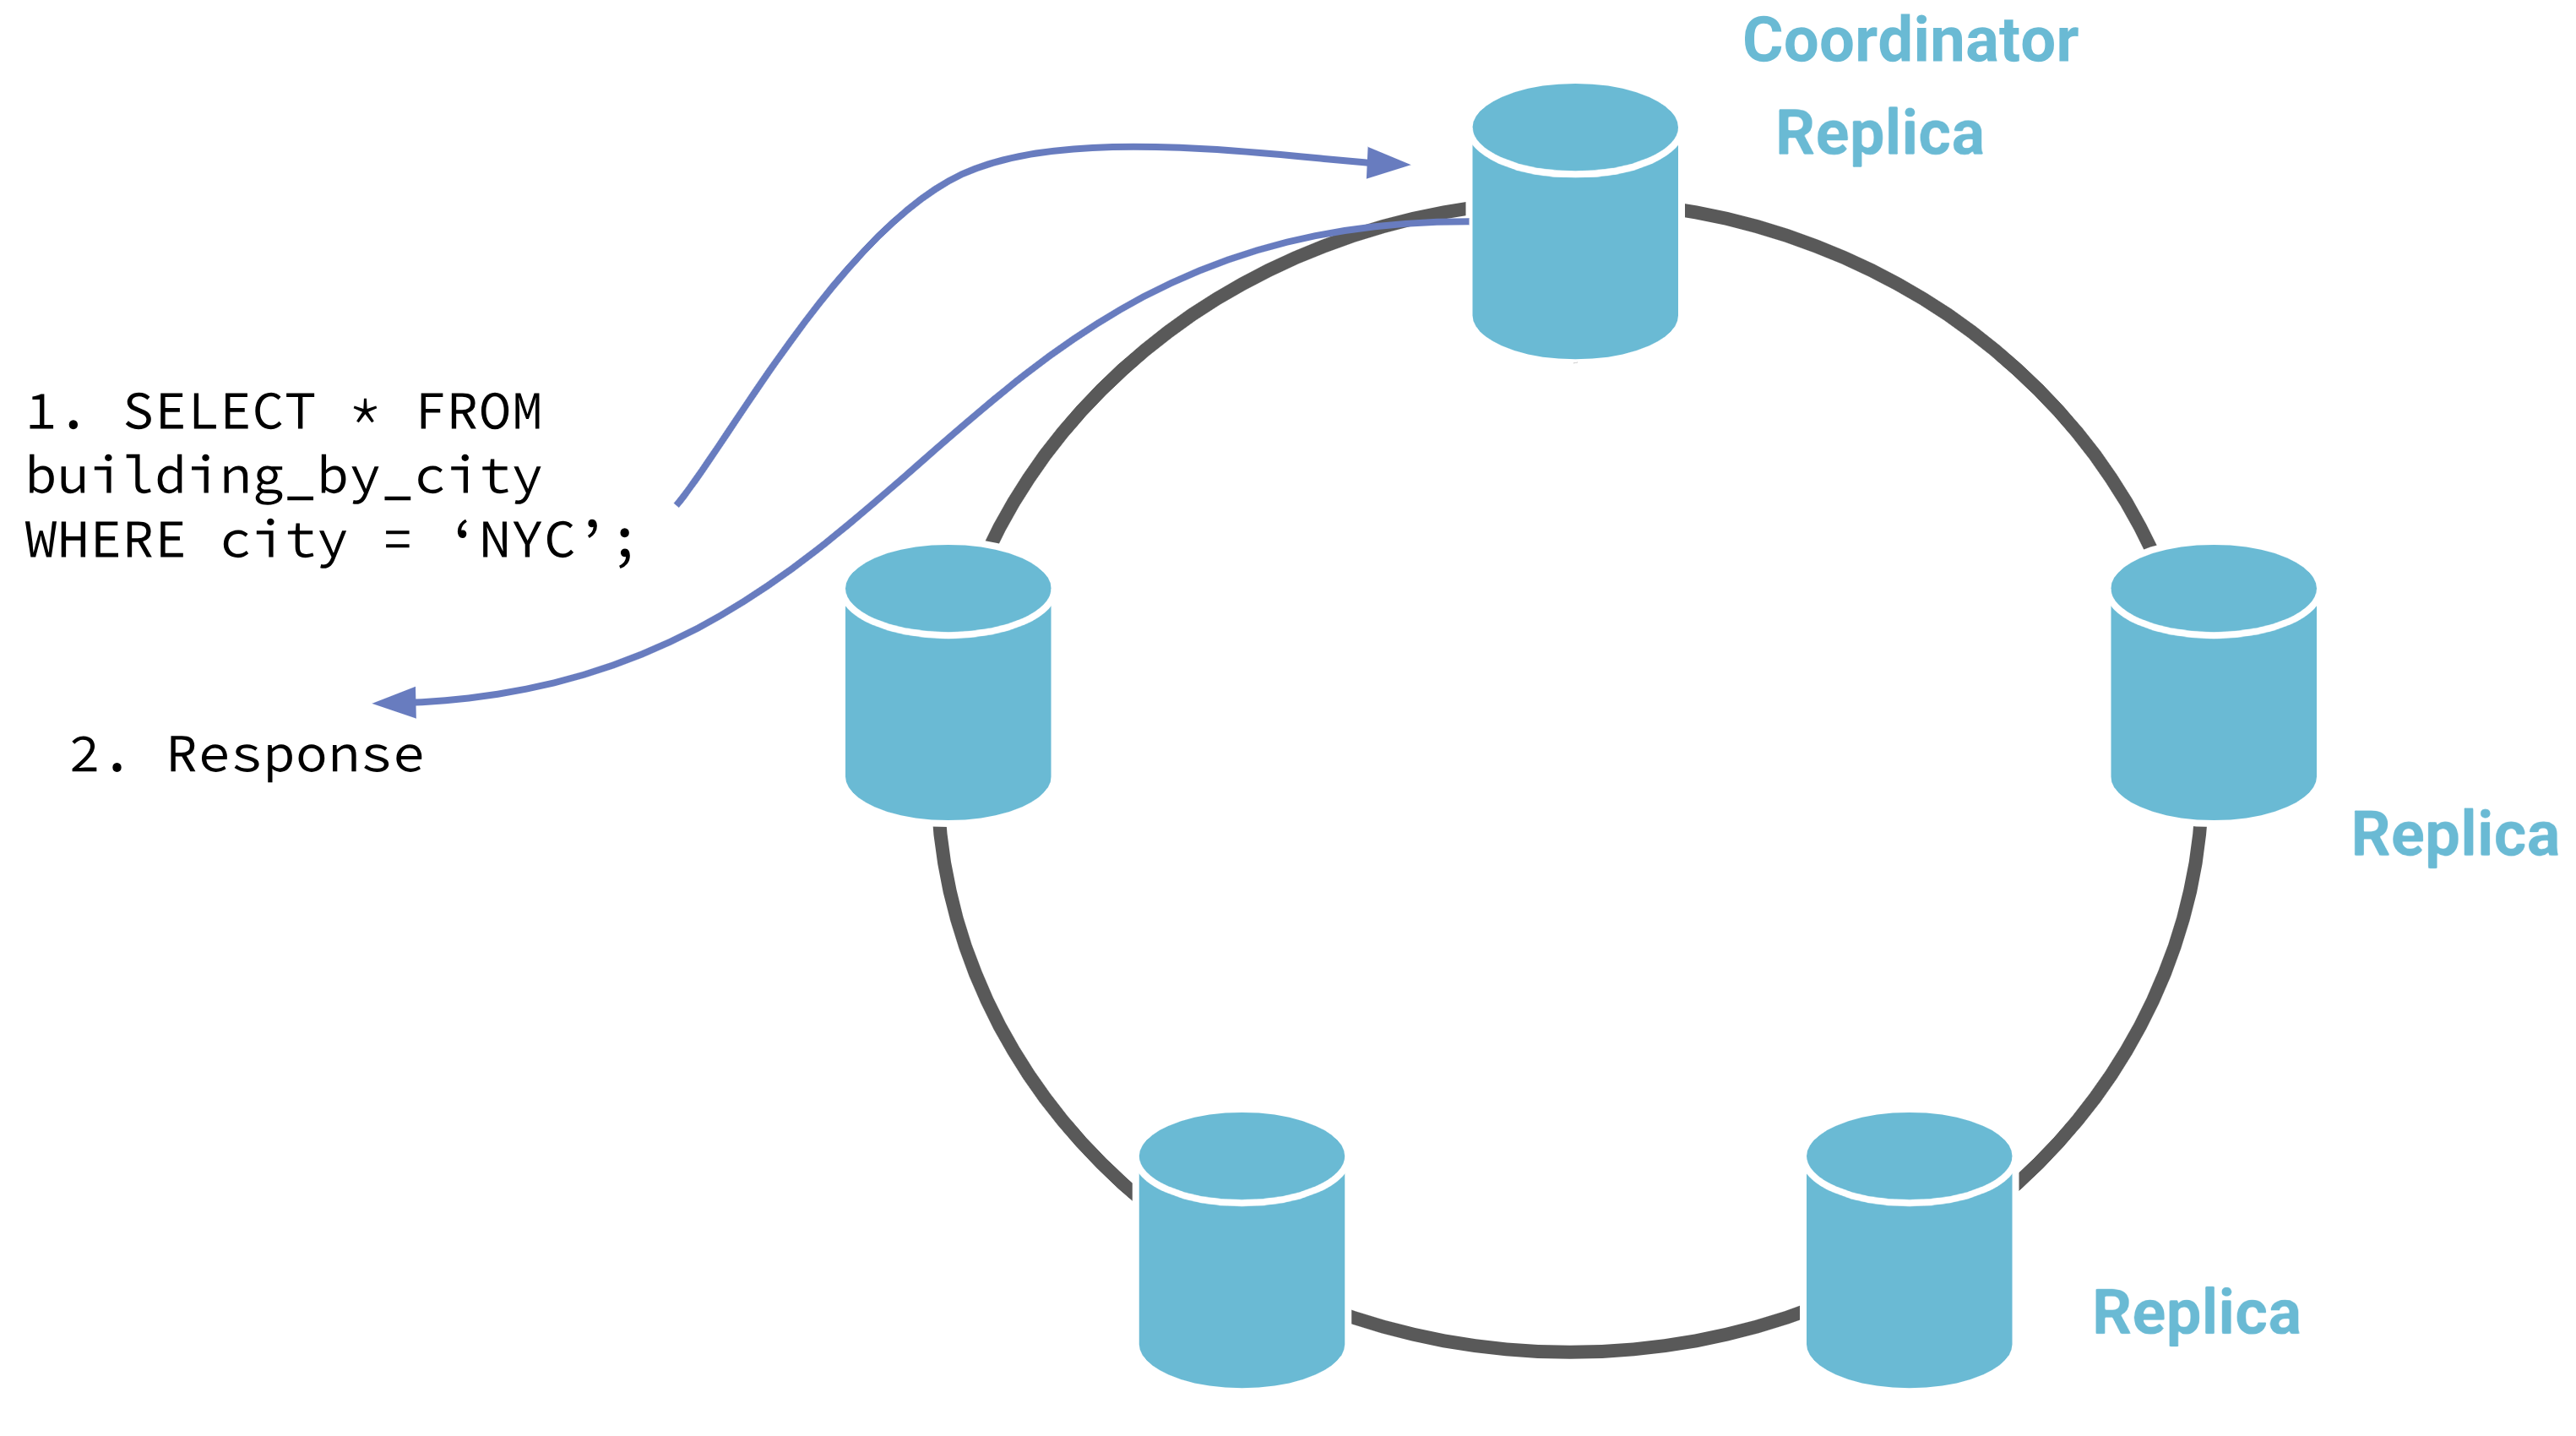
Token Aware Driver: coordinator is chosen from the replicas
Take another look at the Prepared Statement example above, Using the first option would mean that the driver does not know where to send your query.
Use these panels to quickly identify Non-Token aware driver and fix them:
- The Non-Token Aware Gauge shows the percentage of queries that reached a node that does not hold that data (a node that is not a replica-node)
- The Non-Token Aware Queries Graph shows the rate of the queries that did not reach a replica-node
Make sure both are low, and as close to zero as possible.
Paged Queries
Read queries are paged by default. This means ScyllaDB will break the results into multiple chunks limiting the reply size. Non-paged queries require all results be returned in one result increasing the overall load of the system and clients and should be avoided.
Look at the following command:
session.execute(SimpleStatement(query_string=qs, fetch_size=0))
By setting the page size to 0, we disabled paging.
Use these panels to quickly identify non-paged queries on your cluster and fix them:
- The Non-Paged CQL Reads Gauge shows the percentage of non-paged read queries that did not use paging
- The Non-Paged CQL Reads Graph shows the rate of the non-paged queries
Make sure both are low.
Reversed CQL Reads
ScyllaDB supports compound primary keys with a clustering column. This kind of primary keys allows an efficient way to return results that are sorted by the clustering column.
Querying with an order different than the order the CLUSTERING ORDER BY was defined is inefficient and should be avoided. You can read more about it here.
For example, look at the following table:
CREATE TABLE ks1.table_demo (
   category text,
   type int,
   PRIMARY KEY (category, type))
WITH CLUSTERING ORDER BY (type DESC);
In each partition (category) the rows are ordered by type in descending order.
The following query uses reverse order, asking for rows in ascending order, which is inefficient:
session.execute(‘select * from ks1.table_demo where category='cat1' order by type ASC’)
Use these panels to quickly identify queries that use the wrong row ordering, so you can either fix your queries or the stored data modeling:
- The Reversed CQL Reads Gauge shows the percentage of read queries that use ORDER BY that is different than the
CLUSTERING ORDER BY - The Reversed CQL Reads Graph shows the rate of the read queries that use ORDER BY that is different than the
CLUSTERING ORDER BY
Make sure both are low and as close to zero as possible.
ALLOW FILTERING
ScyllaDB supports server-side data filtering that is not based on the primary key. This means ScyllaDB would read data and then filter and return part of it to the user. Data that is read and then filtered is an overhead to the system.
To prevent users from using server-side filtering by mistake you explicitly need to add ALLOW FILTERING to your query. These kinds of queries can create a big load on the system and should be used with care.
The CQL optimization dashboard check for two things related to queries that use ALLOW FILTERING: first, how many such queries exist and, secondly, how much of the data that was read was dropped before returning to the client.
Use these panels to quickly identify queries that use ALLOW FILTERING, and evaluate if these queries are required:
- The ALLOW FILTERING CQL Reads Gauge shows the percentage of read-queries that use
ALLOW FILTERING. - The ALLOW FILTERING CQL Reads Graph shows the rate of the read queries that use
ALLOW FILTERING; Make sure both are low. - The ALLOW FILTERING Filtered Rows Gauge shows the percentage of rows that were read and then filtered, this is an indication of the additional overhead to the system.
- The ALLOW FILTERING Filtered Rows Graph shows multiple graphs: the rows that were read, and the rows that matched and the rows that were dropped. Rows that were dropped are an additional overhead to the system.
Cross DC read requests
Note: The Cross DC panels in the CQL Optimization Dashboard relies on the definition of nodes per Data Center in the Monitoring Stack (prometheus/scylla_servers.yml) to match the Data Center names used in ScyllaDB Cluster. If this is not the case, you will see the wrong result.
In a typical situation, a client performs a read from the nearest data-center and that query is performed locally to the data-center. A read request that ends up causing traffic between data-centers adds additional overhead to the system.
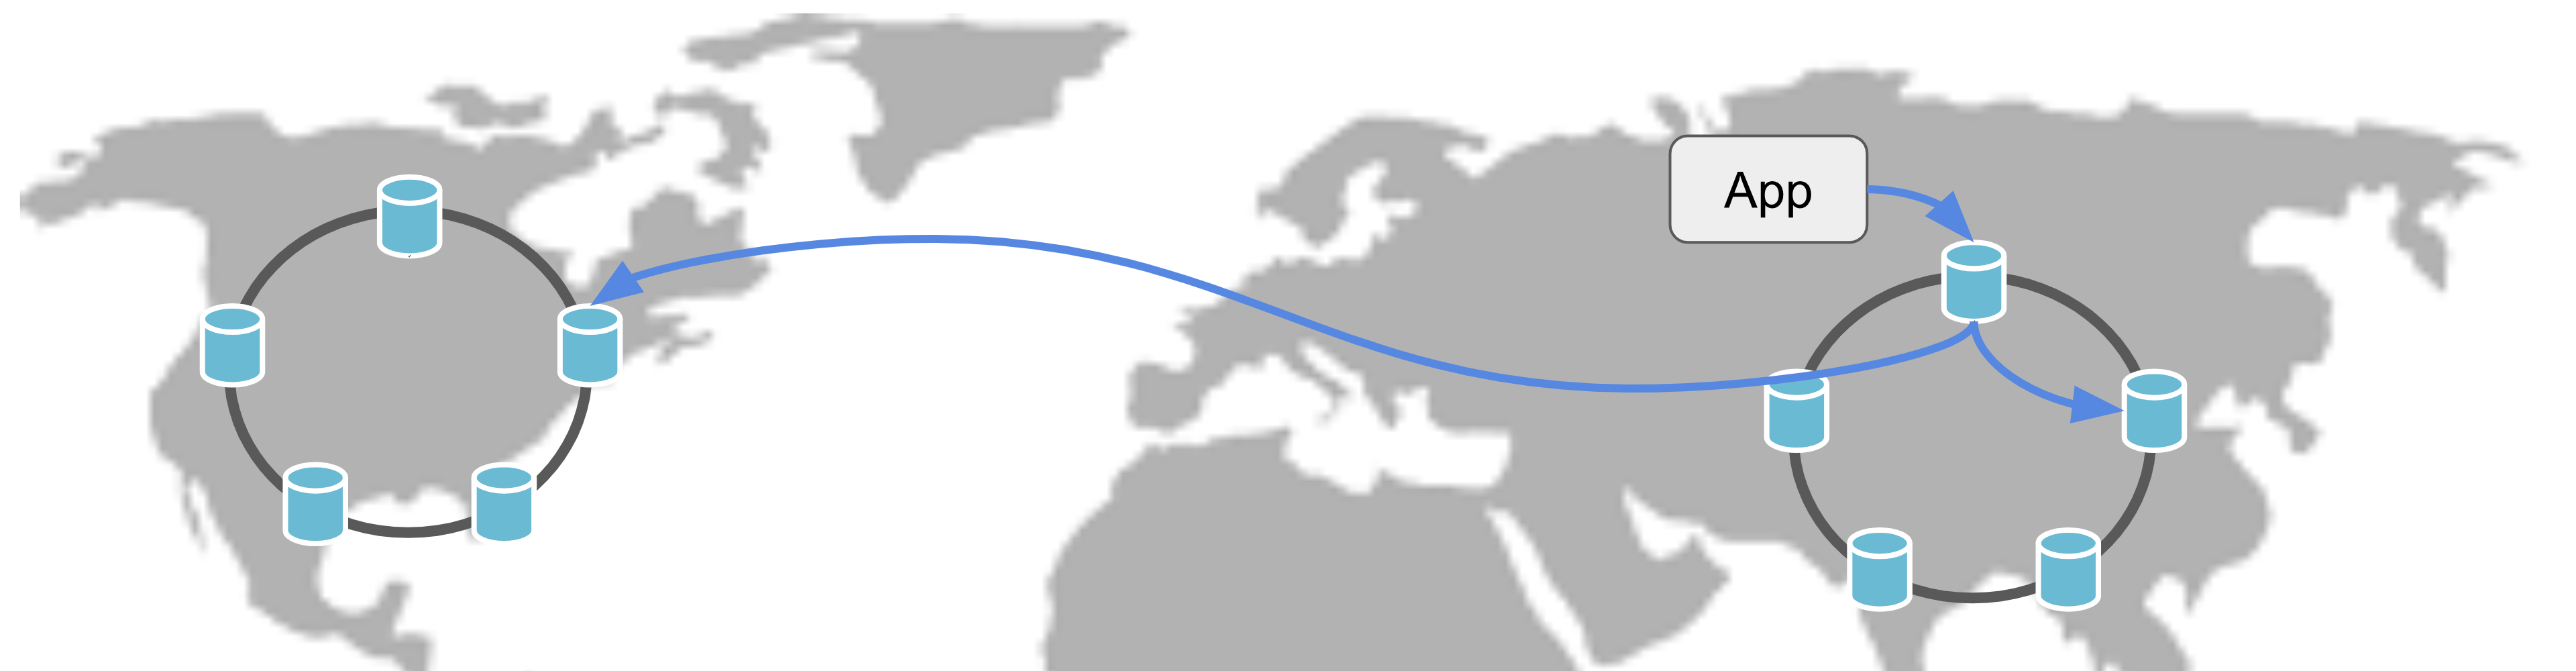
Using CL=QUORUM in a SELECT query with two remote DCs
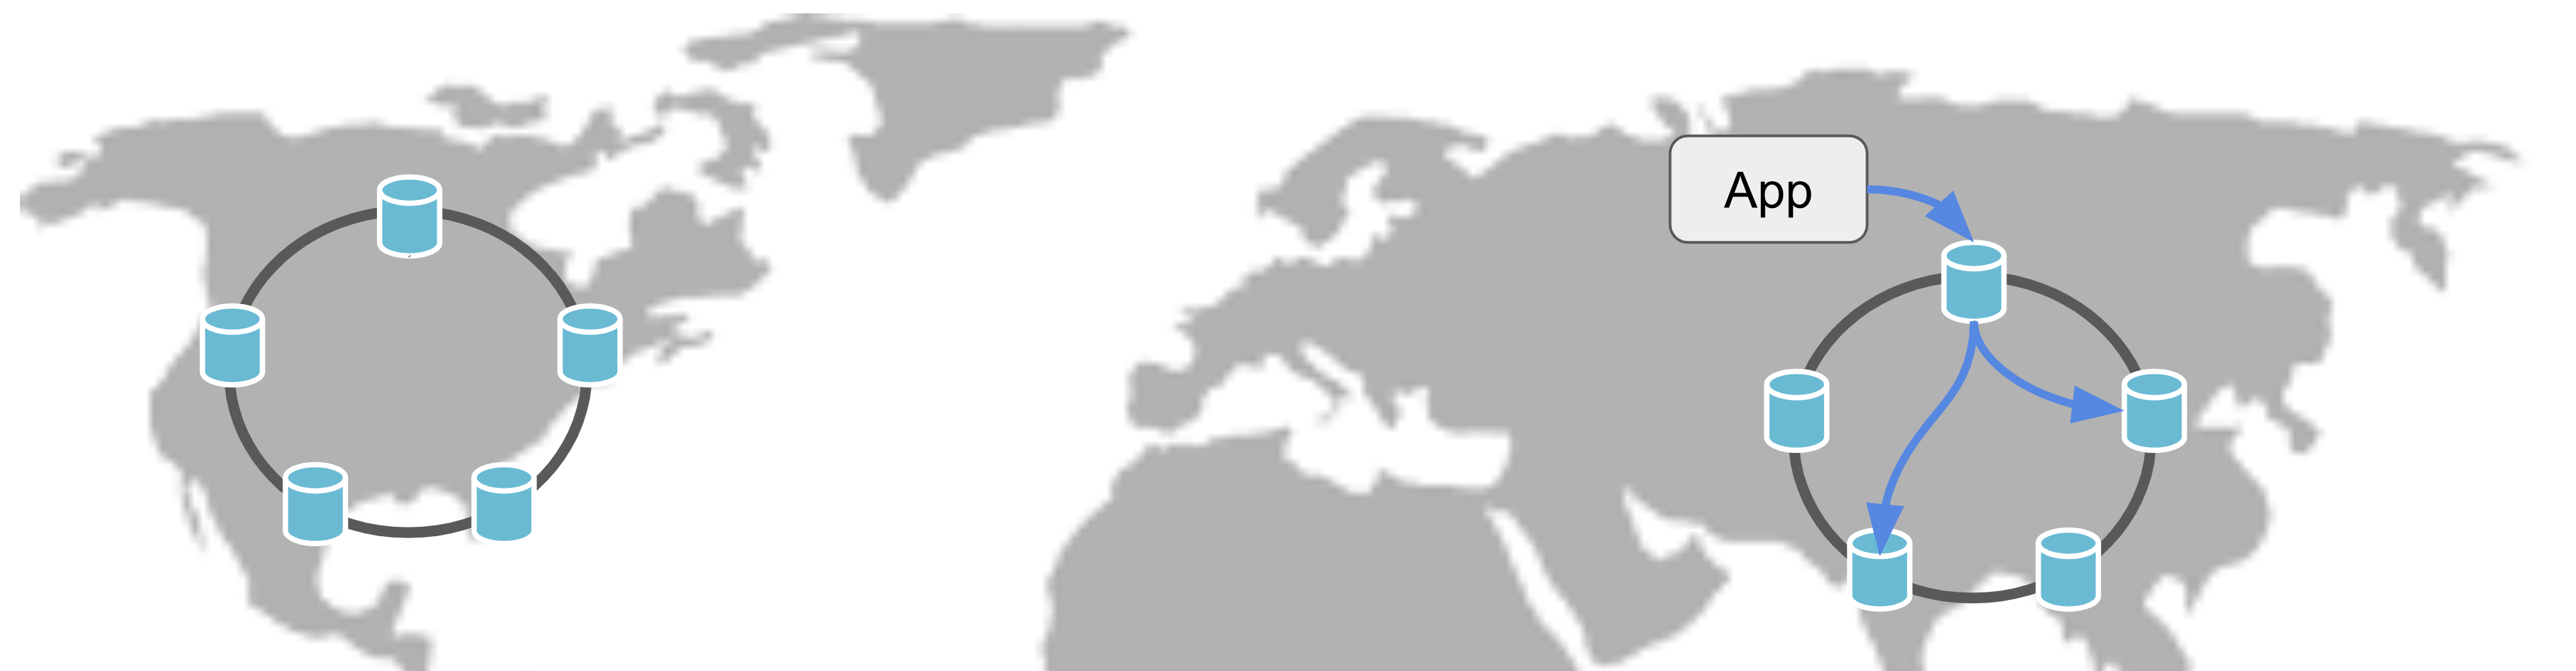
Using CL=LOCAL_QUORUM in a SELECT query with two remote DCs
An example of such a scenario is when a request is performed with consistency level QUORUM from a multi-DC cluster.
session.execute(SimpleStatement(query_string=qs, consistency_level=ConsistencyLevel.QUORUM))
This kind of query would force cross DC traffic.
Use this panel to quickly identify cross DC reads, and eliminate them if possible:
- The Cross DC read requests Gauge shows the percentage of read-queries that caused a request to an external data-center. Make sure it is low or zero.
Conclusion
We’ve seen multiple potential CQL pitfalls that can hurt your overall performance and learned about the CQL Optimization Dashboard that can help us identify it.
Make sure to check this dashboard, starting from when you develop your application and get back to it from time to time to see if anything has changed.
Remember, start by looking at the gauge, if it’s not zero (or close to zero) try to understand why.