ScyllaDB Cloud Users: Please note that the following instructions don’t apply as of 2023. For the latest instructions, see https://monitoring.docs.scylladb.com/stable/procedures/datadog/.
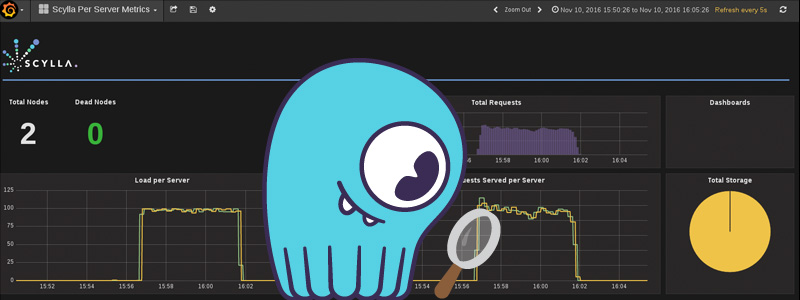
As an open-source project, our ScyllaDB NoSQL database has an open-source monitoring stack, ScyllaDB Monitoring Stack. It uses Prometheus as the reporting and collecting layer and Grafana for dashboard creation. Prometheus pulls metrics directly from each ScyllaDB Server.
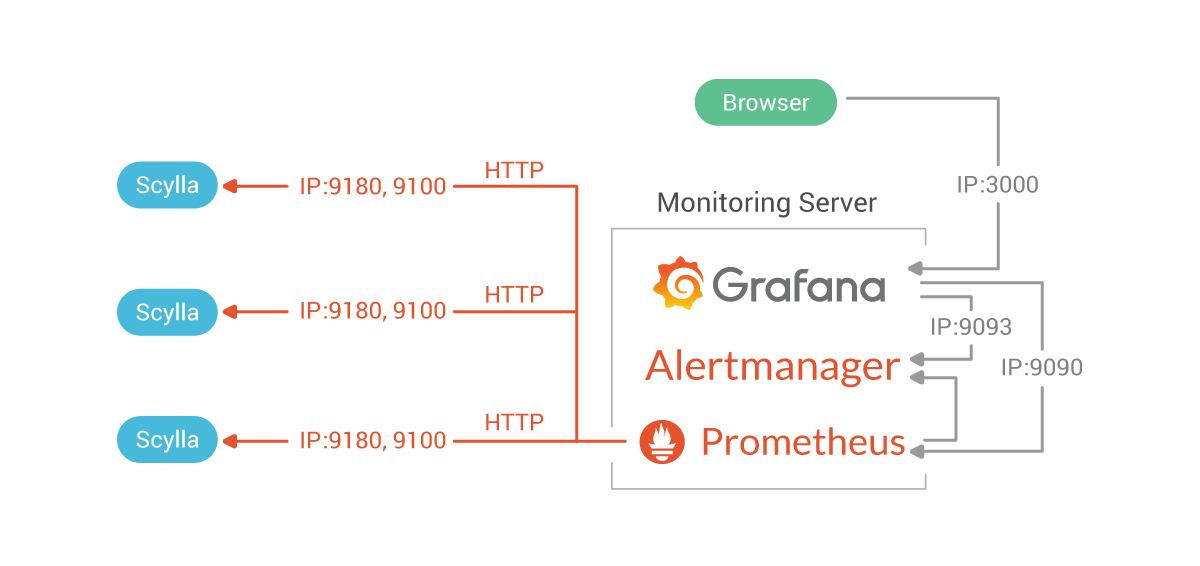
The ScyllaDB Monitoring Stack
A question we keep getting from customers is: “How can I monitor ScyllaDB with Datadog?” And more generally “How do you integrate Datadog and Prometheus?”
I went to find out and returned with two answers. You can sort out the first from Datadog documentation, but there’s an alternative and more surprising answer — read to the end to see it. If you want to use this solution for your other applications, you can replace “ScyllaDB” below with your application.
Before we go any further, a few words about Prometheus.
Prometheus essentials
Prometheus is an open-source monitoring solution. It uses a pull-based approach, as the Prometheus server “scrapes” its targets periodically. Prometheus reads the targets directly from applications that have a Prometheus API (like ScyllaDB does) or use exporters for applications that do not.
Prometheus protocol is text-based and human-readable so if at any point you have an issue with the data, you can point your browser or use curl to fetch the metrics directly.
For example, you can look at ScyllaDB’s metrics by calling:
$ curl http://localhost:9180/metricsPrometheus Datadog Integration – Local Agent
The first approach, which you will find if you check Datadog documentation, is to use a local agent (installed on the same node as the ScyllaDB database server).
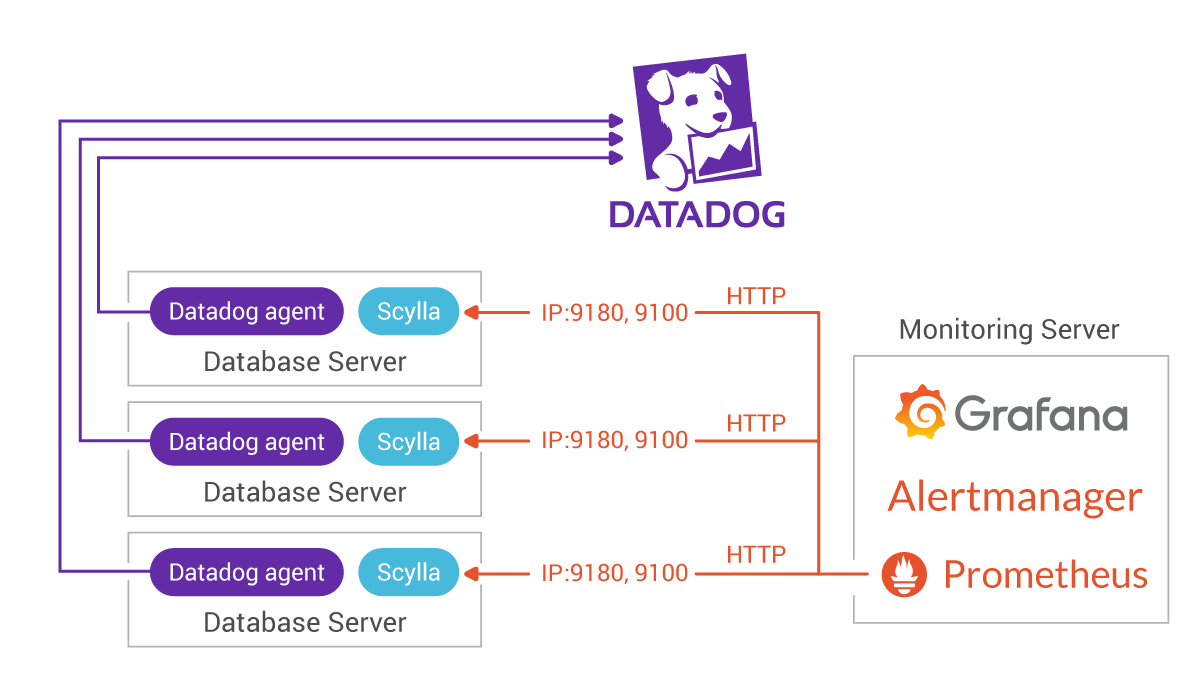
Datadog agent version 6.1.0 and onwards can read Prometheus protocol. On each of the hosts that run an application that you want to monitor (ScyllaDB in our case) run the Datadog agent and let the agent read from the application.
For this blog-post, we assume that you already have a Datadog account. You can register for a 14 day trial for free if you don’t.
Now follow these steps:
- Install the Datadog agent on each ScyllaDB server as described here.
- Create a Prometheus configuration file for the agent.
sudo cp /etc/datadog-agent/conf.d/prometheus.d/conf.yaml.example /etc/datadog-agent/conf.d/prometheus.d/conf.yaml - Edit the configuration file:
Point the prometheus_url to ScyllaDB’s Prometheus endpoint: http://localhost:9180/metrics
Set the metrics toscylla_*and set the namespace toscylla.An example of a minimal config file:init_config: instances: - prometheus_url: http://localhost:9180/metrics namespace: scylla metrics: - scylla_* - Restart the agent as described here.
- You should now be able to use the ScyllaDB metrics in your dashboard.
Please note installing an agent on each server can compete with ScyllaDB on resources. If you do choose this method, it’s recommended to limit Datadog agents by using systemd slices.
Reading directly from a Prometheus Server
If you have Datadog agents running on each of your nodes, the previous section could be good enough. But, if you are running a Prometheus server it is sometimes useful to read the metrics from the Prometheus server and not from the endpoints.
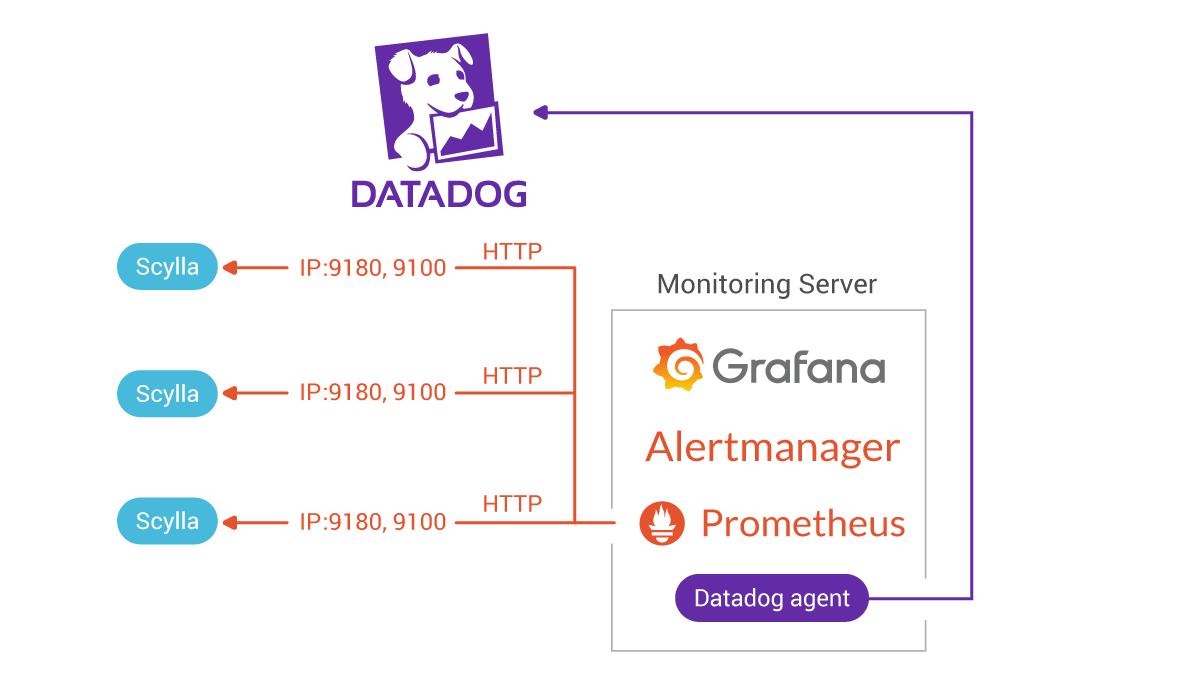
Happily enough, there is such an option using Prometheus federation. Federation allows one Prometheus server to read metrics that are stored in another server.
To use Prometheus federation with Datadog, you need the Datadog agent only on the machine that runs the Prometheus server. Install and configure the Datadog agent like in the previous section, but this time set the prometheus_url to the federate endpoint.
An example of such a configuration file:
init_config:

instances:
  - prometheus_url: http://localhost:9090/federate?match[]={job=~"scylla"}
    namespace: scylla
    metrics:
      - scylla_*
In the example, we used the match with job equals scylla, but it would work for any other monitored application with different parameters.
Note that you must supply a match parameter for the federate endpoint to work
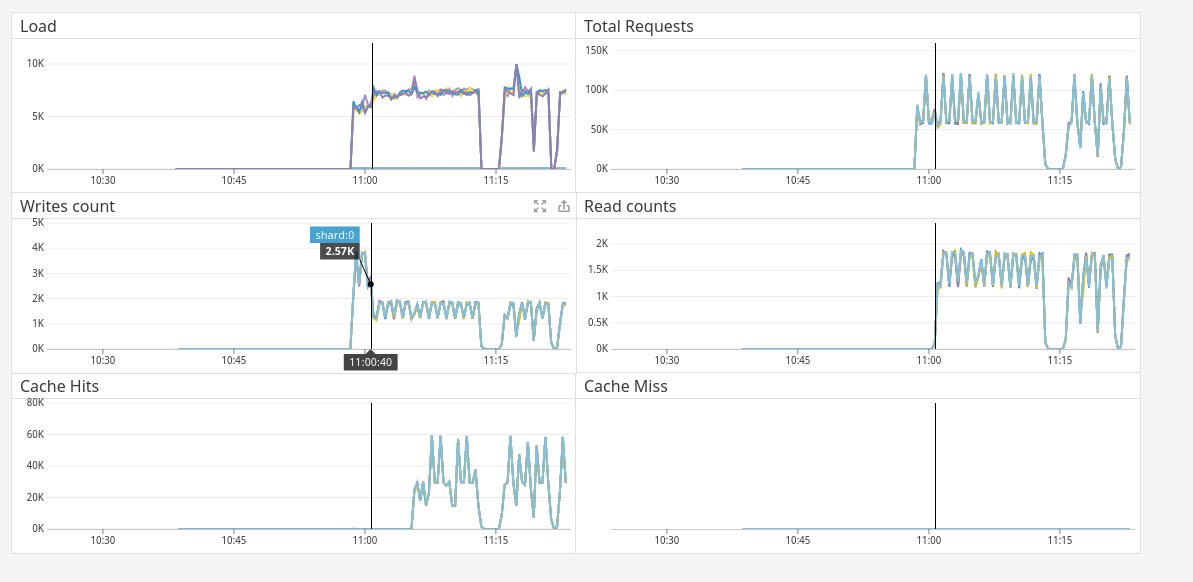
A ScyllaDB dashboard example in Datadog
To create a Datadog dashboard follow the instructions here.
When you add a graph, Datadog will show the available metrics, scylla’s metrics start with ‘scylla’.
As a reference and suggestion, you can look at ScyllaDB Monitoring Dashboards for the metrics we think are more useful.
Conclusion (and which option to choose)
There are two alternatives for reporting ScyllaDB metrics to Datadog:
- Using a local agent on each ScyllaDB server
- Using one agent on ScyllaDB Monitoring Stack, reading from Prometheus
Although both methods work, we recommend the second one for the following reasons:
- Simpler to deploy (only one agent)
- Does not risk ScyllaDB by running an additional process on each DB server. Such an agent may compete with ScyllaDB on server resources, bandwidth etc.
Please note, both methods can work in parallel to ScyllaDB Monitoring Stack.
We recommend having ScyllaDB Monitoring Stack in place, even if you are using DataDog. ScyllaDB Monitoring dashboards are very rich and useful and will help our support team to debug any issue you might have.