
The ScyllaDB team is pleased to announce the release of ScyllaDB Monitoring Stack 3.3
ScyllaDB Monitoring Stack is an open-source stack for monitoring ScyllaDB Enterprise and ScyllaDB Open Source, based on Prometheus and Grafana. ScyllaDB Monitoring Stack 3.3 supports:
- ScyllaDB Open Source versions 3.1, 3.2, 3.3 and the upcoming 4.0
- ScyllaDB Enterprise versions 2018.x and 2019.x
- ScyllaDB Manager 1.4.x, 2.0.x and the upcoming ScyllaDB Manager 2.1
Related Links
- Download ScyllaDB Monitoring 3.3
- ScyllaDB Monitoring Stack Docs
- Upgrade from ScyllaDB Monitoring 3.x to 3.y
New in ScyllaDB Monitoring Stack 3.3
- ScyllaDB OS 4.0 dashboards #871
- ScyllaDB Manager dashboard 2.1 #899
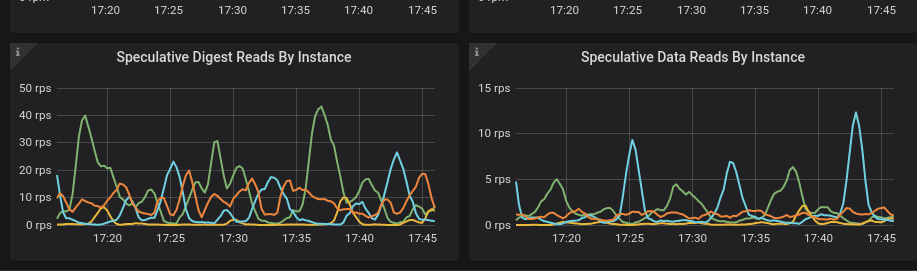
- Shows speculative execution in official detail dashboard #880
Speculative Retry is a mechanism that the client or server retries when it speculates that the request would fail even before a timeout occurred. In a high load, this can overload the system and would cause performance issues.
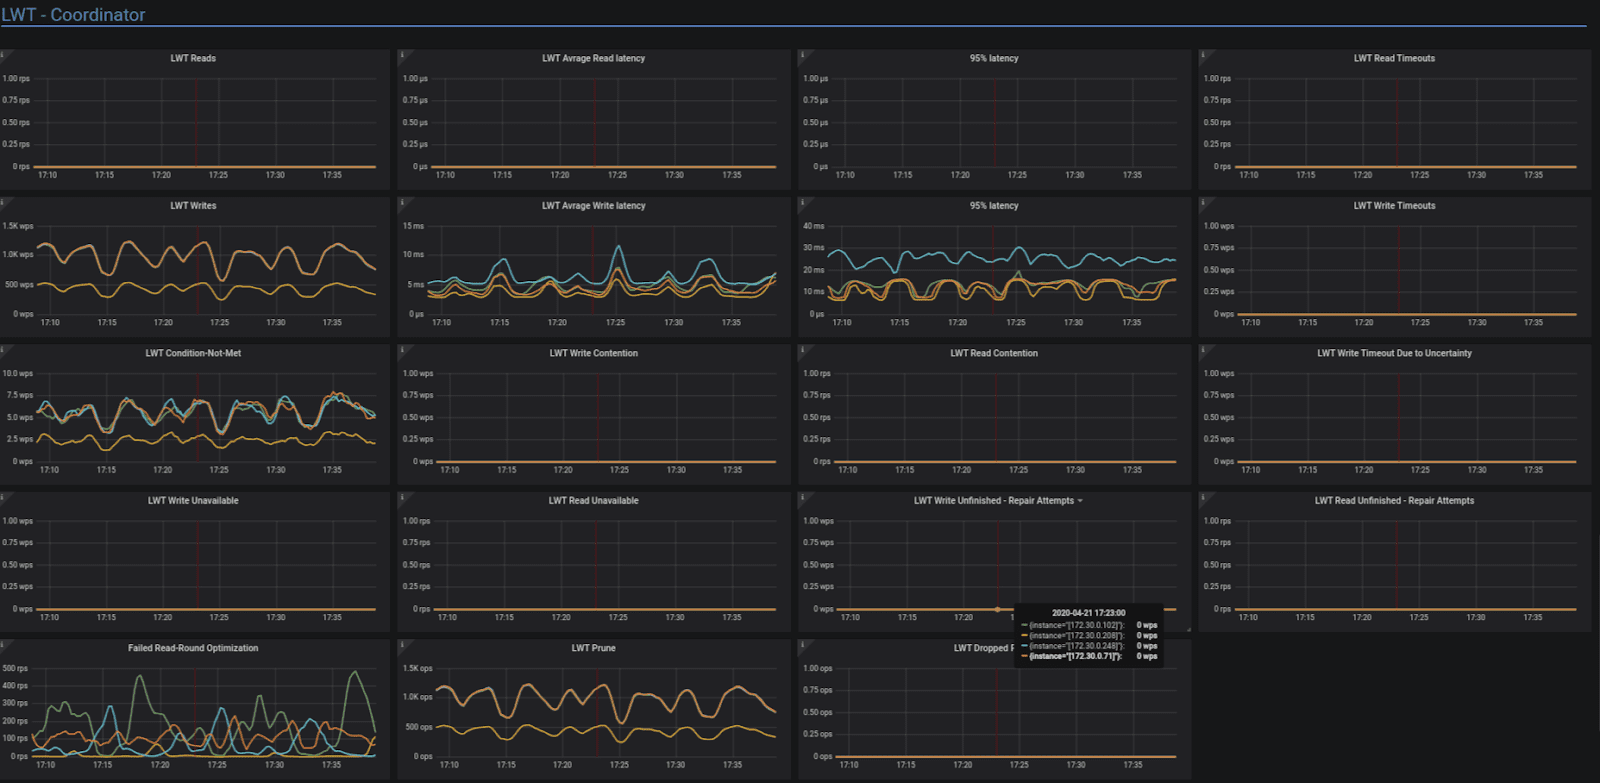
- Adding LWT panels #875
The LWT section in the Detailed dashboard has a new section to help identify performance issues:- LWT Condition-Not-Met: An LWT INSERT, UPDATE or DELETE command that involves a condition will be rejected if the condition is not met. Based on
scylla_storage_proxy_coordinator_cas_write_condition_not_met. - LWT Write Contention: Number of times some INSERT, UPDATE or DELETE request with conditions had to retry because there was a concurrent conditional statement against the same key. Each retry is performed after a randomized sleep interval, so it can lead to statement timing out completely. Based on
scylla_storage_proxy_coordinator_cas_write_contention_count. - LWT Read Contention: Number of times some SELECT with SERIAL consistency had to retry because there was a concurrent conditional statement against the same key. Each retry is performed after a randomized sleep interval, so it can lead to statement timing out completely. Based on
scylla_storage_proxy_coordinator_cas_read_contention_count. - LWT Write Timeout Due to Uncertainty: Number of partially succeeded conditional statements. These statements were not committed by the coordinator, due to some replicas responding with errors or timing out. The coordinator had to propagate the error to the client. However, the statement succeeded on a minority of replicas, so may later be propagated to the rest during repair. Based on
scylla_storage_proxy_coordinator_cas_write_timeout_due_to_uncertainty. - LWT Write Unavailable: Number of times a INSERT, UPDATE, or DELETE with conditions failed after being unable to contact enough replicas to match the consistency level. Based on
scylla_storage_proxy_coordinator_cas_write_unavailable. - LWT Read Unavailable: Number of times a SELECT with SERIAL consistency failed after being unable to contact enough replicas to match the consistency level. Based on
scylla_storage_proxy_coordinator_cas_read_unavailable. - LWT Write Unfinished – Repair Attempts: Number of Paxos-repairs of INSERT, UPDATE, or DELETE with conditions. Based on
scylla_storage_proxy_coordinator_cas_write_unfinished_commit. - LWT Read Unfinished – Repair Attempts: Number of Paxos-repairs of SELECT statement with SERIAL consistency. Based on
scylla_storage_proxy_coordinator_cas_read_unfinished_commit. - Failed Read-Round Optimization: Normally, a PREPARE Paxos-round piggy-backs the previous value along with the PREPARE response. When the coordinator is unable to obtain the previous value (or its digest) from some of the participants, or when the digests did not match, a separate repair round has to be performed. Based on
scylla_storage_proxy_coordinator_cas_failed_read_round_optimization. - LWT Prune: Number of pruning requests. Based on
scylla_storage_proxy_coordinator_cas_prune. - LWT Dropped Prune: Number of Dropped pruning requests. Based on
scylla_storage_proxy_coordinator_cas_dropped_prune.
- LWT Condition-Not-Met: An LWT INSERT, UPDATE or DELETE command that involves a condition will be rejected if the condition is not met. Based on
- More on LWT here
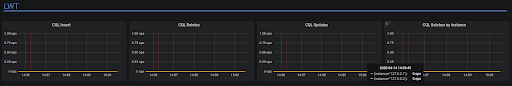
The CQL Dashboard has a new LWT section with panels for Conditional Insert, Delete, Update and Batches.
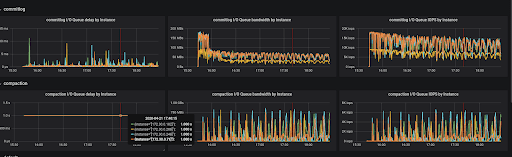
- CPU and IO Dashboard reorganization #857A reorganization of the CPU and the IO dashboards collect the relevant information in rows.
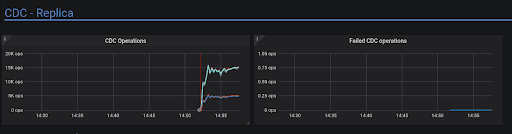
- Add CDC panels #819
CDC operations: The number of CDC operations per seconds. Based on scylla_cdc_operations_total
Failed CDC operations: The number of Failed CDC operations per seconds. Based on scylla_cdc_operations_failed
- Default Latency Alerts #803. You can read more about Alerts here.
Two new Latency alerts were added out of the box, one when the average latency is above 10ms and one when the 95% latency is above 100ms.
Latency is system specific, and it is best if you set the value to match your system and expected latency. - Start the monitoring with an Alternator option #858
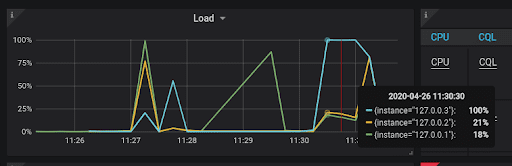
Alternator users can start the monitoring stack withalternator-start-all.shto show only the alternator related dashboards: alternator, CPU, IO, OS and Errors. - Graphs’ hover-tooltip sort order #861.
The hover-tooltip shows the current value of each of the graphs. It is now sorted according the the value/