
The ScyllaDB team is pleased to announce the release of ScyllaDB Monitoring Stack 3.1.
ScyllaDB Monitoring Stack is an open-source stack for monitoring ScyllaDB Enterprise and ScyllaDB Open Source, based on Prometheus and Grafana. ScyllaDB Monitoring Stack 3.1 supports:
- ScyllaDB Open Source versions 2.3, 3.0, 3.1 and the upcoming 3.2
- ScyllaDB Enterprise versions 2018.x and 2019.x
- ScyllaDB Manager 1.4.x and ScyllaDB Manager 2.0
Related Links
- Download ScyllaDB Monitoring 3.1
- ScyllaDB Monitoring Stack Docs
- Upgrade from ScyllaDB Monitoring 3.x to 3.y
New in ScyllaDB Monitoring Stack 3.1
- ScyllaDB Open Source Version 3.2 dashboards
- ScyllaDB Manager Version 2.0 dashboards.
- Grafana 6.5.1
More on Grafana release can be found here - Prometheus 2.14
More on Prometheus release can be found here - Add the ad hoc filter to all dashboards #773
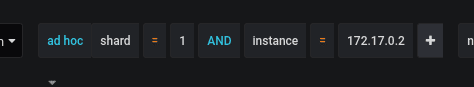
The ad hoc filter is a flexible filter that allows specifying multiple conditions. When used it will affect all graphs; you can choose from the ad hoc drop down the labels you would like to filter by with the condition.
Example: The following shows how to limit all graph to a specific shard and ip.
- Report-a-problem button #691
You can now report an issue with the monitoring by clicking a button on the top right corner of the dashboard. The relevant version and dashboard will be added to the newly opened ticket.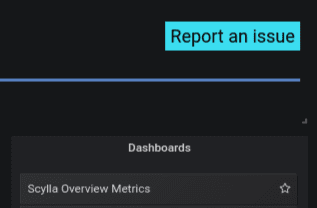
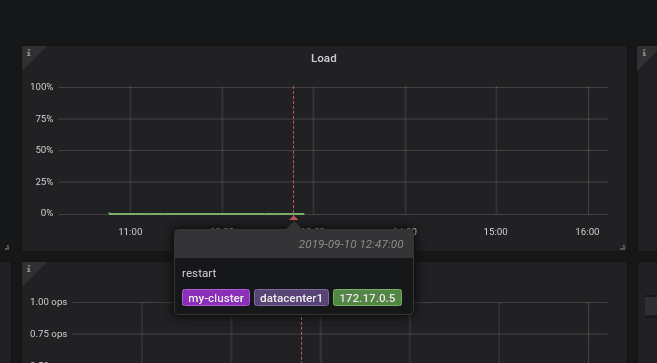
- Adding annotations for server restart #712
Annotations are marker lines that show an event occurrence. Annotations can be turned on and off from the top menu.
The following shows how the server restart annotation looks like.
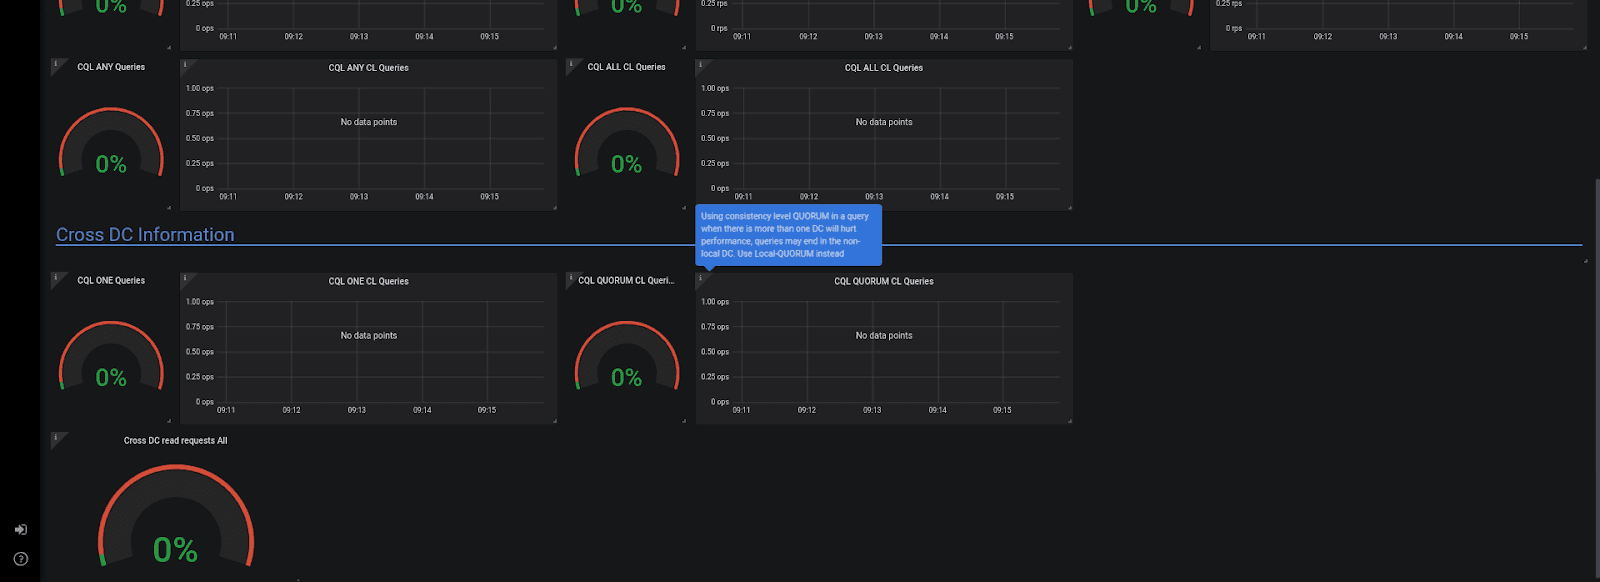
- CQL Optimization warning for potential hazard with Consistency Level #706 #579
You can read more about the CQL optimization here.
The new consistency level part helps identify potential hazards with the Consistency level.
Specifically: ANY and ALL should be avoided.
When running in multi DC, ONE and QUORUM should be avoided, use LOCAL_ONE or LOCAL_QUORUM instead.
- Experimental – ScyllaDB Manager Consul integration #470
ScyllaDB-Manager 2.0 has a Consul-like API that allows ScyllaDB Monitoring to get the cluster servers information directly from it.Users of ScyllaDB-Manager can set ScyllaDB Monitoring to read the cluster server configuration directly from ScyllaDB-Manager instead of manually set them from a file.You can read more about it in the configuration guide here.