We just released ScyllaDB Monitoring Stack version 2.3. The new version comes with dashboards to support the coming ScyllaDB Enterprise 2019.1 release and for the ScyllaDB Manager 1.4 release.
Making the ScyllaDB Monitoring Stack more robust
Templates
ScyllaDB Monitoring Stack 2.3 improves the way ScyllaDB Monitoring works with templates and makes some of the magic of dashboard generation more visible and explicit.
ScyllaDB Monitoring Stack uses Grafana for its front end dashboards. Grafana dashboards definitions are verbose and hard to maintain. To make dashboard maintenance easier we use a hierarchical template mechanism. You can read more about it the blog post here.
We use a python script to generate the dashboards from the template. This created a dependency on python for the solution to work.
As of ScyllaDB Monitoring Stack 2.3, the dashboards will be available pre-generated with the release. Which means, that by default, you no longer have a python dependency.
Making changes to the dashboards
If you are making changes to the dashboard, you will need to run generate-dashboards.sh for the changes to take effect. Note that generate-dashboards.sh will change the dashboards in place and that the grafana server will update the changes without a restart and does depend on python.
Docker and Permissions
Using Docker Containers is an easy way to install the different servers of the ScyllaDB Monitoring Stack. Containers bring a layer of isolation with the intent to provide additional security. In practice, many users run into issues when a process inside the container needs to access and modify files outside of the container. This happens with the Prometheus data directory, and now, with Grafana dashboards and plugins.
Many users when facing this problem tends to use some workaround to bypass the Linux security, examples are using root (running with sudo) changing directory permissions to all, and disabling SELinux.
All these workarounds are unadvised. We made multiple changes in the way we run the containers so it will not be necessary.
Best Practices for using ScyllaDB Monitoring Stack:
- Do not use root, use the same user for everything (e.g. centos)
- Add that user to the docker group (See here)
- Use the same user when downloading and extracting ScyllaDB Monitoring Stack
- If you did use
sudoin the past, it is preferential to change the directory and file ownership instead of granting excessive root permissions.
Controlling the alerts configuration files from the command line
It is now possible to override the Prometheus alert file and the alertmanager configuration files from the command line.
The Prometheus alert file, describe what alerts will be triggered and when. To specify the Prometheus alert file use the -R command line with start-alls.h
For example: ./start-all.sh -R promtheus.rules.yml
The Alertmanager configuration describes how to handle alerts. To specify the alert manager config file use the -r command line operator with start-all.sh
For example: ./start-all.sh -r rules.yml
As of ScyllaDB Monitoring Stack 2.3 all directory and files can be passed either as a relative path or as an absolute path.
Generating Prometheus configuration with genconfig.py
genconfig.py is a utility that can generate the scylla_sever files for Prometheus. In ScyllaDB Monitoring Stack 2.3 there are multiple enhancement to it.
- It now supports dc and cluster name.
- You can use the output from
nodetool statusas input, this will make sure that your datacenters are configured correctly. - It no longer creates the node_exporter file that was deprecated.
New panels to existing dashboards
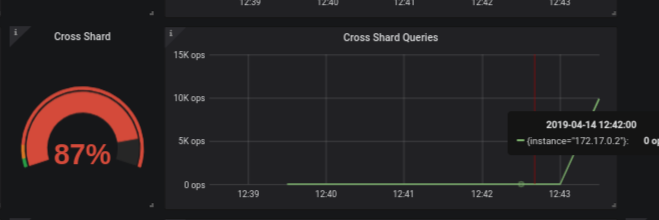
CQL Optimization: Cross shard
ScyllaDB uses a shared-nothing model that shards all requests onto individual cores. ScyllaDB runs one application thread-per-core, and depends on explicit message passing, not shared memory between threads. This design avoids slow, unscalable lock primitives and cache bounces.
Ideally, each request to a ScyllaDB node reaches the right core (shard), avoiding internal communication between cores. This is not always the case, for example, when using a non-shard-aware ScyllaDB driver (see more here)
New panels in the cql optimization dashboard were added to help identify cross-shard traffic.
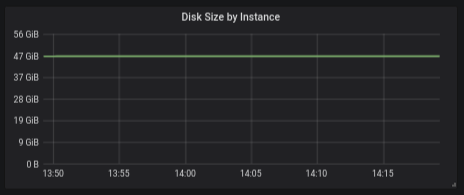
Per-machine Dashboard: Disk Usage Over time
Answering user request to show the disk usage as a graph over time, the disk size panel shows the aggregation disk usage (by instance, dc or cluster)
Conclusion
Now you’ve seen the changes that were made in ScyllaDB Monitoring Stack 2.3 to make it easier to run and more secure. The next step is yours! Download ScyllaDB Monitoring Stack 2.3 directly from Github. It’s free and open source. If you try it, we’d love to hear your feedback, either by contacting us privately or sharing your experience with your fellow users on our Slack channel.