

Grafana Loki is Grafana’s tool for log aggregation and reporting. Loki 2.0 was just released with many enhancements so I took it for a spin. One of the nice things with the new release is the ability to create custom alerts.
In this blog-post I will cover the following topics:
- using Loki with rsyslog
- configuration from a file
- alert generation
- logs transformation while querying (it’s great, so wait for it!)
In my testing, I used ScyllaDB on AWS, but it’s applicable to any other system.
Introduction
I assume that you already know about Grafana (if not, get started here). If you are using Grafana on top of Prometheus where the latter serves as the metrics server, you should know that Prometheus can generate alerts. Although Grafana can read those alerts directly from Prometheus, it’s best to use the Alertmanager between them. In those setups, Prometheus sends alerts to the Alertmanager that acts as a data source for Grafana.
The nice thing about this setup is that Alertmanager can do more things with alerts like sending emails or Slack messages.
Loki is a log aggregation tool that is part of Grafana’s ecosystem with a query language similar to Prometheus. Loki can serve as a data source for Grafana, so you can look at logs inside a dashboard. With the 2.0 release Loki can also act as an alert source. This means that you can generate alerts like you would do in Prometheus: point those alerts to your Alertmanager and you would get, for free, the same notifications and representation your Prometheus alerts have.
The benefit of sending the alerts directly from Loki is that it is possible to get some extra information while doing so, and I will show that below.
Setup
We are going to have two servers: one for the monitoring and for the reporting. However, typically there will be many reporting servers and one single monitoring server.
In my tests, I used an image of ScyllaDB, a high performance NoSQL database, running on an AWS instance. This allows me to gather a lot of useful monitoring information.
For clarity, I will address the two servers that I’ve outlined earlier as Monitoring for the monitoring stack and the ScyllaDB instance as the reporting server.
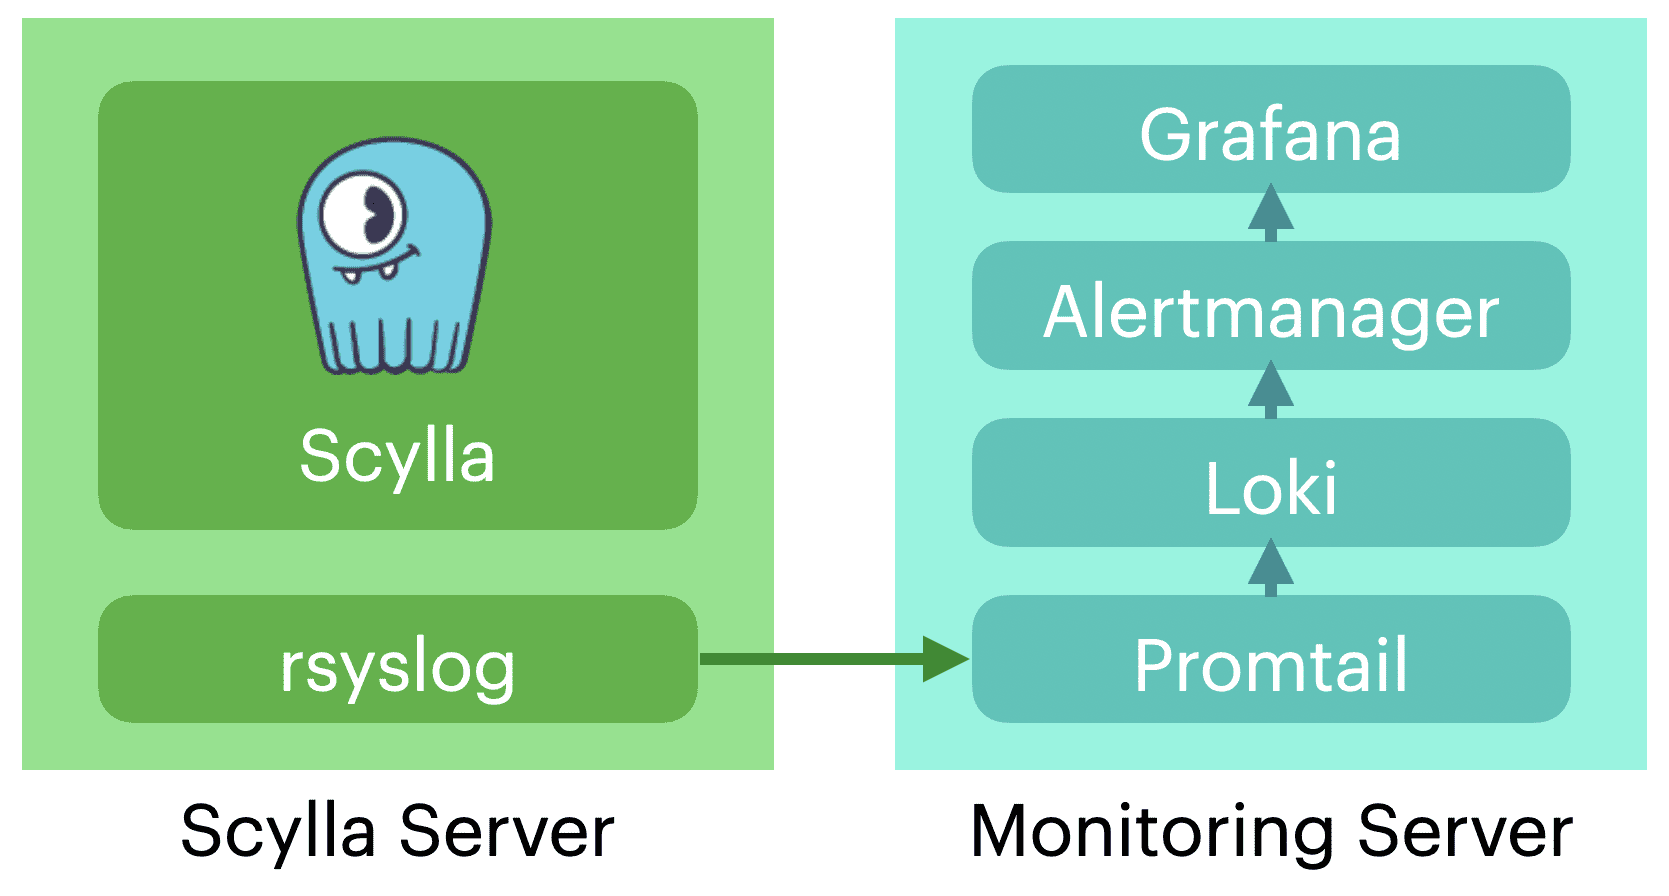
Loki, Promtail and rsyslog
rsyslog is a popular log collection and distribution system, rsyslog can send your system logs both locally and to multiple log server destinations. In this case, I have it running on the ScyllaDB reporting server.
Loki uses promtail as its agent to collect logs. While promtail can run on each of the reporting machines and collect logs information, it can also be configured to receive logs data using the Loki Push API or it can be set up as a syslog target. In these cases, you have one promtail process running on the same server as Loki.
In our case, we will use the setup outlined above, so we don’t have to install additional agents on the reporting servers.
rsyslog configuration
rsyslog pushes the logs to the monitoring target, assuming the IP address of the monitoring system is 10.99.0.1.
Let’s login to the reporting server, to make sure that rsyslog is installed and up and running:
$ systemctl status rsyslog
In case if it is not, go ahead and install it and also make sure that it’s running correctly.
First, edit /etc/rsyslog.conf and add the following line at the end of the file:
if $programname == 'scylla' then @@10.99.0.1:1514;RSYSLOG_SyslogProtocol23Format
Note, the line above is an advanced example that only sends logs generated by Syclla. In case if you want to send everything to your log server, you can use following:
@@10.99.0.1:1514;RSYSLOG_SyslogProtocol23Format
Now, let’s restart the rsyslog daemon:
$ sudo systemctl restart rsyslog
We’re done here.
Configuring the Monitoring stack
On the monitoring server, we are going to run Grafana, Alertmanager, Loki, and promtail services and we are going to use Docker containers for sake of simplicity.
I assume the docker service is already running on your server and that you already have Grafana and Alertmanager up and running with Grafana configured to read data directly from the Alertmanager.
As an example, you can look at the ScyllaDB Monitoring Stack GitHub repository that’s already configured to run such a monitoring stack. (New to ScyllaDB Monitoring Stack? Learn more in our free ScyllaDB University course here.)
Running loki and promtail
As the next step, we are going to configure our services to read the configuration and the alerts from log files. You can read more about installing those using Docker here.
On top of that configuration, you should do the following:
Loki rule files
Before you start, execute the following command:
$ mkdir -p loki-rules/fake/
This command will create a directory where the rules files will be stored.
Here’s an example of a rule file:
$ cat loki-rules/fake/loki-rule.yaml
groups:
  - name: example
    rules:
    - alert: HighThroughputLogStreams
      expr: sum by (instance, msg) (count_over_time({module="large_data"} |regexp`(?P.*)` [1h])>0)
      for: 20s
      labels:
        severity: "2"
      annotations:
        description: '{{ $labels.instance }} {{ $labels.msg }}
memory.
Now you should create a file in that directory by following the example above.
We’ll go back to this file later.
Next, run the Loki container by executing the following commands:
$ docker run -d -v $(pwd)/loki-conf:/mnt/config -v $(pwd)/loki-rules:/etc/loki/rules -p 3100:3100 --name loki grafana/loki -config.file=/mnt/config/loki-config.yaml
That would start a container named loki.
You can check status of the container with the following command:
$ docker logs loki
Check and see if there are no errors.
Find out what the IP address this container is using:
$ docker inspect -f '{{range .NetworkSettings.Networks}}{{.IPAddress}}{{end}}' loki
172.17.0.5
From the command above we are determined that the IP address is 172.17.0.5.
Now, let’s edit the promtail config file to reflect that information. Here is an example file:
$ cat promtail_config.yml
server:
  http_listen_port: 9080
  grpc_listen_port: 0

positions:
  filename: /tmp/positions.yaml

clients:
  - url: http://172.17.0.5:3100/loki/api/v1/push

scrape_configs:
  - job_name: syslog
    syslog:
      listen_address: 0.0.0.0:1514
      labels:
        job: "syslog"
    relabel_configs:
      - source_labels: ['__syslog_connection_ip_address']
        target_label: 'instance'
      - source_labels: ['__syslog_message_app_name']
        target_label: 'app'
      - source_labels: ['__syslog_message_severity']
        target_label: 'severity'

    pipeline_stages:
      - match:
          selector: '{app="scylla"}'
          stages:
            - regex:
                expression: "\\[shard (?P\\d+)\\] (?P\\S+).*"
            - labels:
                shard:
                module:
      - match:
          selector: '{severity="warning"}'
          stages:
            - metrics:
                warning_total:
                  type: Counter
                  description: "total count of warnings"
                  prefix: scylla_logs_
                  config:
                    match_all: true
                    action: inc
What you’ve learned so far from the sample file above is:
- We are configuring the syslog job, here we open the port for incoming rsyslog traffic. See also how we extract the labels from the message. We’ll come back to it at the end.
- The regular expression that we are using to match and create a shard and module labels. Those shard and module labels are something that every ScyllaDB log has and they will be useful for indexing purposes.
- The last match creates a metric, this used to be the way to get alerts from Loki, I’ll leave it here as a reference, but we are not going to use it.
Now, let’s start promtail:
$ docker run -d -p 9080:9080 -v $PWD/promtail_config.yml:/etc/promtail/config.yml --name=promtail grafana/promtail:2.0.0 --config.file=/etc/promtail/config.yml
You can now login to http://{IP}:9080/targets and you should see alerts coming from your server. Note that this example is ScyllaDB specific and you will need to make appropriate changes for any other services, I suggest that you start with minimal filtering so you will start with actual logs and will be able to add more filtering later.
If all works as planned, switch to your Grafana dashboard. There you can see the Loki metrics by adding a loki data-source (remember to use the Loki container IP) and use the explore option from the menu.
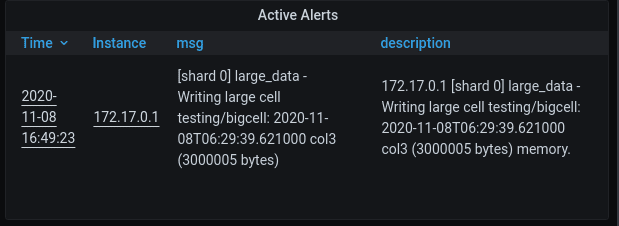
But, let’s talk about alerts. In the following example, I have created an alert in ScyllaDB (without going into the details, I enter a large cell to a table, which is something that needs to be avoided).
In my Grafana dashboard, I already have an alert table and we can see that the alert is there. Note that in this example I didn’t change anything in the Grafana configuration and in fact, Loki is not a data source here.
Explaining the alert rule
Minimal cardinality and labels
In Loki 2.0 there are two kinds of labels, the first are labels that are created when the logs get collected. Those labels are used for indexing and expect to have a low cardinality.
If you are not familiar with the notion of low-cardinality, it’s a fancy way of saying that a parameter can have relatively few possible values, which implies that if you cut your data by that specific value you will get a big chunk of the data.
Loki suggests that you only use labels for low-cardinality values.
If you have experienced Prometheus/Alertmanager alerts in the past, you know that the information you receive is passed by labels. In our trace line, we have very specific information, it states the keyspace, table, and column of the big cell that causes the problem, for cases like this, there are query-time labels. Those are labels that are collected when the log lines are being queried and can be used in the expression and in the alert.
Creating labels at query time
Look back at loki-rules/fake/loki-rule.yaml.
You can see that we use the |regexp to create name labels from the log line. In our example, we simply copy the entire line into a msg label. You can see the result in our alert table, see both the msg label and the description.
Take away
- When creating a label, postpone high-cardinality labels for the query time and in general, fewer labels are better.
- Files location, if you read your rules from files locate them inside a name directory (in my example it’s called
fake/) and map the directory that holds that (in my caseloki-rules/) to the directory in your Loki configuration. - You can use promtail as an rsyslog server when you point your rsyslog on each of the Monitored servers to it.
- You can create alerts directly on Loki and point them to your Alertmanager.
Already using Loki? Inspired to try it now? Let us know!
We believe Loki will be of great use across the cloud computing community far beyond ScyllaDB, a real-time big data database. Though if you are using Loki with ScyllaDB, or are now inspired to try it out, we’d love to hear. Feel free to contact us, or drop in and let the community know in our Slack channel.