
Update: Tomek provided a deep dive into how the ScyllaDB cache works in the 2023 webinar, Replacing Your Cache with ScyllaDB
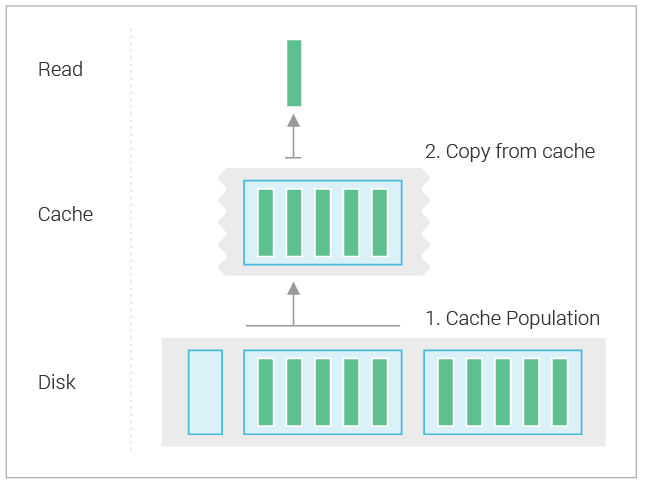
ScyllaDB persists data on disk. Writes to ScyllaDB are initially accumulated in RAM in memtables, which at some point get flushed to an sstable on disk and removed from RAM. This means that reads need to look into both active memtables and sstables for relevant information. Access to data on disk is slower than to RAM, so we use caching to speed up access to data on disk.
The cache is a read-through data source that represents data stored in all sstables on disk. This data may not fit in RAM, so the cache is capable of storing only a subset of it in memory.
The cache populates itself from disk during reads, if necessary, expanding into all available memory. It evicts the least recently used data when room must be made for current memory requests.
The diagram below illustrates the composition of data sources:
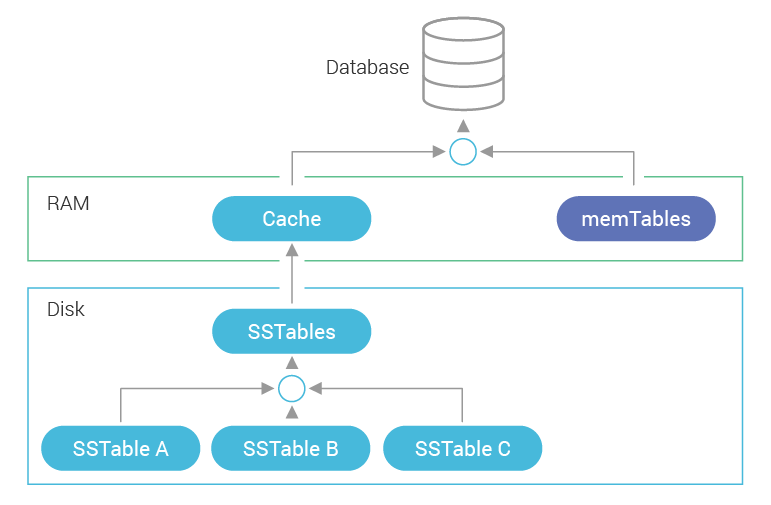
Note that RAM may additionally contain other ScyllaDB-related data.
Cache Granularity in ScyllaDB 1.7
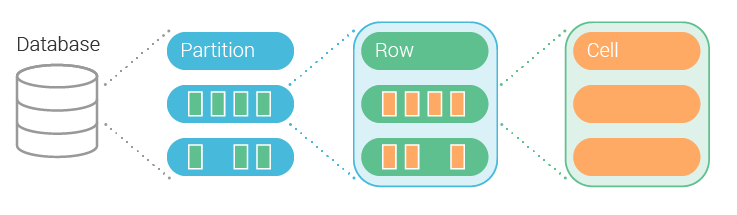
Let’s start with a reminder of the structure of data in ScyllaDB:
- At the highest level, we have partitions, identified by a partition key
- Partitions contain rows, identified by a clustering key
- Rows contain cells, identified by column names
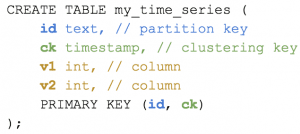
Below you can find an example of a table schema in CQL and how its columns map to different elements:
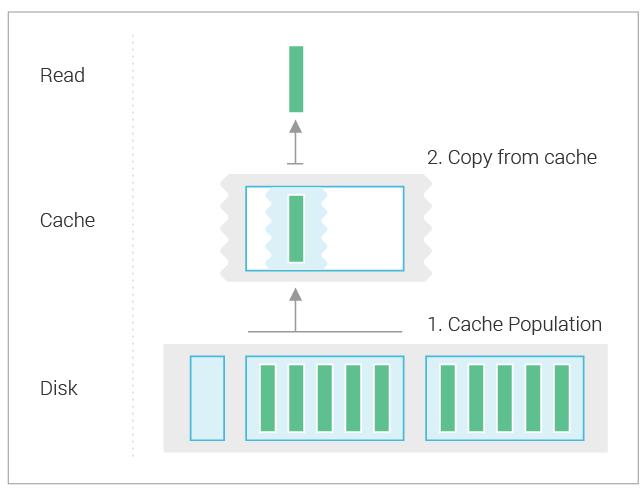
Before ScyllaDB 2.0, the cache was optimized for small partitions and any given partition was either cached completely or not at all. In other words, the cache had a granularity of a partition for both population and eviction.
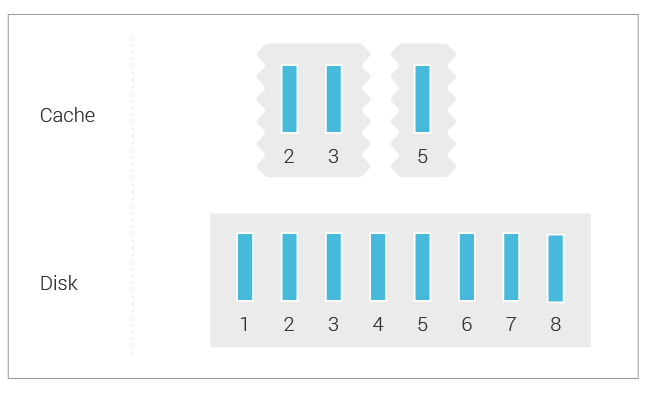
However, this doesn’t work well for partitions with many rows. Reads that query only a subset of rows will have to read the whole partition from disk if it’s absent in the cache in order for the data to get into the cache. This may result in significant read amplification as partitions are getting larger, which directly translates to higher read latency. The diagram below depicts the situation:
In the example above, the read selects only a single row from a partition with 5 rows, but it will need to read the whole partition from disk to populate the cache.
Full partition population may also pollute the cache with cold rows, which are not likely to be needed soon. They take up space that could otherwise be used for hot rows. This reduces the effectiveness of caching.
Having partition granularity of eviction also caused problems with large partitions. Evicting large amounts of data at once from memory will make the CPU unavailable for other tasks for a while, which adds latency to operations pending on that shard.
As a temporary measure to avoid those problems, our ScyllaDB 1.7 release introduced a limit for the size of the partition that is cached (10 MiB by default, controlled by the max_cached_partition_size_in_bytes config option). When a populating read detects that the partition is larger than this, the population is abandoned and the partition key is marked as too large to cache. This read and subsequent ones will go directly to sstables, reading only a slice of data determined by sstable index granularity. This effectively disabled the cache for large partitions.
Row-granularity Population
In ScyllaDB 2.0, the cache switched to row granularity for population. It could now cache a subset of a partition, which solves the problem of read amplification for partitions with many rows.
The cache doesn’t simply record information about the presence of rows that are cached, it also records information about which ranges of rows are fully populated in the cache. This is especially important for multi-row range queries, which would otherwise never be sure if the cache holds all of the relevant rows, and would have to go to disk. For example, consider a query that selects the first N rows from a given partition in the following situation:
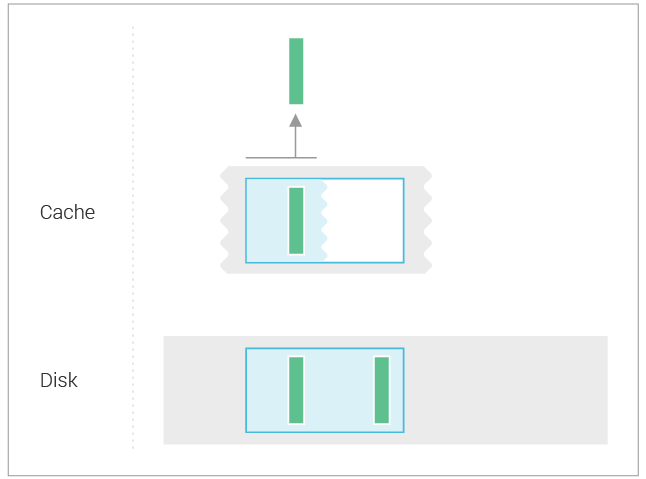
The cache records the information that the sstables don’t contain any rows before the one that is in cache, so the read doesn’t need to go to sstables.
In ScyllaDB 2.0 and 2.1, the cache still has the problem of eviction granularity being at the partition level. When ScyllaDB evicts a large partition, all of it has to go away. There are two issues with that:
- It stalls the CPU for a duration roughly proportional to the size of the partition, causing latency spikes.
- It will require subsequent reads to repopulate the partition, which slows them down.
Row-granularity Eviction
ScyllaDB 2.2 switches eviction to row granularity, solving the problems mentioned earlier. The cache is capable of freeing individual rows to satisfy memory reclamation requests:

Rows are freed starting from the least recently used ones, with insertion counting as a use. For example, a time-series workload, which inserts new rows in the front of a partition, will cause eviction from the back of the partition. More recent data in the front of the partition will be kept in cache:

Row-granularity Merging of In-memory Partition Versions
ScyllaDB 2.4 will come with yet another latency improvement related to the merging of in-memory versions of partition data.
ScyllaDB aims to provide partition-level write isolation, which means that reads must not see only parts of a write made to a given partition, but either all or nothing. To support this, the cache and memtables use MVCC internally. Multiple versions of partition data, each holding incremental writes, may exist in memory and later get merged. That merging used to be performed as an indivisible task, which blocks the CPU for its duration. If the versions to be merged are large, this will noticeably stall other tasks, which in turn impacts the perceived request latency.
One case in which we may get large versions is when a memtable is moved to cache after it’s flushed to disk. Data in a memtable for a given partition will become a new partition version on top of what’s in cache. If there are just a few partitions written to, that can easily generate large versions on a memtable flush. This is tracked under the following GitHub issue: https://github.com/scylladb/scylla/issues/2578.
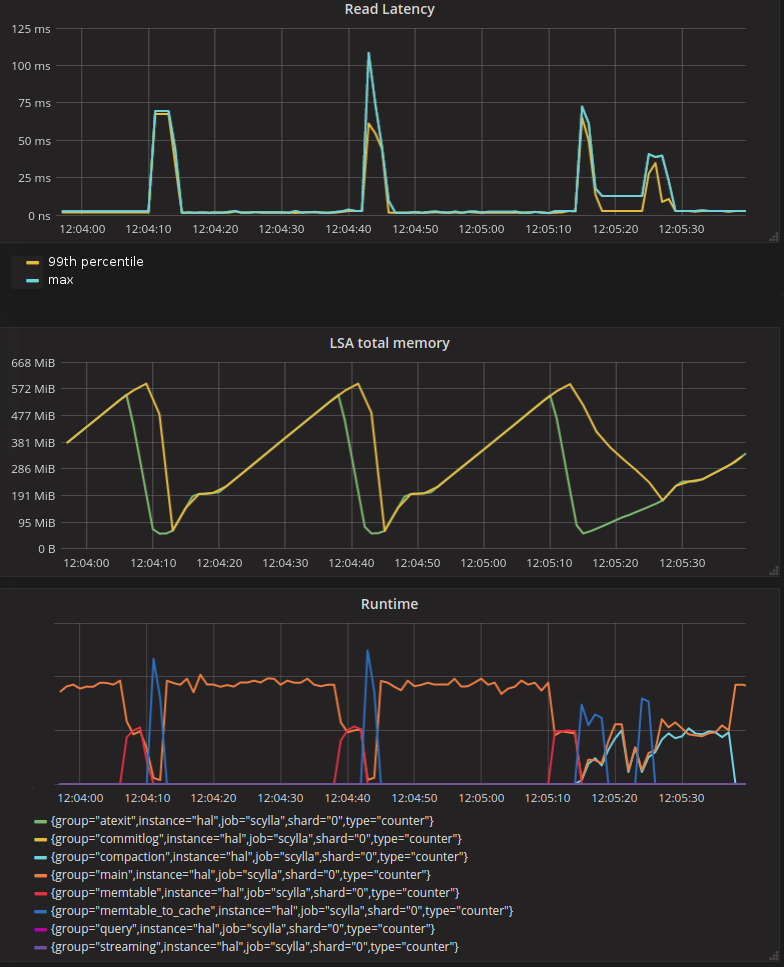
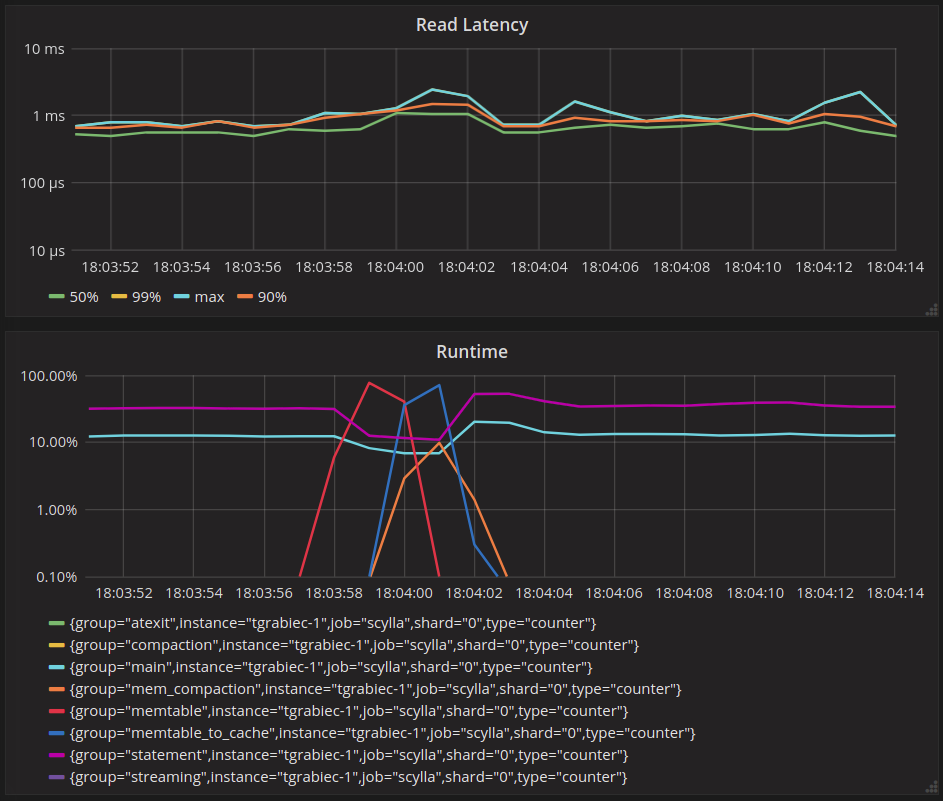
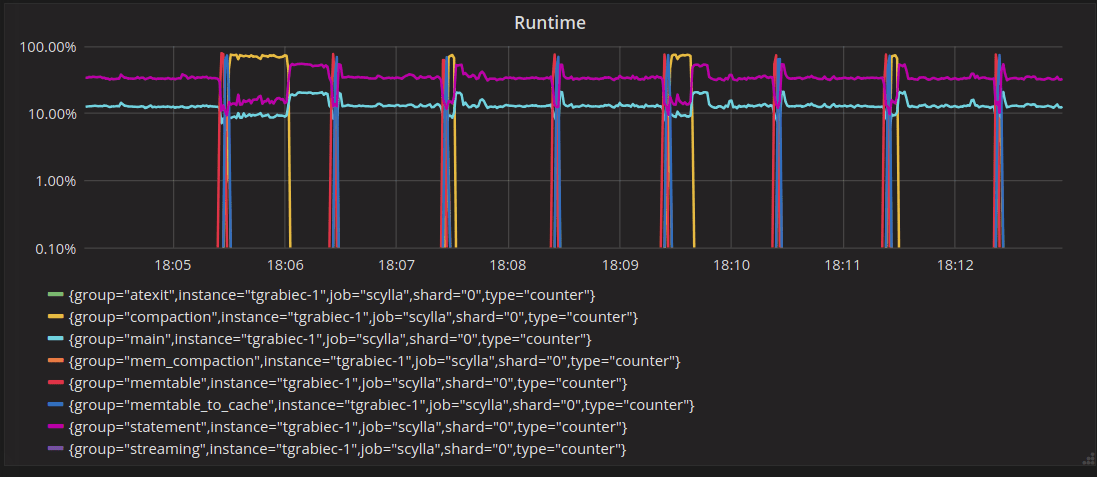
The graph below illustrates this effect. It was taken for a workload that appends rows to just a few partitions, hence there are few, but large, partitions in memtables. You can see that after a memtable is flushed (“memtable” group on the “Runtime” graph rises), the “memtable_to_cache” group on the “Runtime” graph rises, which correlates directly with latency spikes on the “Read latency” graph.
In ScyllaDB 2.4, this is solved by making partition version merging preemptable. It hooks up into the general preemption mechanism in the Seastar framework, which periodically sets the preemption flag every 500 microseconds (aka, task quota) by default, which allows currently running operations to yield. Partition version merging will check this flag after processing each row and will yield when raised. This way, the impact on latency is limited to the duration of task quota.
Below is a graph showing a similar workload on ee61660b (scheduled for release in 2.4). You can see that the impact of a memtable flush on read latency is no longer significant:
Test Results: ScyllaDB 1.7 vs Master (pre-2.4)
Here’s an experiment that illustrates the improvements using a time-series like workload:
- There are 10 clients concurrently prepending rows to 10 partitions, each client into a different partition. The ingestion rate is about 20k rows/s
- There is one client that is querying for the head of one of the partitions with limit 1 and at a frequency of 10 reads per second
The purpose of the test is to see how the latency of reads looks when partitions grow too large to fit in cache and are therefore evicted.
I used a modified1 scylla-bench for load generation, with the following command lines:
./scylla-bench -workload timeseries -mode write -concurrency 10 -partition-count 10 -clustering-row-count 1000000000 -max-rate 20000./scylla-bench -workload sequential -mode read -concurrency 1 -partition-count 1 -no-lower-bound -max-rate 10
The ScyllaDB servers are started with one shard and 4 GiB of memory.
I compared ScyllaDB 1.7.5 with the master branch commit ee61660b76 (scheduled for release after 2.3).
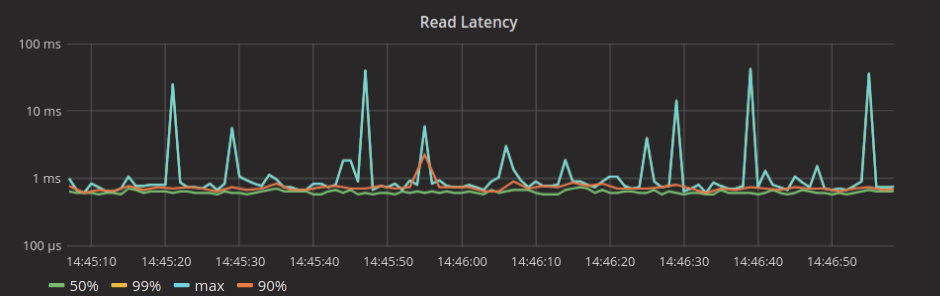
Behavior on ScyllaDB 1.7.5
The graphs below show the time frame around the event of the cache getting forcefully invalidated using RESTful API2 during the test.
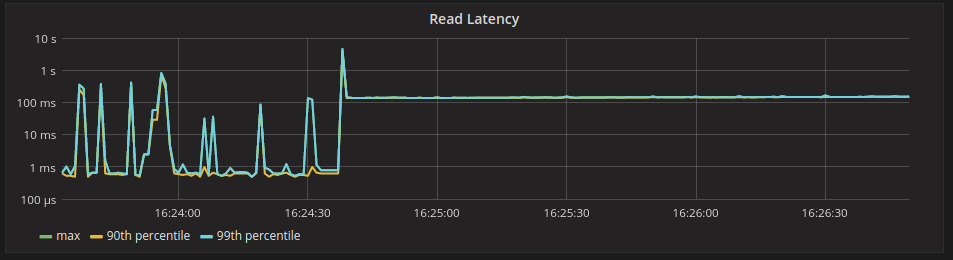
We can see that reads start to miss in the cache but do not populate it. See how “Cache Used Bytes” stays flat. We can see that reads start to hit the large partition markers, which is shown on the “reads from uncached large partitions” graph. This means reads will go directly to sstables. The latency of reads jumps to above 100ms after eviction because each read now has to read from sstables on disk.
We can also see periodic latency spikes before the cache gets evicted. Those are coming from cache updates after a memtable flush. This effect was described earlier in the section titled “Row-granularity merging of in-memory partition versions.”
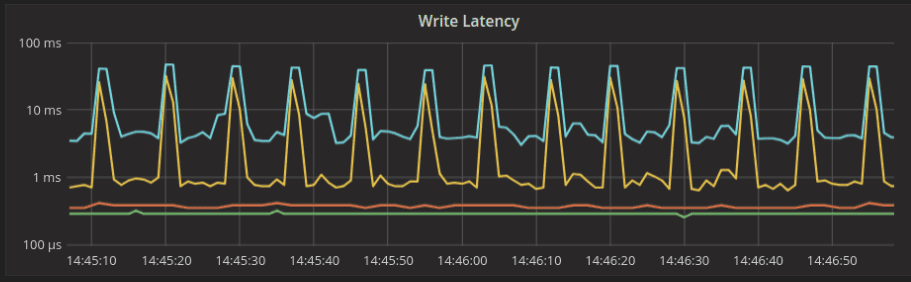
Behavior on the Master Branch
On the graphs below, you can see the time frame around the event of the cache getting forcefully invalidated using RESTful API3 at 18:18:07:
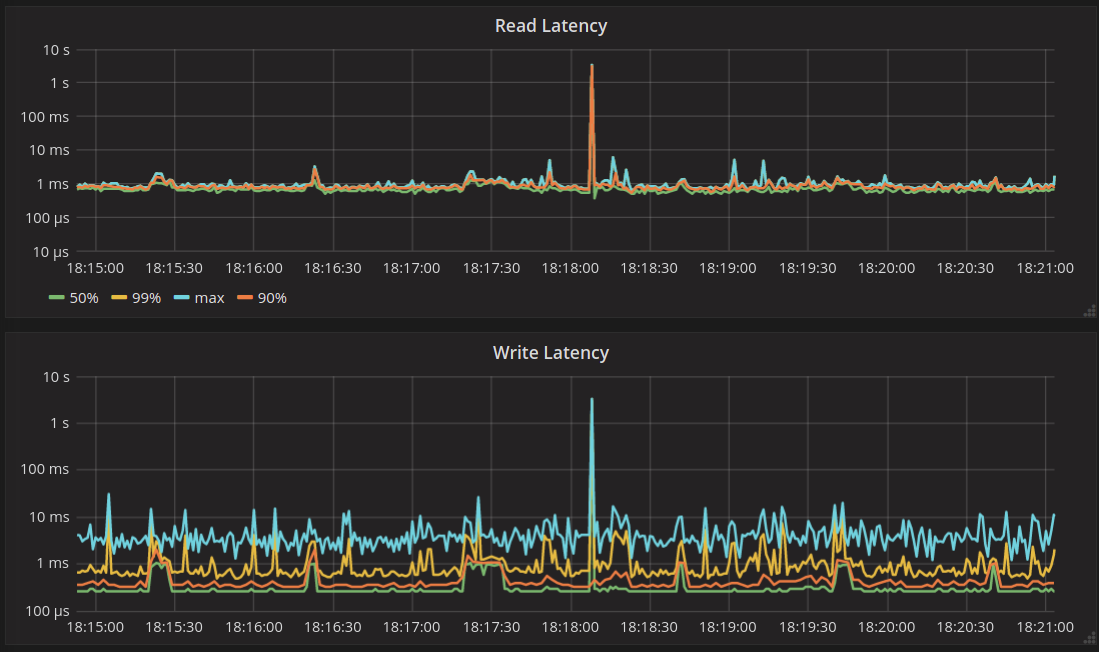
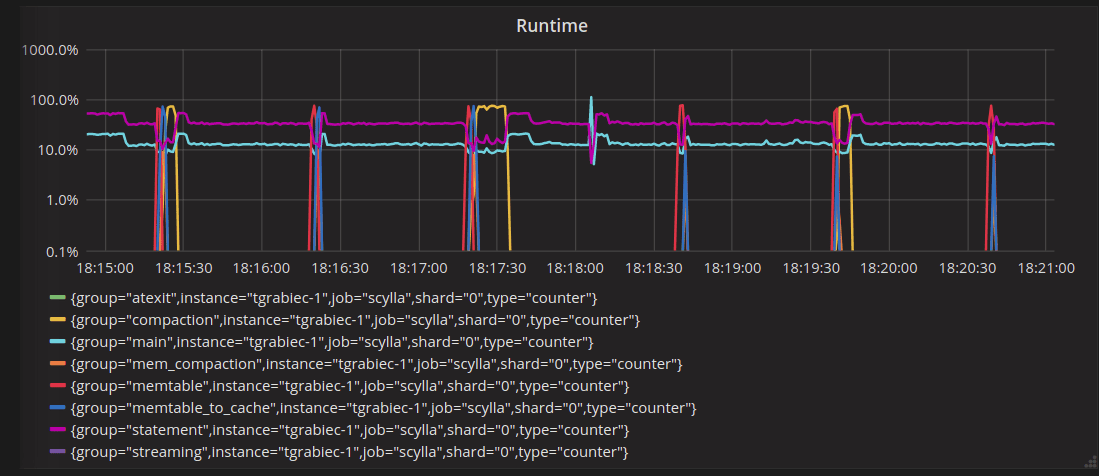
The first thing to notice is the latency spike caused by forceful cache invalidation. This is an artifact of cache invalidation via RESTful API, which is done without yielding. Normal eviction doesn’t cause such spikes, as we will show later.
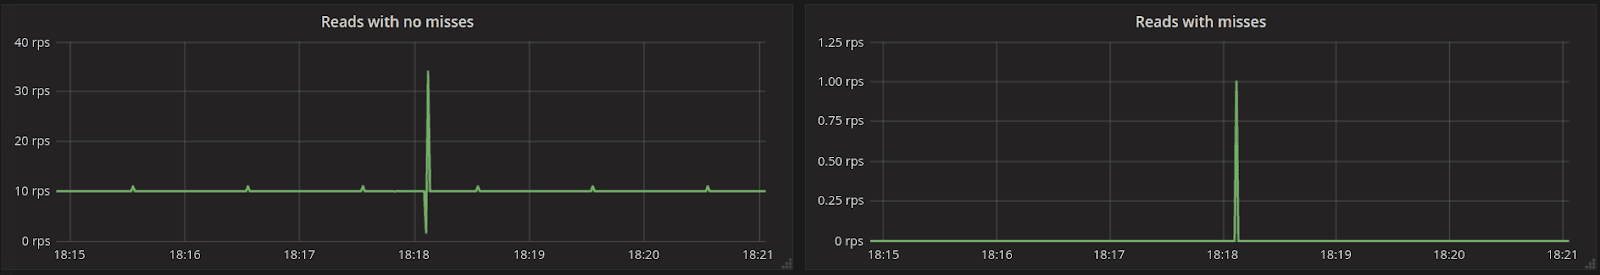
Other than that, we can observe that read latency is the same before and after the event of eviction. There is one read that misses in cache after eviction, which you can tell from the graph titled “Reads with misses.” This read will populate the cache with the head of the partition, and later reads that query that range will not miss.
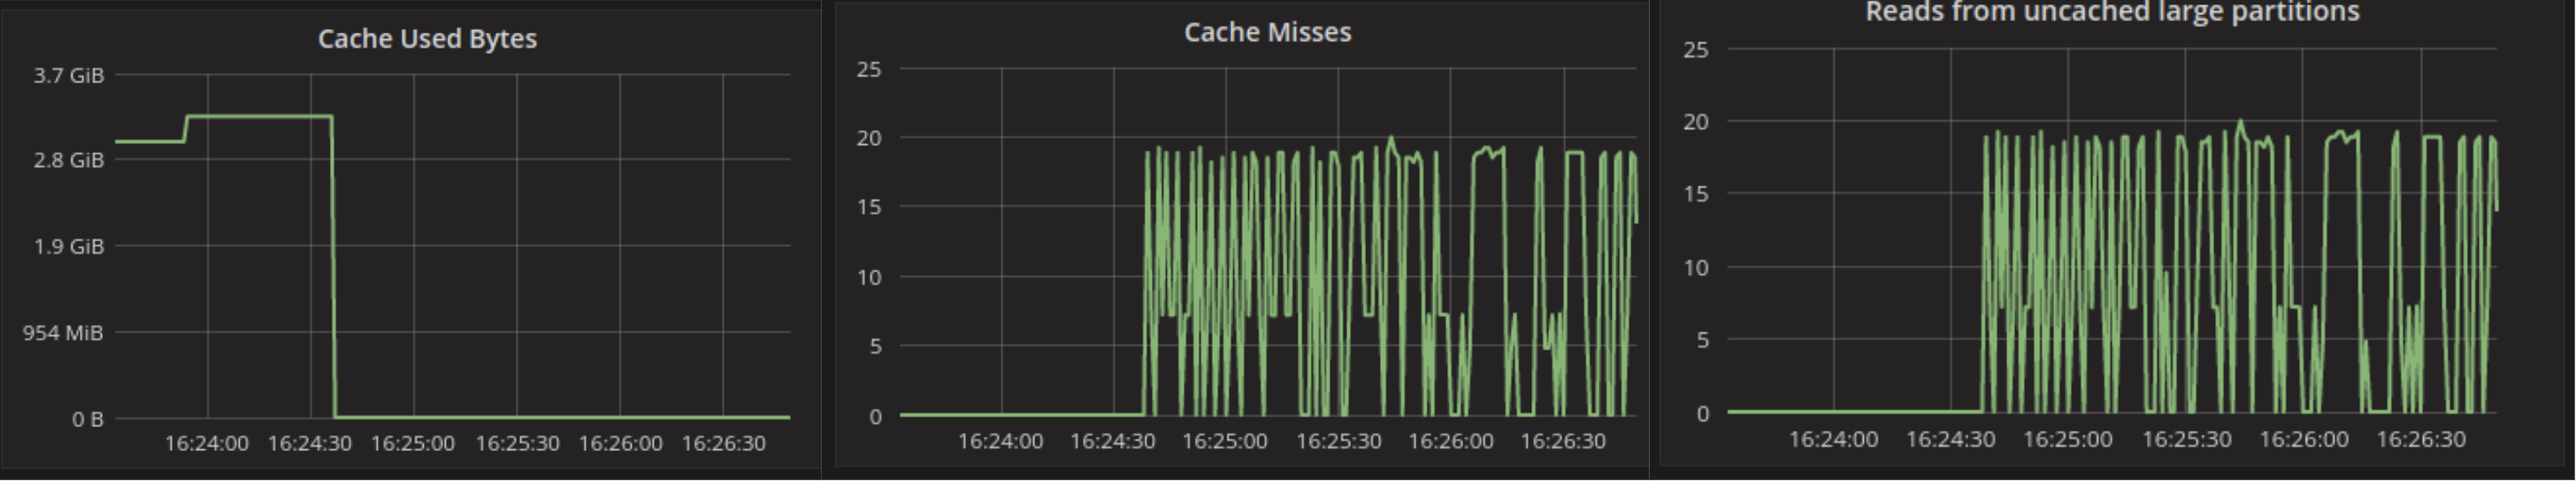
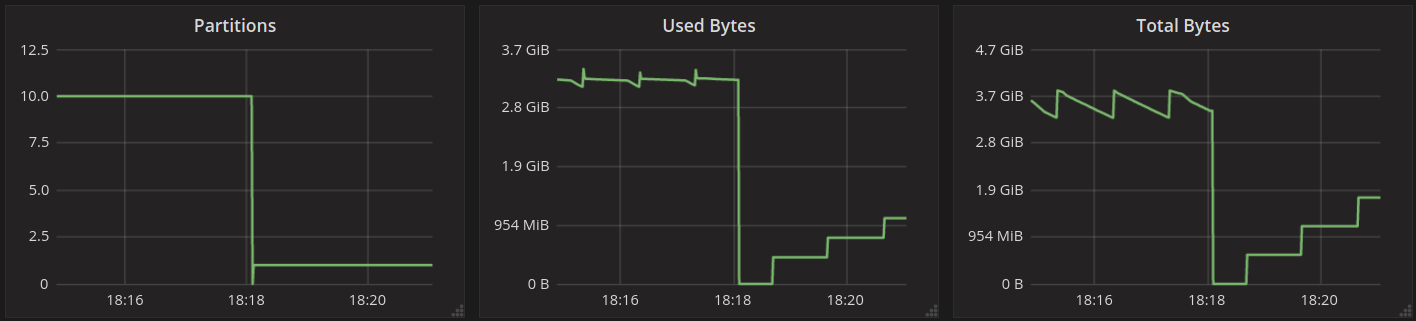
You can see on the graphs titled “Partitions” and “Used Bytes” that the cache dropped all data, but after that, the cache gets populated on memtable flushes. This is possible because the range into which incoming writes fall is marked in cache as complete. The writes are to the head of the partition, before any existing row, and that range was marked as complete by the first read that populated it.
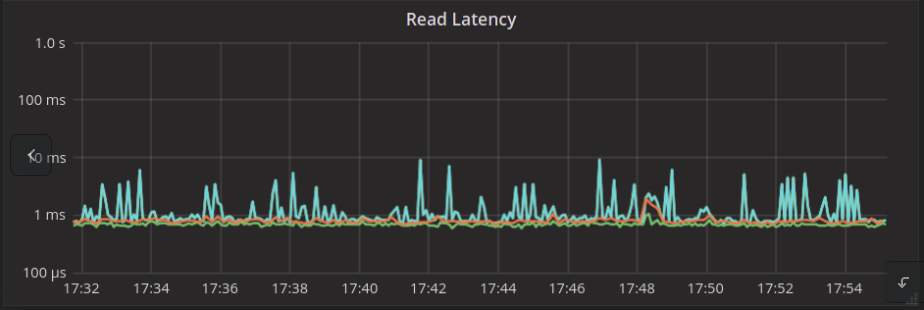
Another interesting event to look at is the time frame around the cache filling up all of the shard’s RAM. This is when the internal cache eviction kicks in:
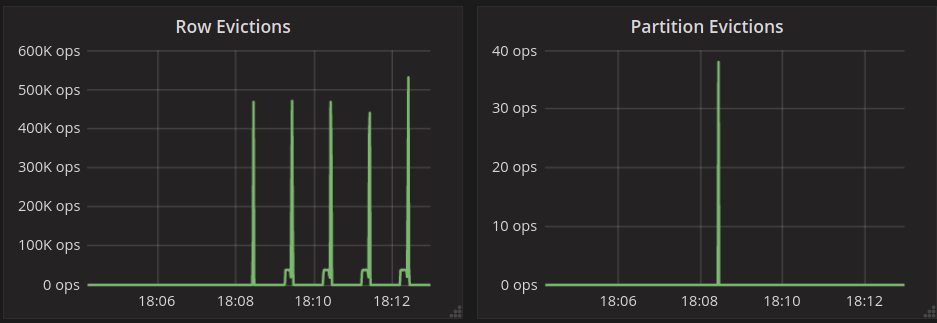
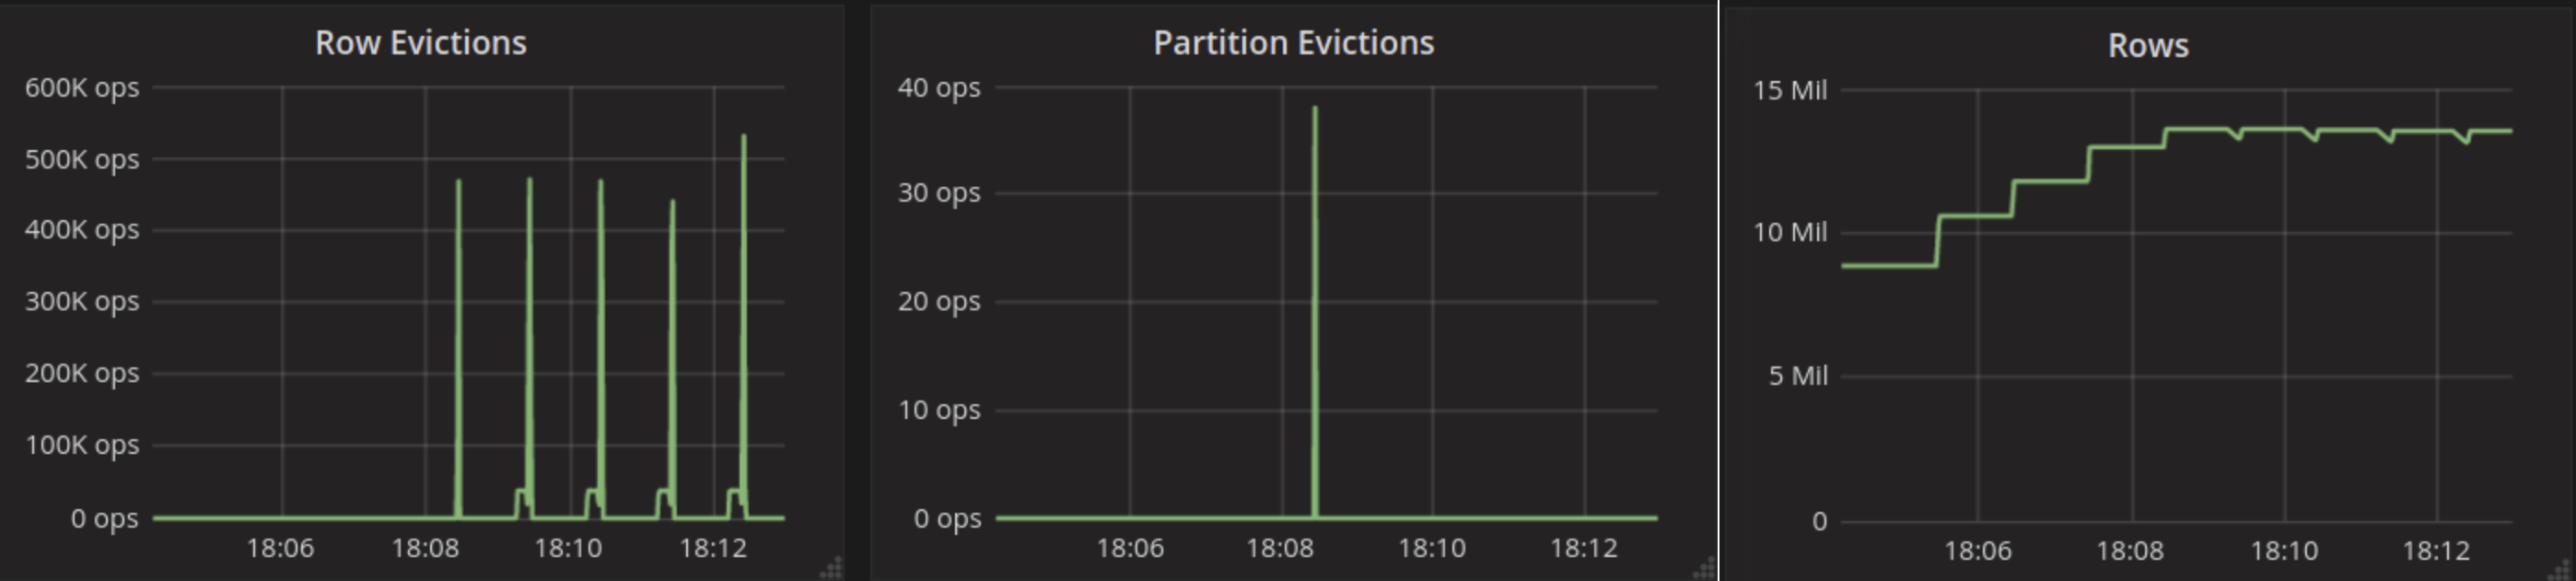
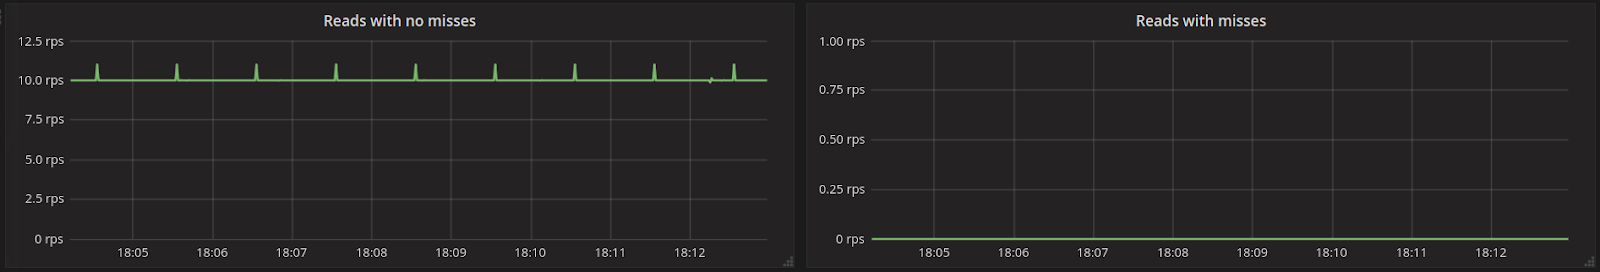
Eviction happens when the cache saturates memory at about 18:08:27 on those graphs. This is where the spike of “Partition Evictions” happens and where unused system tables get evicted first. Then we have only spikes of “Row evictions” because eviction happens from large partitions populated by the test. Those are not evicted fully, hence no “Partition Evictions.” Because eviction happens starting from least recently used rows, reads will keep hitting in the cache, which is what you can see on the “Reads with misses” graph, which stays flat at 0.
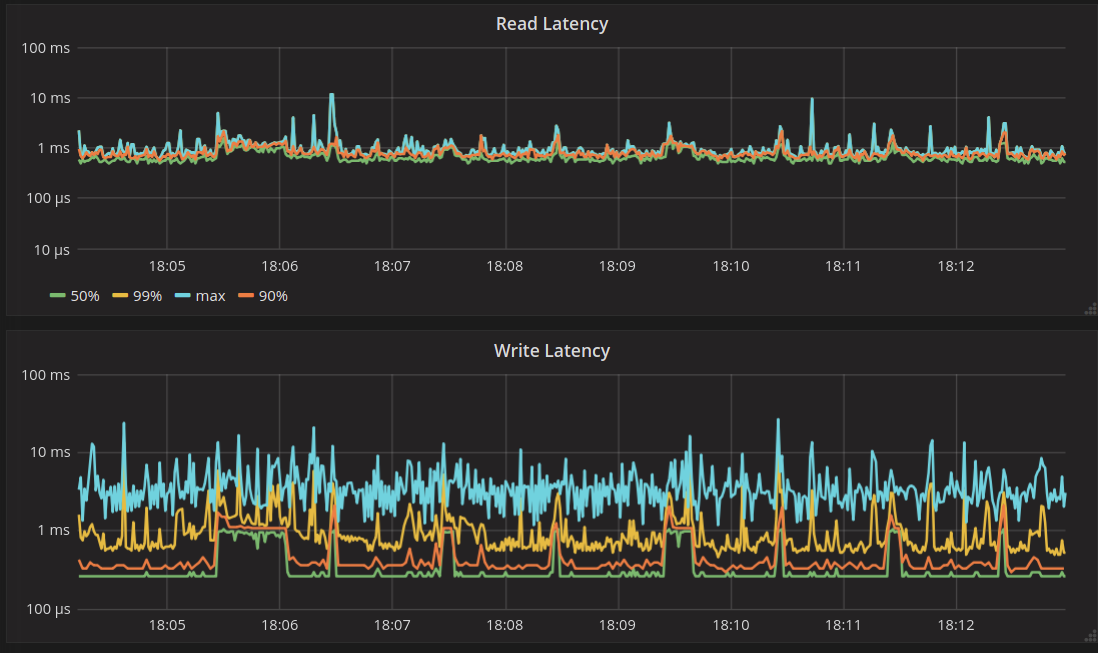
We can also see that there are no extraordinary spikes of read/write latency related to eviction.
Test Results: ScyllaDB Master (pre-2.4) vs Cassandra
We ran the same workload on GCE to compare the performance of ScyllaDB against Cassandra.
A single-node cluster was running on n1-standard-32 and the loaders were running on n1-standard-4. Both ScyllaDB and Cassandra were using default configurations.
Below you can find latency graphs during the test for both servers.
Cassandra 3.11.2:
ScyllaDB Master:
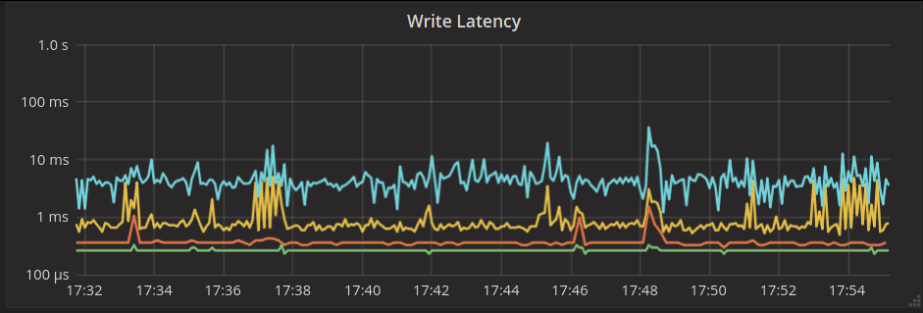
As you can see, these latency tests show noticeable differences for the cacheable workload that benefits from Cassandra’s usage of the Linux page cache. We will conduct a full time series comparison later on.
Next Steps
- ScyllaDB Summit 2018 is around the corner. Register now!
- Learn more about ScyllaDB from our product page.
- See what our users are saying about ScyllaDB.
- Download ScyllaDB. Check out our download page to run ScyllaDB on AWS, install it locally in a Virtual Machine, or run it in Docker.
1: The modifications are about making sure the “timeseries” write workload and “sequential” read workload use the same set of partition keys
2: curl -X POST http://localhost:10000/lsa/compact
3: curl -X POST http://localhost:10000/lsa/compact