Cassandra Latency FAQs
What is Cassandra Latency?
Cassandra latency is a comprehensive metric that reflects the time multiple operations within the database system require to process a request. Cassandra latency issues can stem from reads and writes, as well as other issues.
Network latency. Communication between applications and nodes, as well as inter-node communication within the cluster, contributes to overall latency. Factors such as network congestion and packet loss can impact latency.
Query complexity. Queries involving large data sets, complex filtering, or aggregations may take longer to process, causing Cassandra high latency.
Hardware and configuration. The performance characteristics of the hardware infrastructure hosting the Cassandra cluster, such as CPU, memory, and disk speed, as well as the configuration settings of Cassandra itself, including tuning parameters and resource allocation, all impact latency. Inadequate scale can lead to long garbage collection cc pauses as nodes struggle to free sufficient space for queries in the cache.
Cassandra Latency Benchmarks
Measuring Cassandra latency typically involves executing operations against a cluster and analyzing the response times. Times for different workloads (such as all or partial reads and writes) may highlight comparative latency issues. For example, a system might exhibit Cassandra high read latency and low write latency.
The built-in stress tool also allows users to simulate various workloads against a Cassandra cluster. Configure the tool to generate read and write operations with different consistency levels, data distributions, and concurrency levels, enabling the measurement of latency under different conditions.
Users may also create custom workloads tailored to specific use cases and performance requirements. These can mimic the behavior of real-world applications more accurately and provide insights into latency under production-like conditions.
The following are results from recent Cassandra benchmarks:
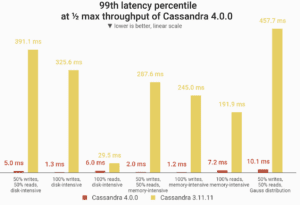
P99 latencies at one half (50%) of maximum throughput of Cassandra 4.0. Cassandra 4.0 reduced these long-tail latencies between 80% – 99% over Cassandra 3.11
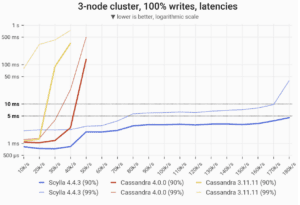
The 90- and 99-percentile latencies of UPDATE queries, as measured on three i3.4xlarge machines (48 vCPUs in total) in a range of load rates.
[See complete Cassandra benchmark details]
Cassandra Read Latency
When a user requests that data be retrieved from the database, several factors might contribute to read latency:
- Disk I/O speed. This impacts latency if data needs to be fetched from disk.
- Data distribution. This is particularly salient when data needs to be fetched from multiple nodes.
- Consistency level. Higher consistency levels might require coordination among more replicas, potentially increasing latency.
- Caching. Caching mechanisms, such as row caching or partition key caching, can reduce read latency by serving data from memory instead of disk.
In Cassandra, improve read latency using the following strategies:
Optimize data models. Minimize the amount of data retrieved for each read operation. Design tables and queries that align with the access patterns of the application. Avoid unnecessary data scans and filtering.
Tune consistency levels based on application requirements. Lower levels (ONE or LOCAL_ONE) query fewer replicas and can reduce read latency, but may also sacrifice some consistency guarantees. Higher levels (QUORUM or LOCAL_QUORUM) add coordination among replicas and provide stronger consistency guarantees but may increase latency due.
Caching. Caching mechanisms, such as row caching or partition key caching, serve frequently accessed data from memory instead of disk. Enabling client-side caching in an application may also improve read performance.
Optimize partitioning and compaction strategies. This distributes data evenly across nodes and minimizes disk I/O for read operations. Select partition keys, configure compaction settings, and monitor data distribution to prevent hotspots and uneven load distribution.
Hardware and configuration. Ensure the Cassandra cluster can handle the expected read workload. This includes provisioning adequate resources (CPU, memory, and disk), tuning Cassandra configuration parameters, and optimizing network settings to minimize latency.
Optimize Bloom filters. Cassandra uses these probabilistic data structures to determine whether data is present in a partition. Bloom filters can help improve read latency by helping the system avoid reading irrelevant data from disk. However, a high number of Bloom filter false positives can cause Cassandra latency spikes. Optimize Bloom filters by adjusting the number of hash functions and the filter size.
SSTable compression. Cassandra stores data in Sorted String Tables (SSTables), immutable data files that hold a sorted list of key-value pairs. SSTable compression can reduce the number of SSTables to improve read latency. Compressing SSTables can speed read time by reducing the amount of data that must be read from disk.
These strategies also improve other types of Cassandra latency.
Cassandra Write Latency
Cassandra write latency is the processing time a database takes from the moment a request is submitted to it through the time when the client application receives the acknowledgment.
Several factors can contribute to Cassandra high write latency:
- Commit log. Write operations are first written to the commit log for durability, and the speed of this operation affects writes latency.
- Memtable. Data is then written to this in-memory structure which is periodically flushed to disk. The flushing process impacts write latency.
- Replication. Write operations must be copied to multiple nodes based on the replication factor, and the time taken for this operation affects write latency.
- Hinted handoff. In case of node failures, these mechanisms can introduce additional latency as data is temporarily stored on other nodes before being delivered to appropriate replicas.
Assess and improve Cassandra write latency using similar monitoring and profiling tools as those described in the context of Cassandra read latency, as well as these additional tools:
Cassandra metrics for write operations. Monitoring tools such as JMX or Prometheus allow users to monitor the performance of write operations at various levels of the Cassandra cluster, including individual nodes, keyspaces, and tables.
Query tracing. This can also trace the execution path of individual write requests. By enabling query tracing for specific write queries, users can obtain detailed information about the various stages involved in processing the write request, including commit log writes, memtable updates, replication, and acknowledgment propagation.
External profiling tools. These can analyze the write operation performance and offer insights into CPU usage, memory consumption, I/O operations, and network activity, helping identify performance bottlenecks and optimization opportunities.
Batching. Batch operations group multiple write requests into groups, reducing the number of round trips between the client application and the Cassandra cluster. This can help amortize network overhead and improve overall write throughput.
Cassandra Insert Latency
Cassandra insert latency is the time it takes to process and acknowledge an insert operation, the addition of new data to the database. Use similar methods as those used for measuring read and write latencies to determine and reduce Cassandra insert latency.
Cassandra Latency Between Nodes
The time from when a request to transmit data is set between nodes in a cluster to when the response is received is also important to assess. Reducing latency between nodes is critical to achieving consistency and reliability in distributed data systems such as Cassandra.
Assess and reduce latency between nodes in Cassandra using these monitoring and diagnostic tools and optimization strategies:
Ping latency. The nodetool ping command sends a request between nodes and measures round-trip response time.
Traceroute. This network diagnostic tool traces packet routes between nodes to provide information about latency at each hop and identify network bottlenecks and latency spikes.
Network optimization. Configure and optimize network infrastructure for low-latency communication between nodes. This may involve using high-speed interconnects, optimizing settings (TCP/IP parameters), and minimizing congestion and packet loss.
Topology optimization. Minimize distance and the number of hops between nodes. Carefully plan node placement within the cluster. Use rack awareness and data center awareness to optimize data locality and reduce inter-node communication latency.
Hardware upgrades. Upgrade Cassandra node components such as network interface cards (NICs), switches, and routers. Invest in higher-speed networking hardware or deploying dedicated network accelerators.
Enable data compression for inter-node communication. This reduces the amount of data transmitted over the network.
Tuning configuration parameters. Adjust internode_compression, concurrent_reads, concurrent_writes, and stream_throughput_outbound_megabits_per_sec to optimize inter-node communication and reduce latency. Experiment with different settings and monitor their impact on latency using performance testing and monitoring tools.
What is Cassandra Range Latency?
Cassandra range latency is the time it takes to retrieve data from one or multiple partitions within a table. This type of latency is crucial for applications that perform range queries, such as fetching data within a specific time range or retrieving data based on a range of partition keys.
To assess range latency in Cassandra, use similar strategies as those described above, along with specific query profiling techniques. Enable query tracing in Cassandra to trace the execution path and measure the latency of queries. By tracing the query execution, you can identify the stages of processing to identify factors contributing to range latency.
To improve range latency in Cassandra, consider the following strategies in addition to those discussed above:
Data modeling. Optimize data models to support efficient range queries by designing partitions, clustering keys, and table schemas to align with typical access patterns, such as those for time-series data or data grouped by specific categories.
Indexing. Appropriate secondary indexes or materialized views for frequently used columns can reduce data scanned during range queries and improve query performance.
Partition size. Ensure that partitions are appropriately sized to balance data distribution. Avoid overly large partitions that trigger resource contention and affect range query performance.
How to Conduct a Cassandra Latency Check?
Typically, conducting a latency check in Cassandra involves measuring the time it takes to process various types of operations (reads, writes, and range queries):
Built-in tools. Use nodetool tpstats, nodetool cfstats, and nodetool tablehistograms to view statistics related to latency, throughput, and proxy requests. Enable query tracing for specific queries using the TRACING ON command in the CQL shell (cqlsh). This allows you to trace the execution path of individual queries and measure the latency of each stage involved in query processing.
Monitoring tools. Java Management Extensions (JMX), for example, exposes many Cassandra metrics including latency, and tools like JConsole or VisualVM can be used to monitor them.
External profiling tools. Java profiling tools can analyze Cassandra node performance at a granular level, offering insights into I/O operations, CPU usage, thread activity, memory consumption, to help identify bottlenecks and opportunities for optimization. Distributed tracing systems can be integrated with Cassandra to trace requests across multiple nodes and measure latency across distributed systems.
Cassandra Latency Comparisons
Cassandra, DynamoDB, and MongoDB, and ScyllaDB are all NoSQL databases, but their underlying architectures and data models deliver different latencies and other measures of performance.
Cassandra vs DynamoDB Latency
Cassandra latency varies based on hardware configuration and other settings as well as workload.
DynamoDB offers configurable options to optimize performance, allowing users to choose between strong and eventual consistency based on their latency requirements.
Cassandra vs MongoDB Latency
Achieving low-latency and strong consistency simultaneously is even more challenging for multi-datacenter deployments or high write loads.
MongoDB is a document-oriented NoSQL database that answers this demand, known for flexibility and rich query capabilities. It offers low-latency for both read and write operations, especially when indexes and sharding are used to distribute data across multiple nodes.
More like DynamoDB, MongoDB’s also optimizes performance with configurable consistency levels.
Recent benchmark studies by benchANT found that while Cassandra has better throughput, MongoDB has lower read latency: “In the vanilla configuration, Cassandra shows higher throughput on all 3 different workloads, but MongoDB always shows lower READ latency, with the same setup and similar consistency. Both performance KPIs are of different importance, depending on the IT application”
The same study also found that although scaling reduces latency on MongoDB, latency remains more stable on Cassandra: “Vertical scaling significantly improves latencies on MongoDB. For Apache Cassandra, horizontal scaling worsens latencies only minimally.”
Read the complete Cassandra vs MongoDB benchmark
Cassandra vs ScyllaDB Latency
ScyllaDB is Cassandra-compatible database designed from the ground up for predictably low latency at extremely high throughput.
ScyllaDB’s design offers a similar architecture, data format, and query language as Cassandra, but without Java and its expensive GC pauses. Teams improve performance at scale with fewer nodes, reduced administration, and lower infrastructure cost. Switching from Cassandra to ScyllaDB requires minimal code modifications.
- ScyllaDB has 2x-5x better throughput and much better latencies than Cassandra
- ScyllaDB adds and replaces nodes far faster than Cassandra
- ScyllaDB finishes compaction 32x faster than Cassandra
- A ScyllaDB cluster can be 10X smaller and 2.5X less expensive, yet still outperform Cassandra by 42%
Learn more about how ScyllaDB and Cassandra compare