
ScyllaDB Advisor is the newest member of the ScyllaDB Monitoring stack. The Advisor focuses on highlighting important information, potential problems, configuration issues, and data model suggestions. What sets it apart is focus on potential issues rather than a general overview of the status.
The Advisor Section
The Advisor section is part of the overview dashboard. It has two parts, the Advisor table and the balance section, and they play two different roles.
The Advisor Table
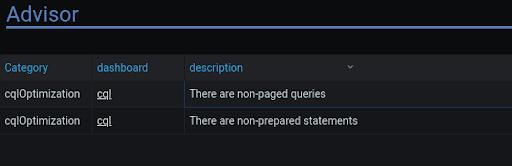
The table on the left holds issues found by the advisor. An issue describes something that the advisor found and is a potential problem.
Here are a few examples:
- Large Cells: Large cells are usually an indication of a problem in the data model. Though it’s not forbidden, it’s an anti-pattern and should be avoided for performance reasons. ScyllaDB identifies large cells (It also identifies large rows and large partitions), prints a warning to the logs, and stores it in a dedicated table. The advisor would add a warning to the table with a navigation link to the CQL dashboard.
- Non-Prepared Statements: In general, You should avoid unprepared statements. They have a performance impact and can cause security risks.
One more thing about the Advisor table section: the Advisor uses low-priority alerts that, by default, are only shown on the dashboard. You can configure the alertmanager to send those alerts to an email, slack channel, etc., as well.
Advisor – Balance Section
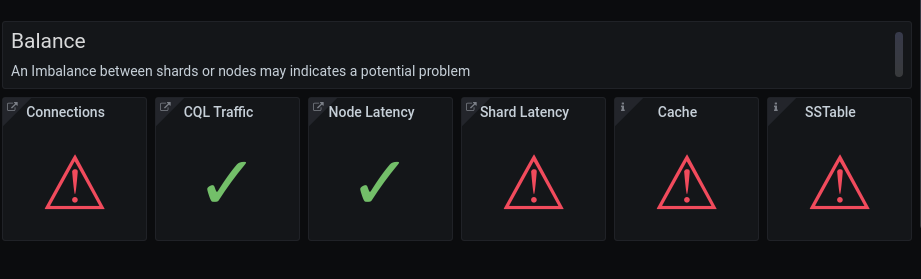
In a typical system, we expect all nodes and shards to act the same during normal workload.
The Balance section looks for outliers in different categories that are known to indicate potential problems.
Here are a few examples:
- All shards should have the same number of connections. If this is not the case, there are not enough connections open, or the driver is not ScyllaDB optimized.
- We expect a uniform distribution of the traffic. If this is not true, either you are using a driver that is not shard-aware, or there is a hot-partition, and you need to change the data model.
How the Advisor Works
After we understand what the Advisor does, let’s understand how it works. The Advisor uses low priority alerts for the Advisor table and metrics for the balance section. The two new additions to the ScyllaDB Monitoring Stack are Grafana’s Loki and recording rules.
![]()
Grafana Loki
Grafana Loki is used to generate metrics and alerts based on logs. Loki is a log collection that serves multi-purposes:
- It can generate alerts based on traces and send them to the alert manager. These kinds of alerts contain information from the trace line and are hard to produce another way.
- It serves as a metric source for Prometheus. Metrics are good at showing history and changes and are space-efficient to store.
- And third, Loki acts as a Grafana data source. That means you can search ScyllaDB’s logs directly from the dashboard using the dashboards explorer feature.
Prometheus Recording Rules
Prometheus recording rules are a method to generate metrics from existing one or more metrics calculation. The use of recording rules simplify alerts creation.
Next steps
Now that you’ve seen the changes that were made in ScyllaDB Monitoring Stack 3.6 to make it even better. The next step is yours! Download ScyllaDB Monitoring Stack 3.6 directly from Github. It’s free and open source. If you try it, we’d love to hear your feedback, either by contacting us privately or sharing your experience with your fellow users on our Slack channel.