Database and system administrators want to track applications/infrastructure metrics and determine how to best utilize their systems. They want to track trends in time and to correlate between multiple systems to identify business impacts and improve upon their base performance.
The ability to use standard formats for metrics makes this correlation easy and empowers everyone familiar with these formats to use them without being locked in with one vendor.
With that in mind, ScyllaDB Cloud, our fully managed NoSQL DBaaS with its DynamoDB and Apache Cassandra APIs, supports extracting cluster metrics in Prometheus format. Prometheus is the open source monitoring solution from the Cloud Native Computing Foundation (CNCF).
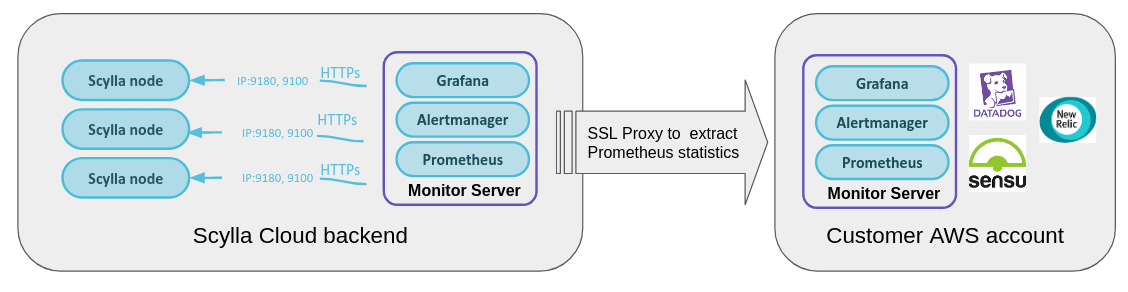
ScyllaDB’s Extract Metrics feature uses an internally-developed proxy to ship those metrics to customer systems in a secure method. Customers can then choose how to utilize those metrics, either using ScyllaDB Monitoring Stack or any other 3rd party platform that supports the Prometheus format (e.g: Datadog, Sensu, New Relic, and many others).
What ScyllaDB Cloud Extract Metrics gathers
By activating the Extract Metrics feature on a cluster, you can extract all ScyllaDB statistics and perform the following tasks:
- See more dashboards than the default ScyllaDB Cloud monitor delivers. This includes the CQL Optimization dashboard, a tool to help identify potential issues with queries, data model and driver, OS statistics, errors, table statistics and much more.CQL optimization dashboard:
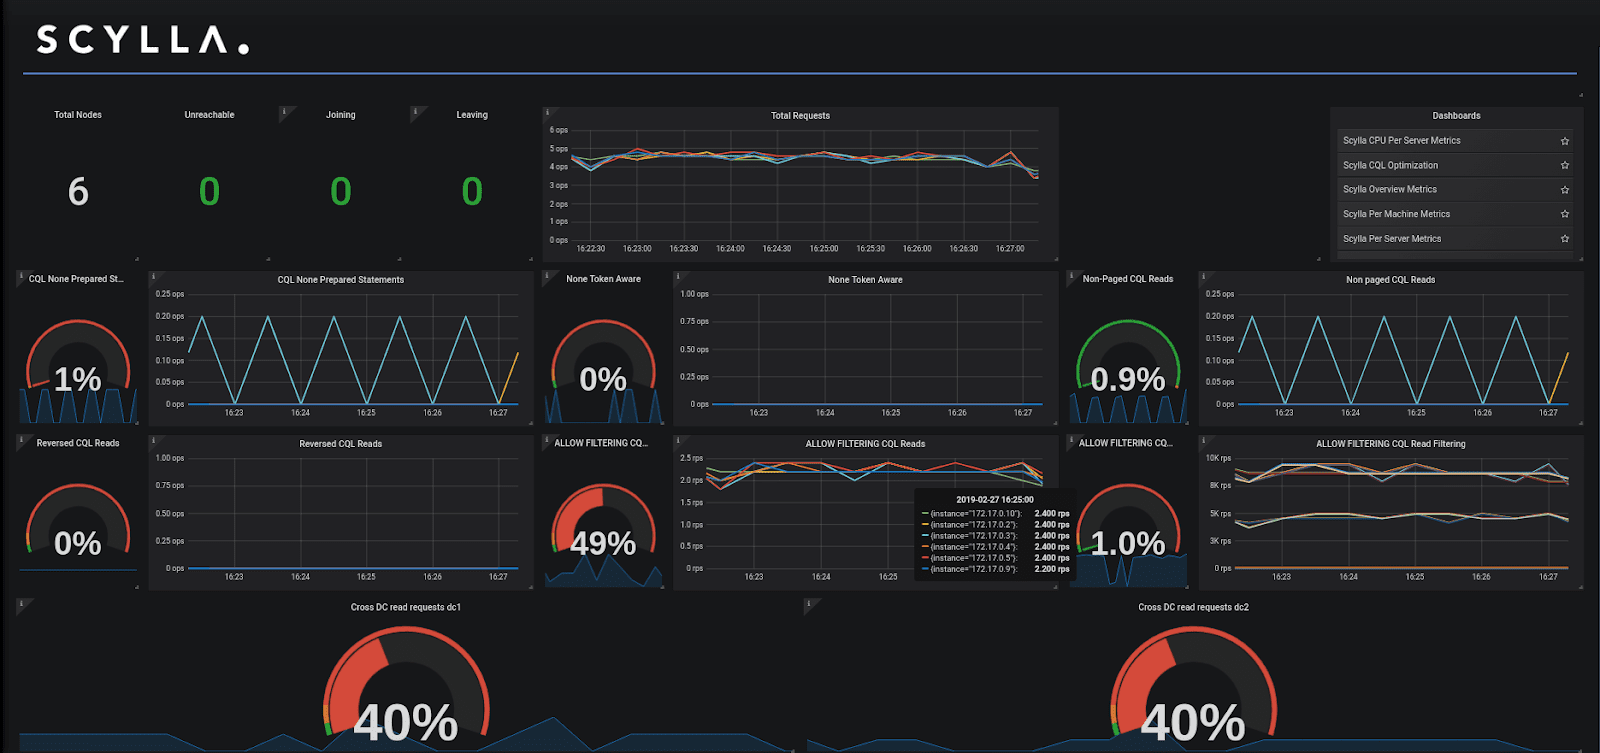
ScyllaDB Monitoring Stack CQL optimization dashboard
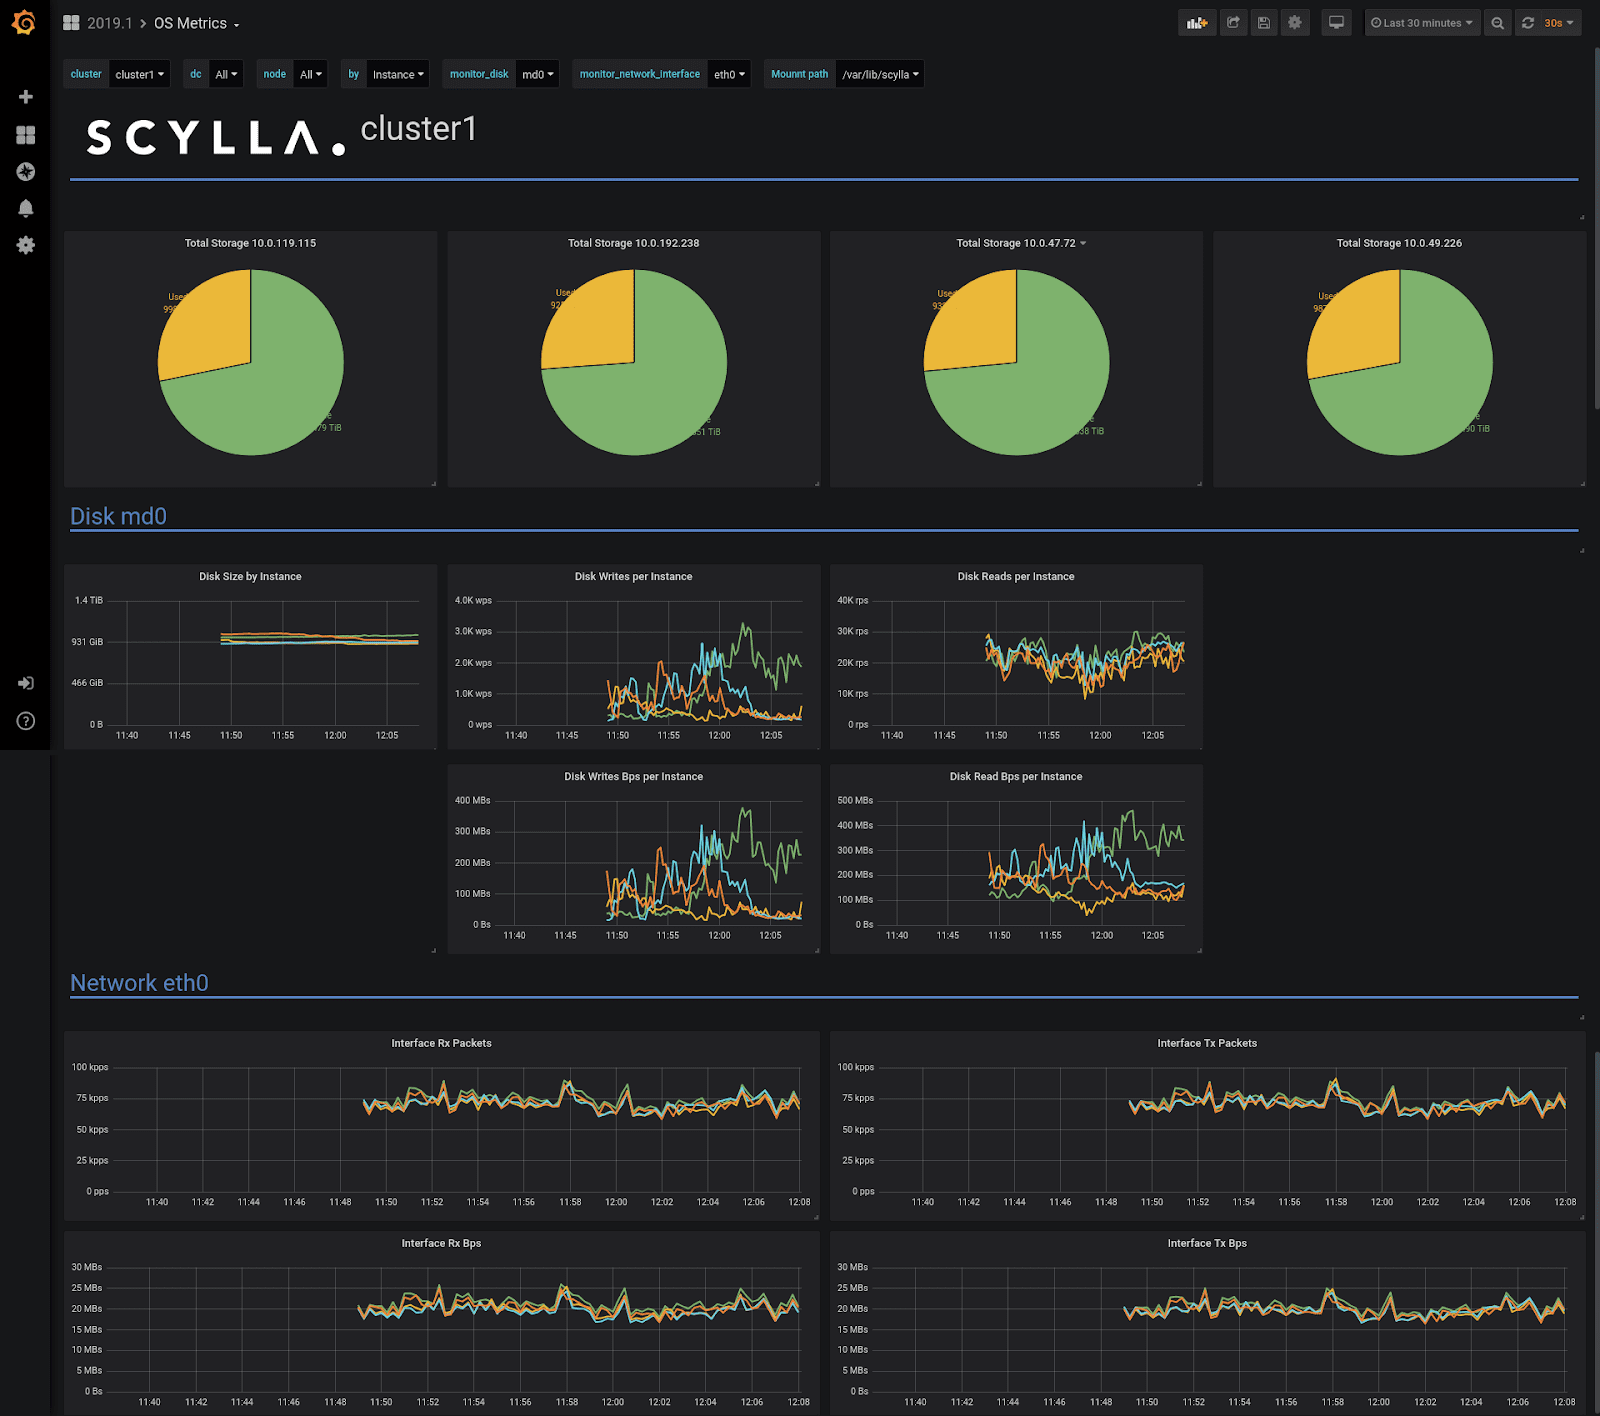
ScyllaDB Monitoring Stack OS metrics dashboard
- Create your own dashboards
Want to organize your dashboards exactly the way you want? We give you all the relevant instructions here: Adding and Modifying Dashboards - Define Business-specific alerts
Define normal behavior for your workload, and create customized alerts to notify you when your cluster exceeds or falls below acceptable bounds of these performance patterns. Read more about setting up your alerts. - Export metrics to any 3rd party Prometheus format monitoring tool
Datadog, Sensu, New Relic, and many others. For example, read our blog about using Datadog with ScyllaDB.
Key Metrics
ScyllaDB supports thousands of metrics, and it can be challenging to extract the key metrics one should keep track of. One good way to do so, is using the provided Grafana dashboards, which represent a subset of metric ScyllaDB Engineers identified as important.
For example, the Cluster Overview dashboard include the following metrics (and more):
- Node Status: scylla_node_operation_mode
- CPU (Reactor) load: scylla_reactor_utilization
- Size of ScyllaDB Data Directory: node_filesystem_size_bytes
- Requests served: scylla_transport_requests_served
- Number of write requests: scylla_storage_proxy_coordinator_write_latency_count
- Write requests latency: scylla_storage_proxy_coordinator_write_latency_sum
- Write Timeouts: scylla_storage_proxy_coordinator_write_timeouts
- Number of read requests: scylla_storage_proxy_coordinator_read_latency_count
- Read requests latency: scylla_storage_proxy_coordinator_read_latency_sum
- Read timeouts: scylla_storage_proxy_coordinator_read_timeouts
- Cache Hits: scylla_cache_row_hits
- Cache Miss: scylla_cache_row_misses
Get Started Today
This feature is now available to all users of ScyllaDB Cloud. To use this feature on existing clusters, follow this user guide: Extract Cluster Metrics in Prometheus format.
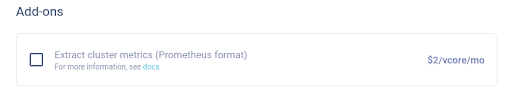
For new clusters, check the box Extract Cluster Metrics: