
Keeping ScyllaDB clusters repaired and backed up are the two most important functions that ScyllaDB Manager provides. But there is one more function that can be easily overlooked: probing clusters to establish health check status reports of the clusters.
It may seem redundant that each node status is reported to ScyllaDB Monitoring twice:
- By each node directly, over Prometheus metric API
- By Manager Health Check
This is useful in the (rare) cases when a node thinks he is up and running, while in practice, clients can not connect to the CQL API or are experiencing high latency responses. In such cases, the node will report itself to be in a normal state, while Manager Health Check, using the CQL API, identifies an issue and reports it.
This article will explore how health checks were improved with dynamic timeouts in ScyllaDB Manager 2.2.
Dynamic Timeouts
Health Check status reports are provided by the sctool status command. Behind the scenes this command sends a request to the ScyllaDB Manager REST API which in turn is doing all necessary status checks. Checks are performed in parallel on all nodes of a cluster.
ScyllaDB Manager can manage multiple clusters spanning multiple datacenters (DCs) at the same time. Latencies can vary greatly across all of them. ScyllaDB Manager’s existing static latency configuration proved to be problematic for a use case with different DCs, each within different regions. To tackle this problem ScyllaDB Manager 2.2 introduced dynamic timeouts.
Idea behind dynamic timeouts is to minimize manual configuration but still adapt dynamically to changes in the managed environments. This is done by calculating timeout based on a series of past measurements.
Main advantage of dynamic over static timeouts is that the former are able to adapt to gradual increase in response time.
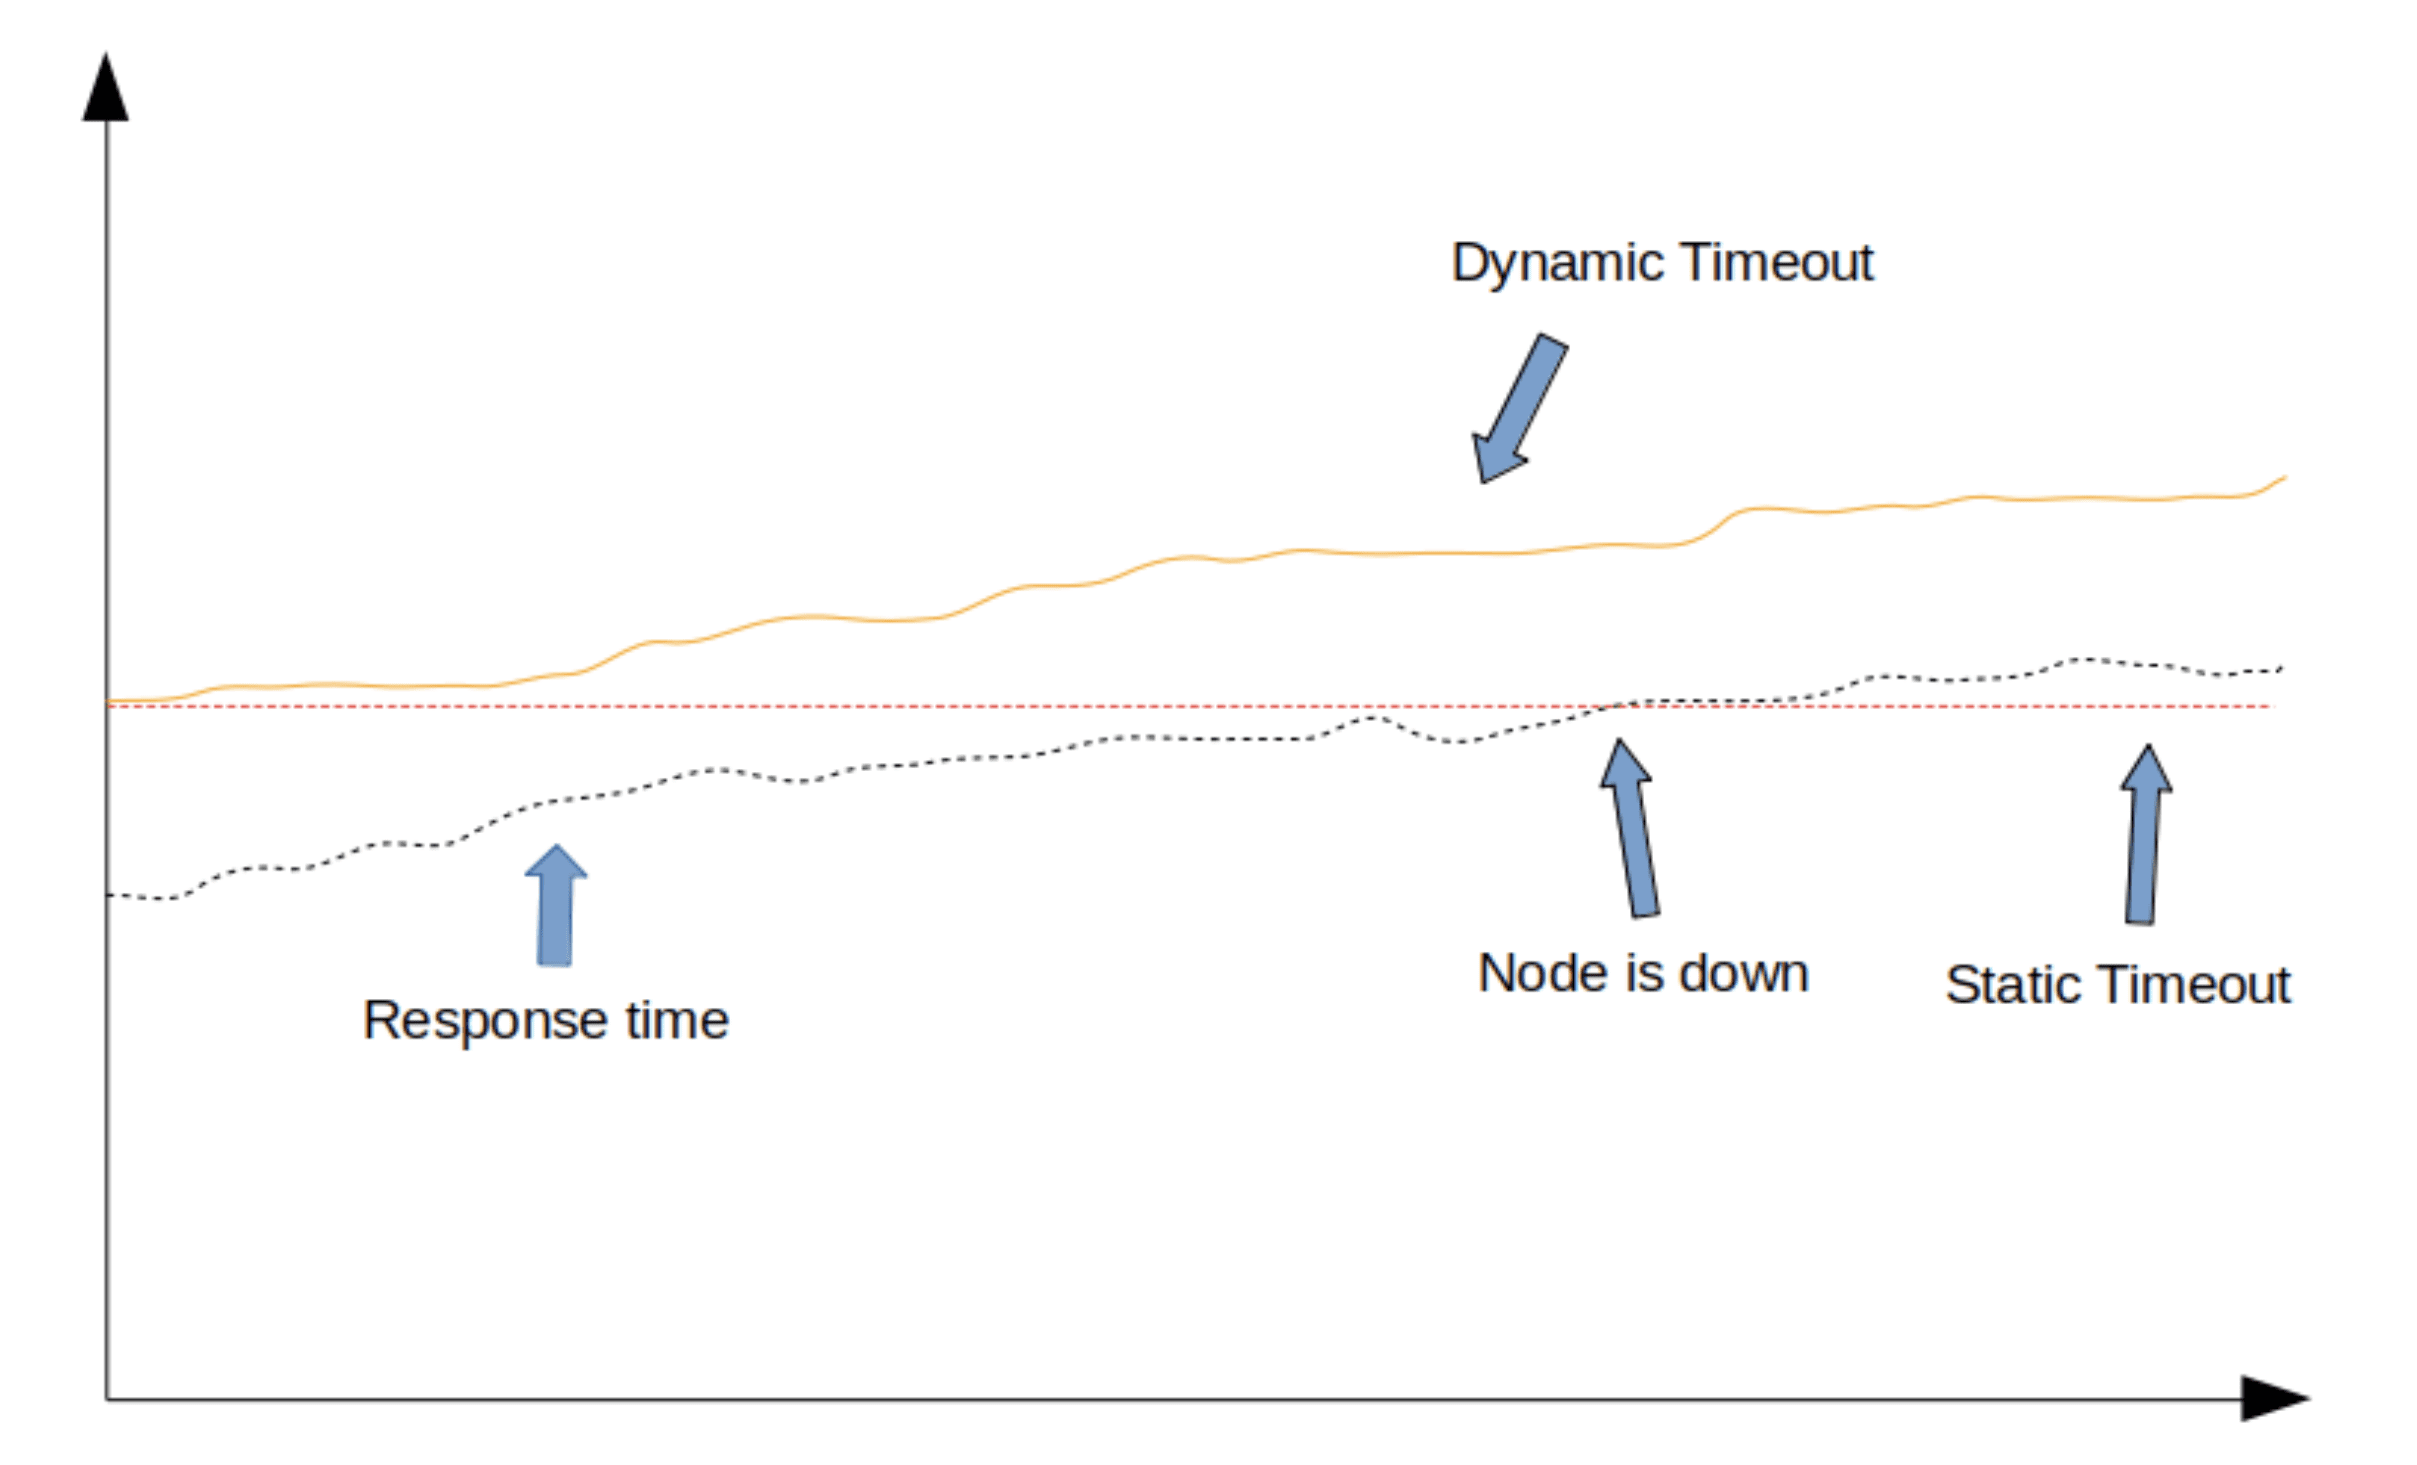
Dynamic vs. Static Timeout Limits
Sudden spikes in response time are still going to hit the limits:
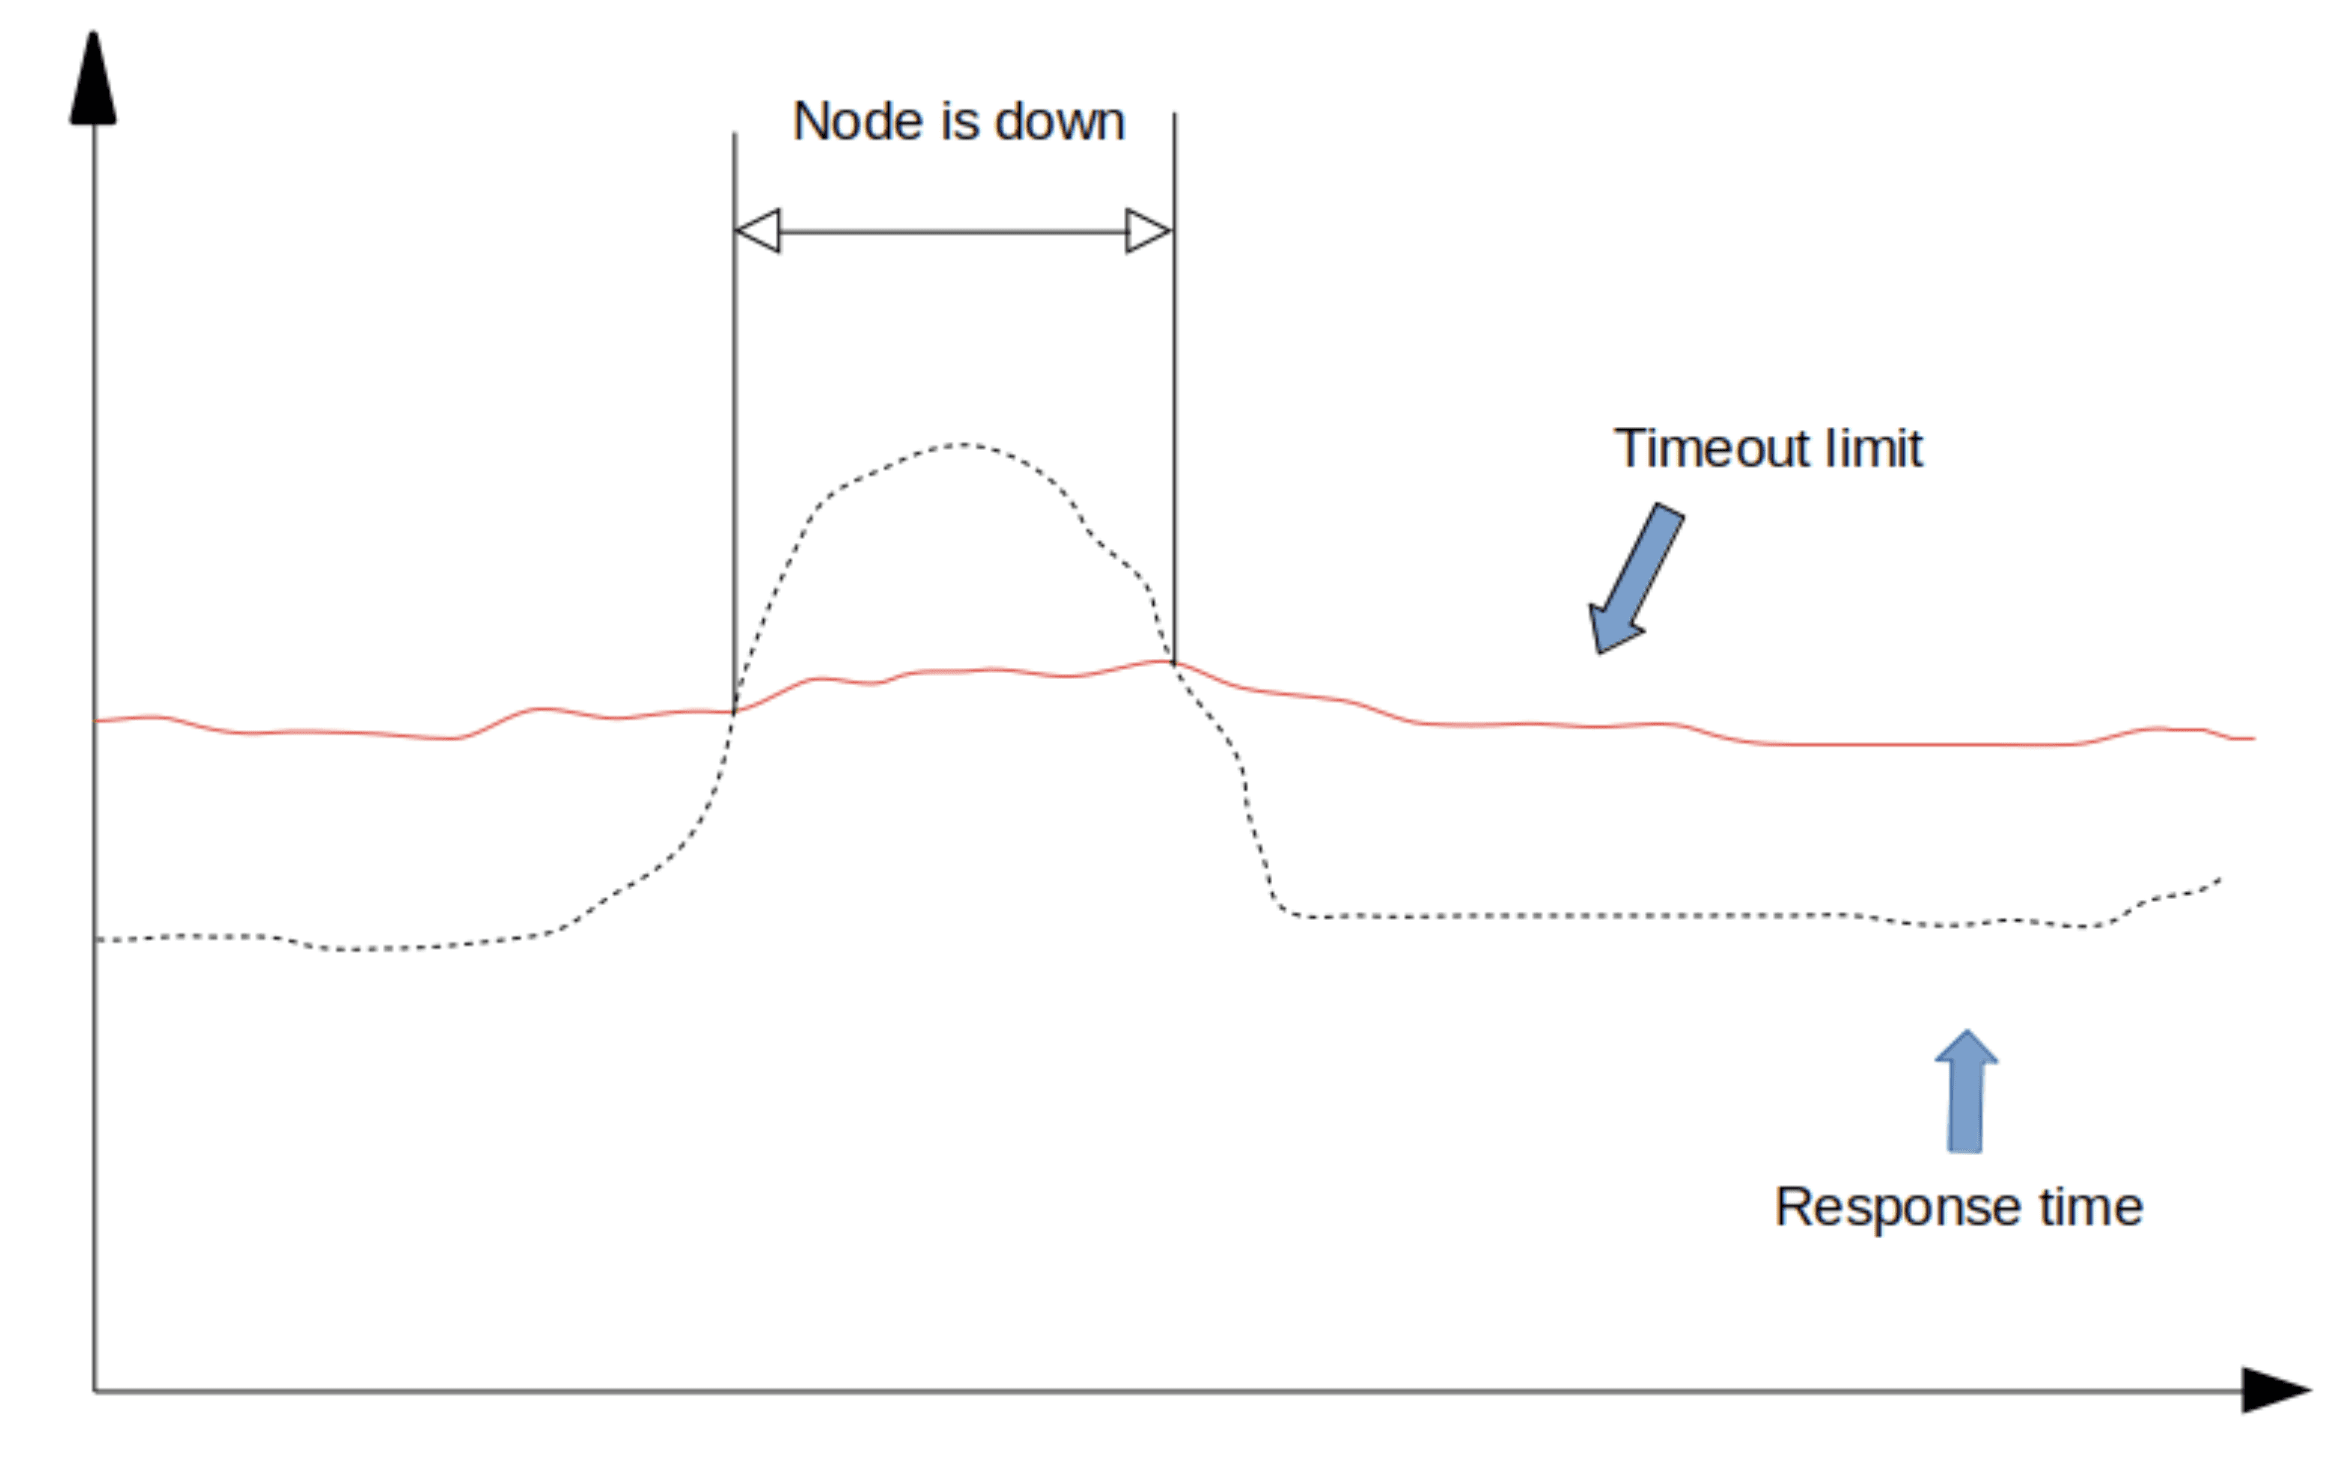
Sudden increase in response time with a down node
Here’s an example configuration for Health Check dynamic timeouts in the config file:
# Dynamic timeout calculates timeout based on past measurements.
# It takes recent RTTs, calculates mean (m), standard deviation (stddev),
# and returns timeout of next probe equal to m + stddev_multiplier * max(stddev, 1ms).
#
# Higher stddev_multiplier is recommended on stable network environments,
# because standard deviation may be close to 0.
# dynamic_timeout:
# enabled: true
# probes: 200
# max_timeout: 30s
# stddev_multiplier: 5
Fixed timeout configuration remains as an option, but if healthcheck.dynamic_timeout.enabled is set to “true“, then it will be ignored and dynamic timeouts will be used instead.
The formula for calculating dynamic timeout is calculated as follows:
- m – mean across N most recent probes
- stddev – standard deviation across N most recent probes
- timeout = m + stdev_multiplier * max(stddev, 1ms)
Instead of setting global fixed value for the timeout users can set behaviour of dynamic timeout by turning a few knobs:
healthcheck.dynamic_timeout.probes — How many past measurements to consider in the timeout limit calculation. The more probes there are, the more current limit will be based on the trend of past values. If it’s expected for the limit to not quickly adjust to changes this should be increased and vice versa.
healthcheck.dynamic_timeout.max_timeout — If there are no past measurements or we haven’t yet fulfilled at least 10% of the required number of measurements then this value will be used as the default timeout. This should be set to a big enough value that empirically makes sense for all managed clusters until the optimal number of probes is collected.
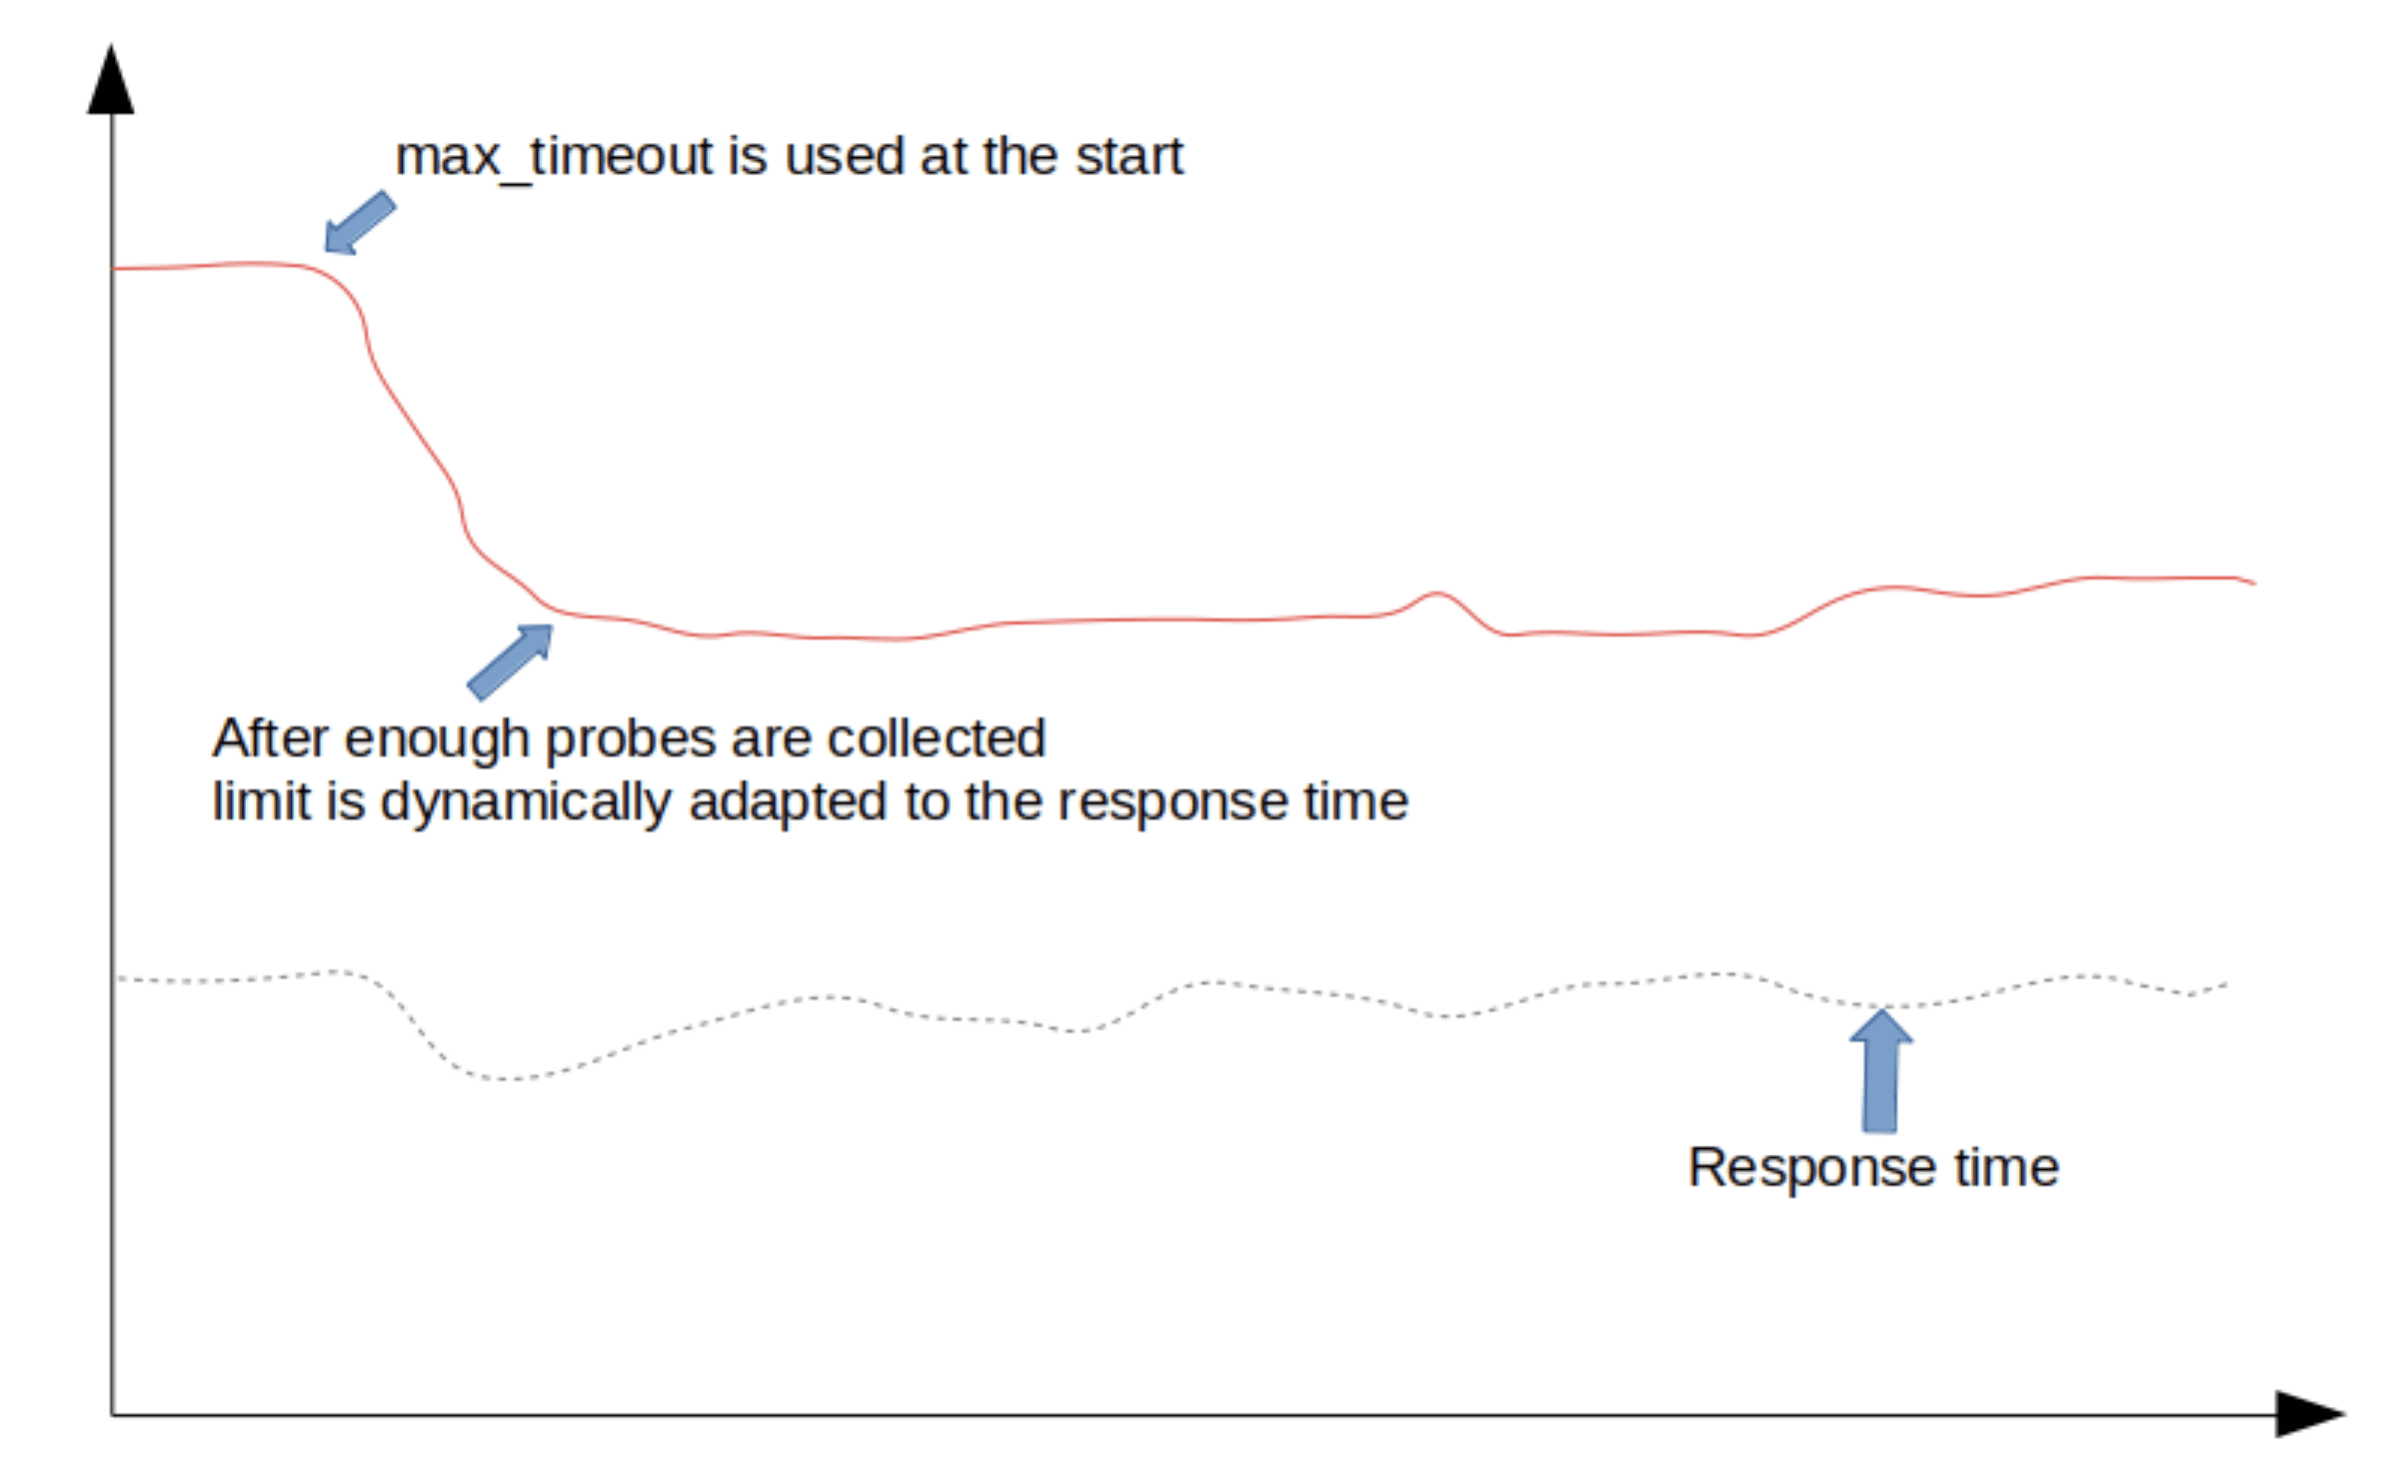
max_timeout behavior
healthcheck.dynamic_timeout.stddev_multiplier — Use this to configure an acceptable level of variation to the mean response time. This value sets the threshold for fluctuations in normal operations. With increase it will allow more erratic behavior in response time before timeout is triggered.
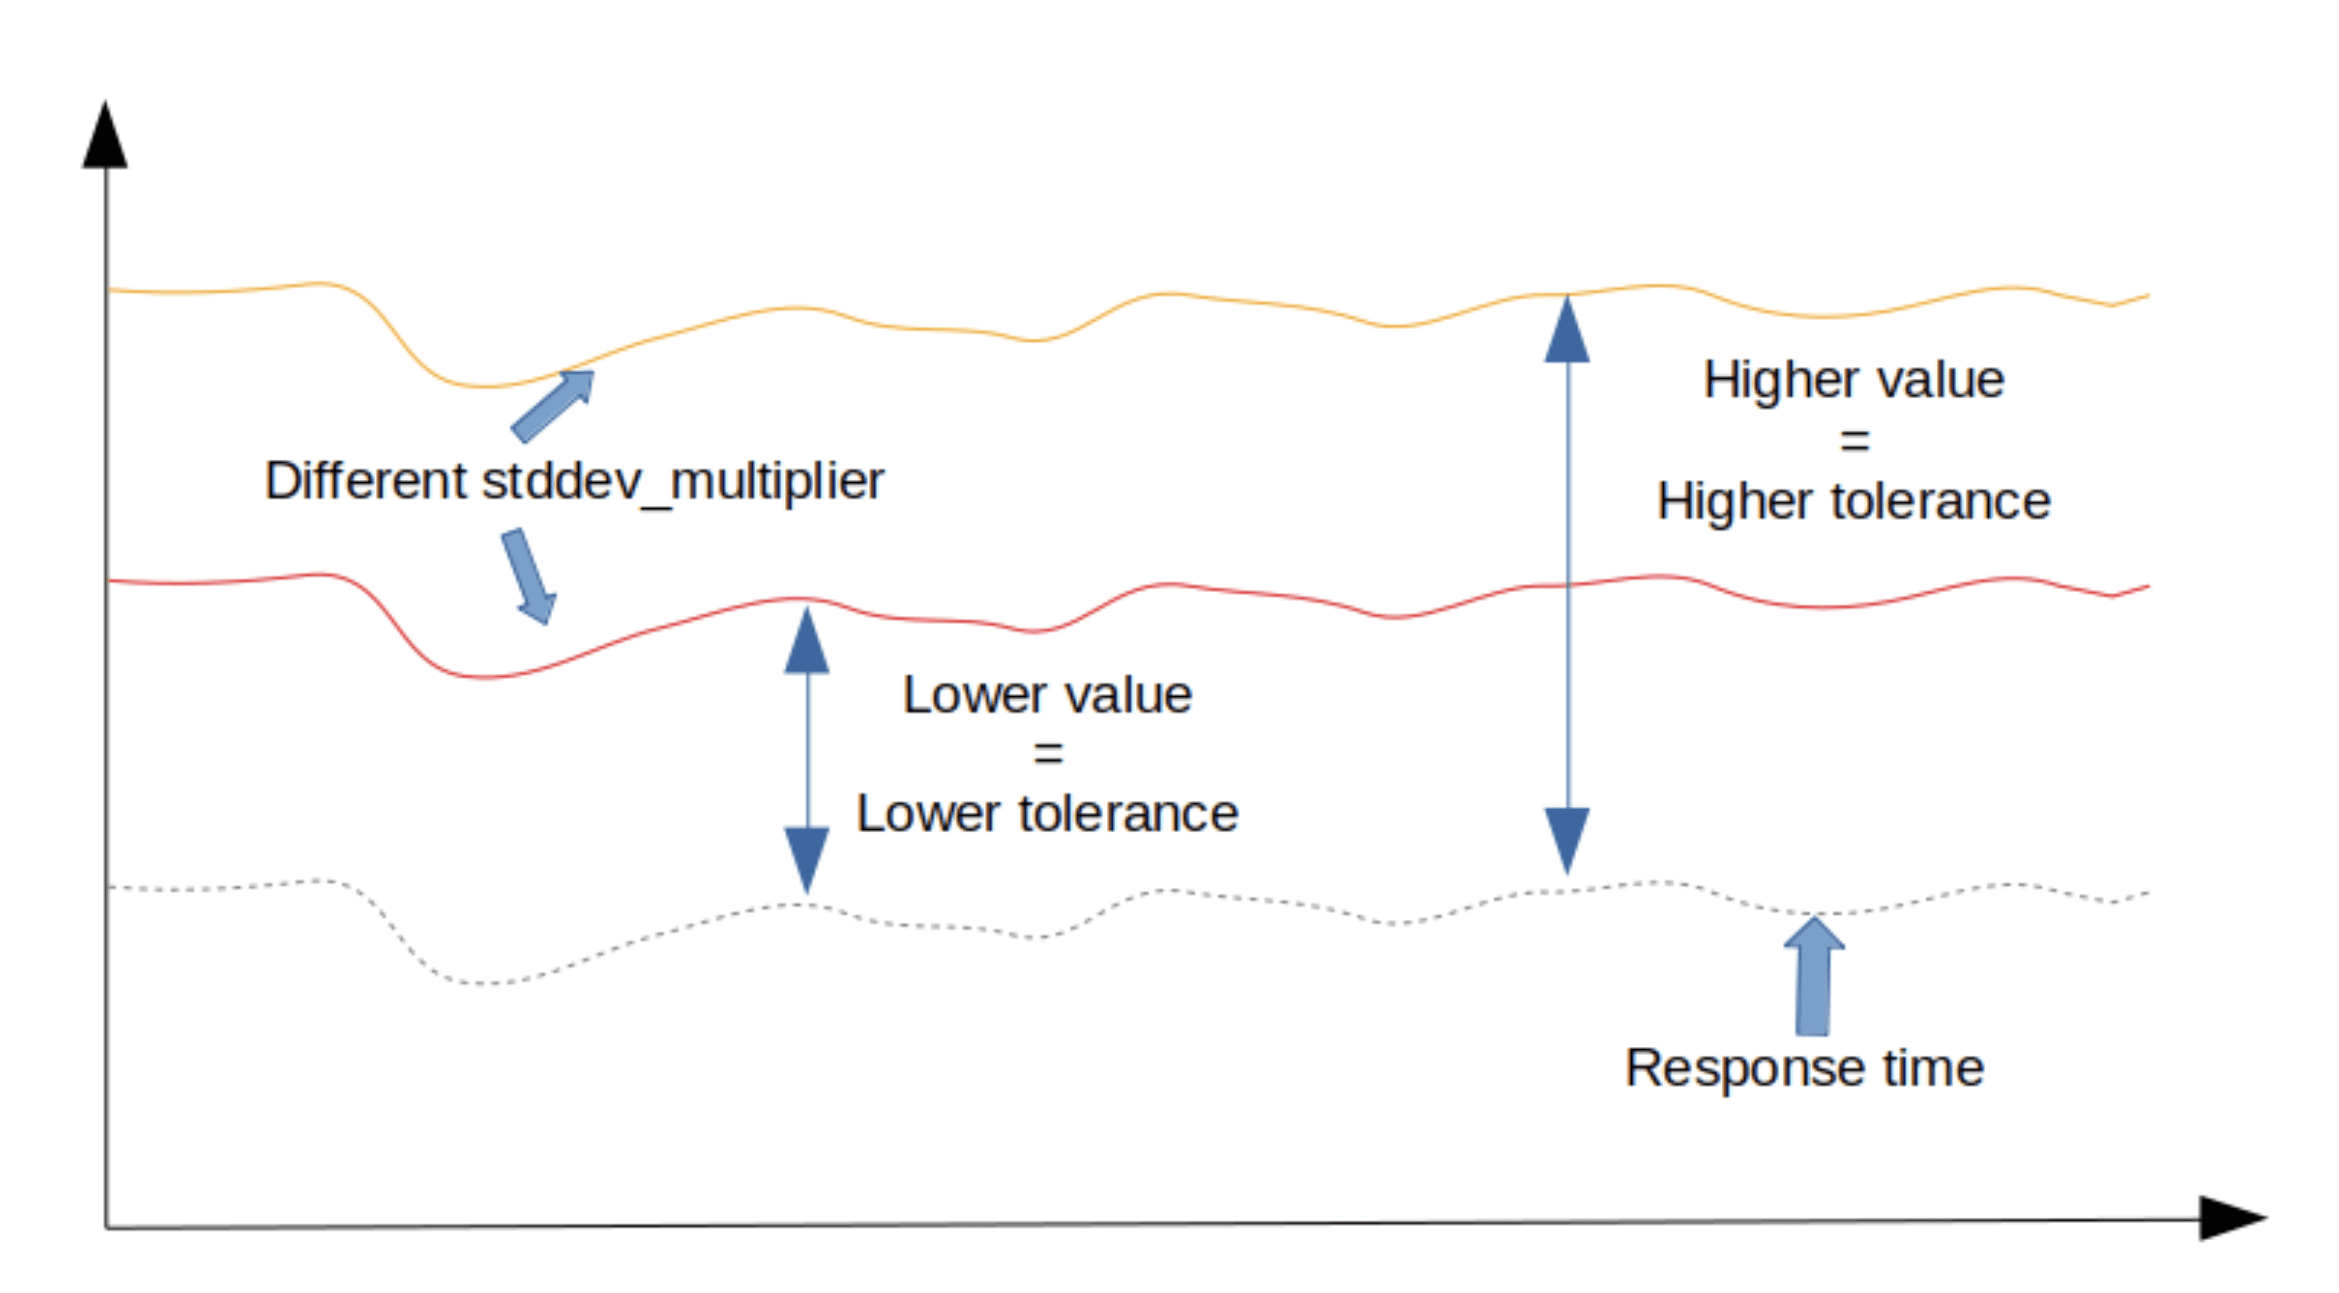
Comparison of stddev_multiplier settings
Conclusion
ScyllaDB Manager already had excellent options for ad hoc health checks of ScyllaDB clusters. With dynamic timeouts it just became even more user friendly. Beyond health checks ScyllaDB Manager 2.2 offers improved repair processes with features like parallel repairs, graceful stops, visibility into repair progress, small table optimization and more.
If you are a user of ScyllaDB Manager we are always looking for feedback on how we can improve our product. Feel free to contact us directly, or bring up your issues in our Slack community.