Grafana is a great observability platform. One of its key strengths comes from its plugin system. (To give you an idea of how popular the extension of Grafana through plugins is, you can find the entire list of available plugins here.)
In this post I will explain how to build a simple data source plugin for Grafana 7, using ScyllaDB as an example. I’ll focus on how to create a new data source plugin and specifically on backend plugins.
When building your own dashboard you would usually use two types or plugins: datasource and panels.
- Data source plugins allow grafana to connect to a variety of sources and display the results. There are already many plugins for known databases.
- Panel plugins make it possible to extend how data is displayed.
Creating a Backend Plugin
In this article I will show you how I created a backend plugin for ScyllaDB that would also work with Apache Cassandra. To make it easier to follow the instructions I have created the following open source repository:
https://github.com/amnonh/backend-grafana-blogpost
You can look at the commit-list to follow the steps in this post. If you are looking for the actual plugin it is in:
https://github.com/scylladb/scylla-grafana-datasource
All of this work is open source, available under the Apache 2.0 license.
Prerequisites
Grafana has frontend and backend parts. Typically, a user is exposed to the frontend. For example, in the combination of running Grafana with Prometheus as a metric server, the data is collected in the user browser and then displayed.
While we call it a backend plugin, it actually has a frontend and a backend. The backend will be written in Go and the frontend uses react. You don’t need much experience in either to follow along. If you don’t have these already, you’ll need to install the following:
 |
|
And optionally:
Creating the Plugin
This guide follows the Grafana data source guide and customizes it. In general these are the steps we’ll take:
- Setup your environment
- Create a plugin
- Implement data queries
- Add support for health checks
- Enable alerts in Grafana
Setting Up Your Environment
We will need some configuration and I like to do my Grafana configuration from files so I suggest that you create a directory for all Grafana development.
mkdir grafana-dev
cd grafana-dev
Running Grafana in Docker
This is optional. In development I use Docker for running Grafana (I’m also going to use Docker for ScyllaDB). I suggest you would add two scripts to start and stop Grafana in Docker.
This the script I’m going to use to start grafana:
$ cat run-grafana.sh
docker run -d -p 3000:3000 \
    -e "GF_AUTH_BASIC_ENABLED=false" \
    -e "GF_AUTH_ANONYMOUS_ENABLED=true" \
    -e "GF_AUTH_ANONYMOUS_ORG_ROLE=Admin" \
    -v $PWD/grafana/dashboard:/var/lib/grafana/dashboards:z \
    -v $PWD/plugins:/var/lib/grafana/plugins:z \
    -v $PWD/provisioning:/var/lib/grafana/provisioning:z \
    -e "GF_PATHS_PROVISIONING=/var/lib/grafana/provisioning" \
    -e "GF_SECURITY_ADMIN_PASSWORD=admin" \
    -e "GF_PLUGINS_ALLOW_LOADING_UNSIGNED_PLUGINS=Your-Plugin-ID" \
    --name grafana grafana/grafana:7.1.5
This is the script I’m going to use to kill it:
$ cat kill-grafana.sh
docker kill grafana
docker rm -v grafana
If you are familiar with Grafana, note the following:
- The
GF_AUTH_ANONYMOUS_ENABLEDflag that supports the new unsigned plugin. - The plugins directory, it would allow grafana to find the plugin.
- The provisioning directory that would allow us to configure the plugin from file.
Creating the base for the plugin
mkdir -p provisioning/datasources/

mkdir plugins

cd plugins
I’m using scylla-datasource as the plugin name.
Follow the instructions to create the plugin
npx @grafana/toolkit@next plugin:create scylla-datasource

cd scylla-datasource
After you have updated the plugin SDK and compile, stop.
Before we do anything else, let’s use git:
git init
git add .
git commit -m "initial commit"
First Test
If you haven’t done so, run the Grafana server, if you are using docker, you can use docker restart grafana.
Check the logs with:
docker logs grafanaAnd look for msg="Running an unsigned backend plugin".
If you see a warning about not running an unsigned plugin, make sure you get the plugin name right with the GF_AUTH_ANONYMOUS_ENABLED flag.
You can now follow the rest of the tutorial to add your datasource from the dashboard.
I suggest you do that and get back to this post when you’re done.
Post the basic tutorial
Welcome back! In the rest of the post, I will cover multiple subjects that were not clear to me while developing the backend plugin. I tried to break each subject into its own independent section. Besides the explanations you can follow the commits in the repository here.
Data source configuration
Adding a datasource comes with its own configuration.
If you followed the guide, when you added the plugin, you saw a screen such as:
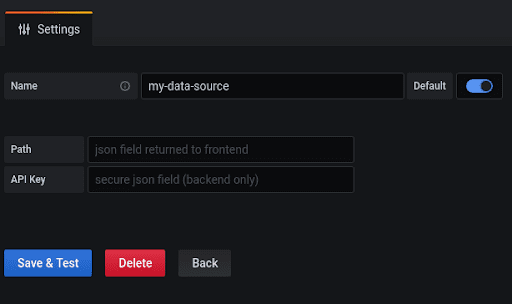
Which is a basic configuration that can help you get started.
Before explaining how to modify it, you should note the two kinds of configurations that share the screen. There is a regular one and backend only.
When an admin configures a data source (in our case, a ScyllaDB database) to be able connect to it securely, we need a username and a password. Once we configure the username and password, we don’t want other users to be exposed to it. Other parts of configurations can be public and we would like users to be able to see them (for example the host it will be connected to).
The configuration has secure and non-secure parts. The secure part can be set or reset, but once configured it will not be sent back to the frontend. The non secure part is shown and can be changed. Grafana supports those two types.
For our example we are going to have a secure username/password and non-secure host.
There are two files we need to change:
- src/types.ts that holds the types definitions.
- src/ConfigEditor.tsx that holds the code for showing and changing the configuration.
Non-Secure
In types.ts look for MyDataSourceOptions this is the interface definition of the non-secure part of the configuration. For our example, we will change the path? to host?.
export interface MyDataSourceOptions extends DataSourceJsonData {
    host?: string;
}
Now edit ConfigEditor.tsx and change the path to host. Compile your code with yarn build, now when you adds a new plugin it looks like this:
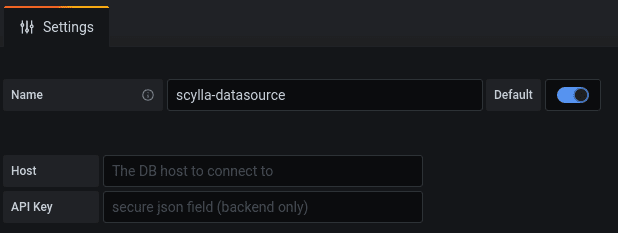
I’ve also changed the host description, you can see the full changes in the commit.
Secure
Now let’s add the username and password. Edit the types.ts and update MySecureJsonData.
export interface MySecureJsonData {
    user?: string;
    password?: string;
}
Edit configEditor.tst, look at how the apiKey is configured and change it to password, note the use of the secretFormField, once configured secret configuration can only be reset and re-assigned.
After you made the changes compile and reload the data source configuration, it should now looks like this:
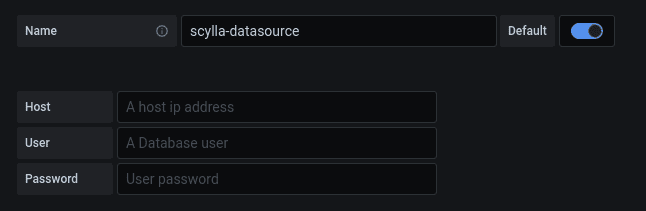
Note that I’ve changed the user and password text, look at the git commit for full change.
Congratulations, you have seen how to change the backend configuration!
Configure the data source from a datasource.yml file
As I’ve mentioned before, I like to use files for grafana configurations. You can read more about my take on dashboards from files here.
Just like the start script that I’ve mentioned to start the grafana container you can put your plugin configuration in a file, if you use the suggested run script, you already have everything you need for that.
Go back up to the directory that holds the run-grafana.sh script, under the provisioning directory we already created a datasource directory.
Create a datasource.yml file:
printf "apiVersion: 1\ndatasources:\n- name: scylla-datasource\n type: your-datasource\n orgId: 1\n isDefault:\n jsonData:\n host: ''\n secureJsonData:\n user: 'ScyllaDB-User'\n password: 'ScyllaDB-Password'\n" > provisioning/datasources/datasource.yamlMake sure you change your-datasource to the data source id you are using, in my case this is scylla-scylla-datasource.
Restart Grafana and make sure that now you have the plugin configured.
Query Configuration
The second frontend configuration, is the query configuration. This is the user’s way to control what will be returned from the data source.
Create a new dashboard, add a panel and set its data source to the newly configured one.
You should see something like:
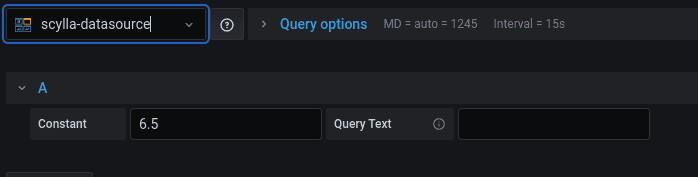
We will change it to CQL and an optional host.
Basic
Edit the types.ts file and change the MyQuery interface to:
export interface MyQuery extends DataQuery {
    queryText?: string;
    host?: string;
}
And remove the use of constans in the defaultQuery part.
Note that defaultQuery is the place to add default values for your input.
Edit QueryEditor.tsx. This is the file that controls how the query editor looks and behaves.
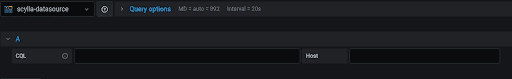
You should replace constant with host, make sure to remove the number formatting.
This is how it looks like, note that I’ve set the input width.
Template variables
Grafana supports template variables, those variables can be set explicitly or taken from a metric. You can read more about adding variables to a plugin here.
In general, you need to explicitly do the variable replacement before sending the query to the backend plugin.
Todo that you will need to edit src/DataSource.ts.
The latest version of grafana runtime holds the TemplateSrv that can be used to fetch available template variables.
You need the getTemplateSrv to get it.
Edit DataSource.ts and add the following:
import { DataSourceInstanceSettings } from '@grafana/data';
import { DataSourceWithBackend } from '@grafana/runtime';
import { MyDataSourceOptions, MyQuery } from './types';
import { getTemplateSrv } from '@grafana/runtime';

export class DataSource extends DataSourceWithBackend<MyQuery, MyDataSourceOptions> {
  constructor(instanceSettings: DataSourceInstanceSettings) {
    super(instanceSettings);
  }
  applyTemplateVariables(query: MyQuery) {
    const templateSrv = getTemplateSrv();
    return {
      ...query,
      queryText: query.queryText ? templateSrv.replace(query.queryText) : '',
      host: query.host ? templateSrv.replace(query.host) : '',
    };
  }
}
As you can see, applyTemplateVariables allows you to modify the values before they are sent.
So far we took care of the frontend side, it’s time to move to the backend with go.
Writing the Backend part
Getting the data from the request
Our request holds two parameters, the queryText and the host.
Update the queryModel accordingly:
type queryModel struct {
    Format string `json:"format"`
    QueryText string `json:"queryText"`
    Host string `json:"host"`
}
Compile with mage and restart Grafana for the change would take effect.
I have added a log line in the code to print the results so I can see that data is transferred between the frontend to the backend.
Connection Management
The base template suggests to use an instance manager for the life cycle management of data source instances. In practice, the im variable inside SampleDatasource can generate new connections when needed.
ScyllaDB and Apache Cassandra use CQL to query the database. We will use the Go driver for that.
In the import part, replace the http with
"github.com/gocql/gocql"
Change instanceSettings to:
type instanceSettings struct {
    cluster *gocql.ClusterConfig
    session *gocql.Session
}
The newDataSourceInstance needs to use the host from the backend configuration.
func newDataSourceInstance(setting backend.DataSourceInstanceSettings) (instancemgmt.Instance, error) {
    type editModel struct {
        Host string `json:"host"`
    }
    var hosts editModel
    err := json.Unmarshal(setting.JSONData, &hosts)
    if err != nil {
        log.DefaultLogger.Warn("error marshalling", "err", err)
        return nil, err
    }
    log.DefaultLogger.Info("looking for host", "host", hosts.Host)
    var newCluster *gocql.ClusterConfig = nil
    newCluster = gocql.NewCluster(hosts.Host)
    session, _ := gocql.NewSession(*newCluster)
    return &instanceSettings{
        cluster: newCluster,
        session: session,
    }, nil
}
You can see in the code, how to get information from the setting JSONData, remember that there are two parts to the backend data source configuration, this is the unsecured part.
Another thing is how a session is created once and is kept for future use.
Dataframe Response
If you look at the query method, you see the use of Dataframe to to return the result. Dataframe are column oriented, Each data frame has multiple fields you can read more about fields here.
In the generated example, fields are created with their type and results. A Database plugin is an example for a situation where both are created based on the returned results.
We are going to add two helper methods getTypeArray that will use the column type return from ScyllaDB to create the fields and toValue that would be responsible for type casting.
We will use the following import:
"math/big"
"gopkg.in/inf.v0"
"strconv"
Add the following helper methods.
func getTypeArray(typ string) interface{} {
    switch t := typ; t {
        case "timestamp":
            return []time.Time{}
        case "bigint", "int":
            return []int64{}
        case "smallint":
            return []int16{}
        case "boolean":
            return []bool{}
        case "double", "varint", "decimal":
            return []float64{}
        case "float":
            return []float32{}
        case "tinyint":
            return []int8{}
        default:
            return []string{}
        }
}
func toValue(val interface{}, typ string) interface{} {
if (val == nil) {
return nil
}
switch t := val.(type) {
case float32, time.Time, string, int64, float64, bool, int16, int8:
return t
case gocql.UUID:
return t.String()
case int:
return int64(t)
case *inf.Dec:
if s, err := strconv.ParseFloat(t.String(), 64); err == nil {
return s
}
return 0
case *big.Int:
if s, err := strconv.ParseFloat(t.String(), 64); err == nil {
return s
}
return 0
default:
r, err := json.Marshal(val)
if (err != nil) {
log.DefaultLogger.Info("Marshalling failed ", "err", err)
}
return string(r)
}
}Now we need to change the query method to read the results from the CQL connection.
func (td *SampleDatasource) query(ctx context.Context, query backend.DataQuery, instSetting *instanceSettings) backend.DataResponse {
    // Unmarshal the json into our queryModel
    var qm queryModel

    response := backend.DataResponse{}

    response.Error = json.Unmarshal(query.JSON, &qm)
    if response.Error != nil {
        return response
    }
  log.DefaultLogger.Info("Getting query information", "query", qm.QueryText, "host", qm.Host)
    // Log a warning if `Format` is empty.
vif qm.Format == "" {
        log.DefaultLogger.Warn("format is empty. defaulting to time series")
    }

    // create data frame response
    frame := data.NewFrame("response")
  iter := instSetting.session.Query(qm.QueryText).Iter()

  for _, c := range iter.Columns() {
    log.DefaultLogger.Info("Adding Column", "name", c.Name, "type", c.TypeInfo.Type().String())
    frame.Fields = append(frame.Fields,
        data.NewField(c.Name, nil, getTypeArray(c.TypeInfo.Type().String())),
    )
  }
  for {
      // New map each iteration
      row := make(map[string]interface{})
      if !iter.MapScan(row) {
         break
      }
      vals := make([]interface{}, len(iter.Columns()))
      for i, c := range iter.Columns() {
          vals[i] = toValue(row[c.Name], c.TypeInfo.Type().String())
      }
      frame.AppendRow(vals...)
  }
  if err := iter.Close(); err != nil {
      log.DefaultLogger.Warn(err.Error())
  }
    // add the frames to the response
    response.Frames = append(response.Frames, frame)

    return response
}
The CQL results are row based, while the DataFrame is column based.
You can see that we first loop over the columns and add each of the fields without values.
We then iterate over the CQL results and use the AppendRow method to add the information to the dataFrame.
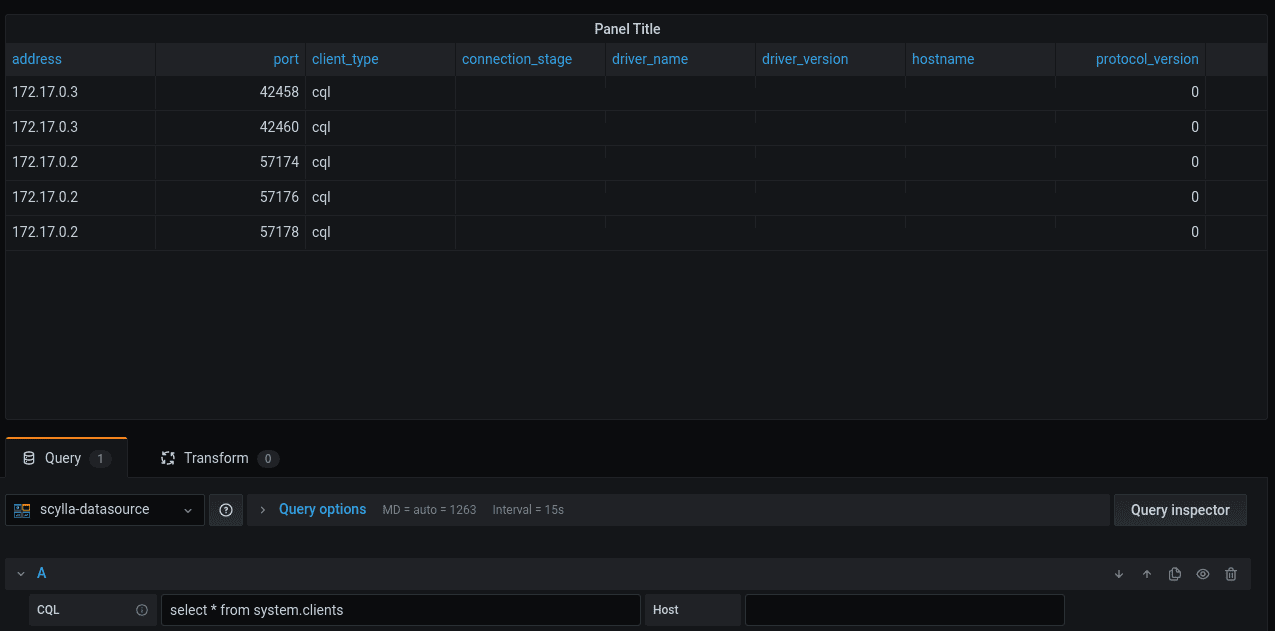
A working plugin
With all the pieces in place after compiling the code I have pointed the data source to a ScyllaDB node. This is what it looks like:
Getting the SecureData
As mentioned earlier, the data source configuration holds a Secure part that once set, is only available to the backend.
We are going to add an optional username/password for the database connection.
In sample-plugin.go we will modify newDataSourceInstance
You can get the secure part from the setting variables.
Here we check if a user and password were set, if they are, we use them to create a CQL authenticator.
    var secureData = setting.DecryptedSecureJSONData
    password, hasPassword := secureData["password"]
    user, hasUser := secureData["user"]
    var authenticator *gocql.PasswordAuthenticator = nil
    if hasPassword && hasUser {
        log.DefaultLogger.Info("Adding authenticator for user", "user", user)
        authenticator = &gocql.PasswordAuthenticator{
            Username: user,
            Password: password,
        }
    }
After the CQL cluster connection was created, if an authenticator was created we use it to authenticate the connection:
    if authenticator != nil {
        newCluster.Authenticator = *authenticator
    }
Summary and our next steps
We demonstrated building a Grafana data source with ScyllaDB as an example. Possible next steps we are planning:
- Pushing the new plugin to the Grafana plug-in repository
- Update the data source to provide time-series information
- Presented the time-series information as a graph
Your next steps
We’ve given you all the tools you need to try this yourself! If you run into any issues, make sure to bring them up with our user community in Slack.