When it comes to monitoring a distributed platform, there are many ways to go about it. There are many tools and programs used to accomplish different monitoring tasks ranging from the operating system or disk statistics to database performance metrics. What we found is that users need an all-in-one document that covers these topics so they can reference it later when needed without having to dig through multiple documents. Here at ScyllaDB, we wanted to make it easy for our users to monitor their deployment and created this nice cheat sheet that covers the commonly used ways to monitor a ScyllaDB cluster. This document will cover basic administrative monitoring commands and explain how to gather metrics from Prometheus and JMX via JConsole and the REST-API.
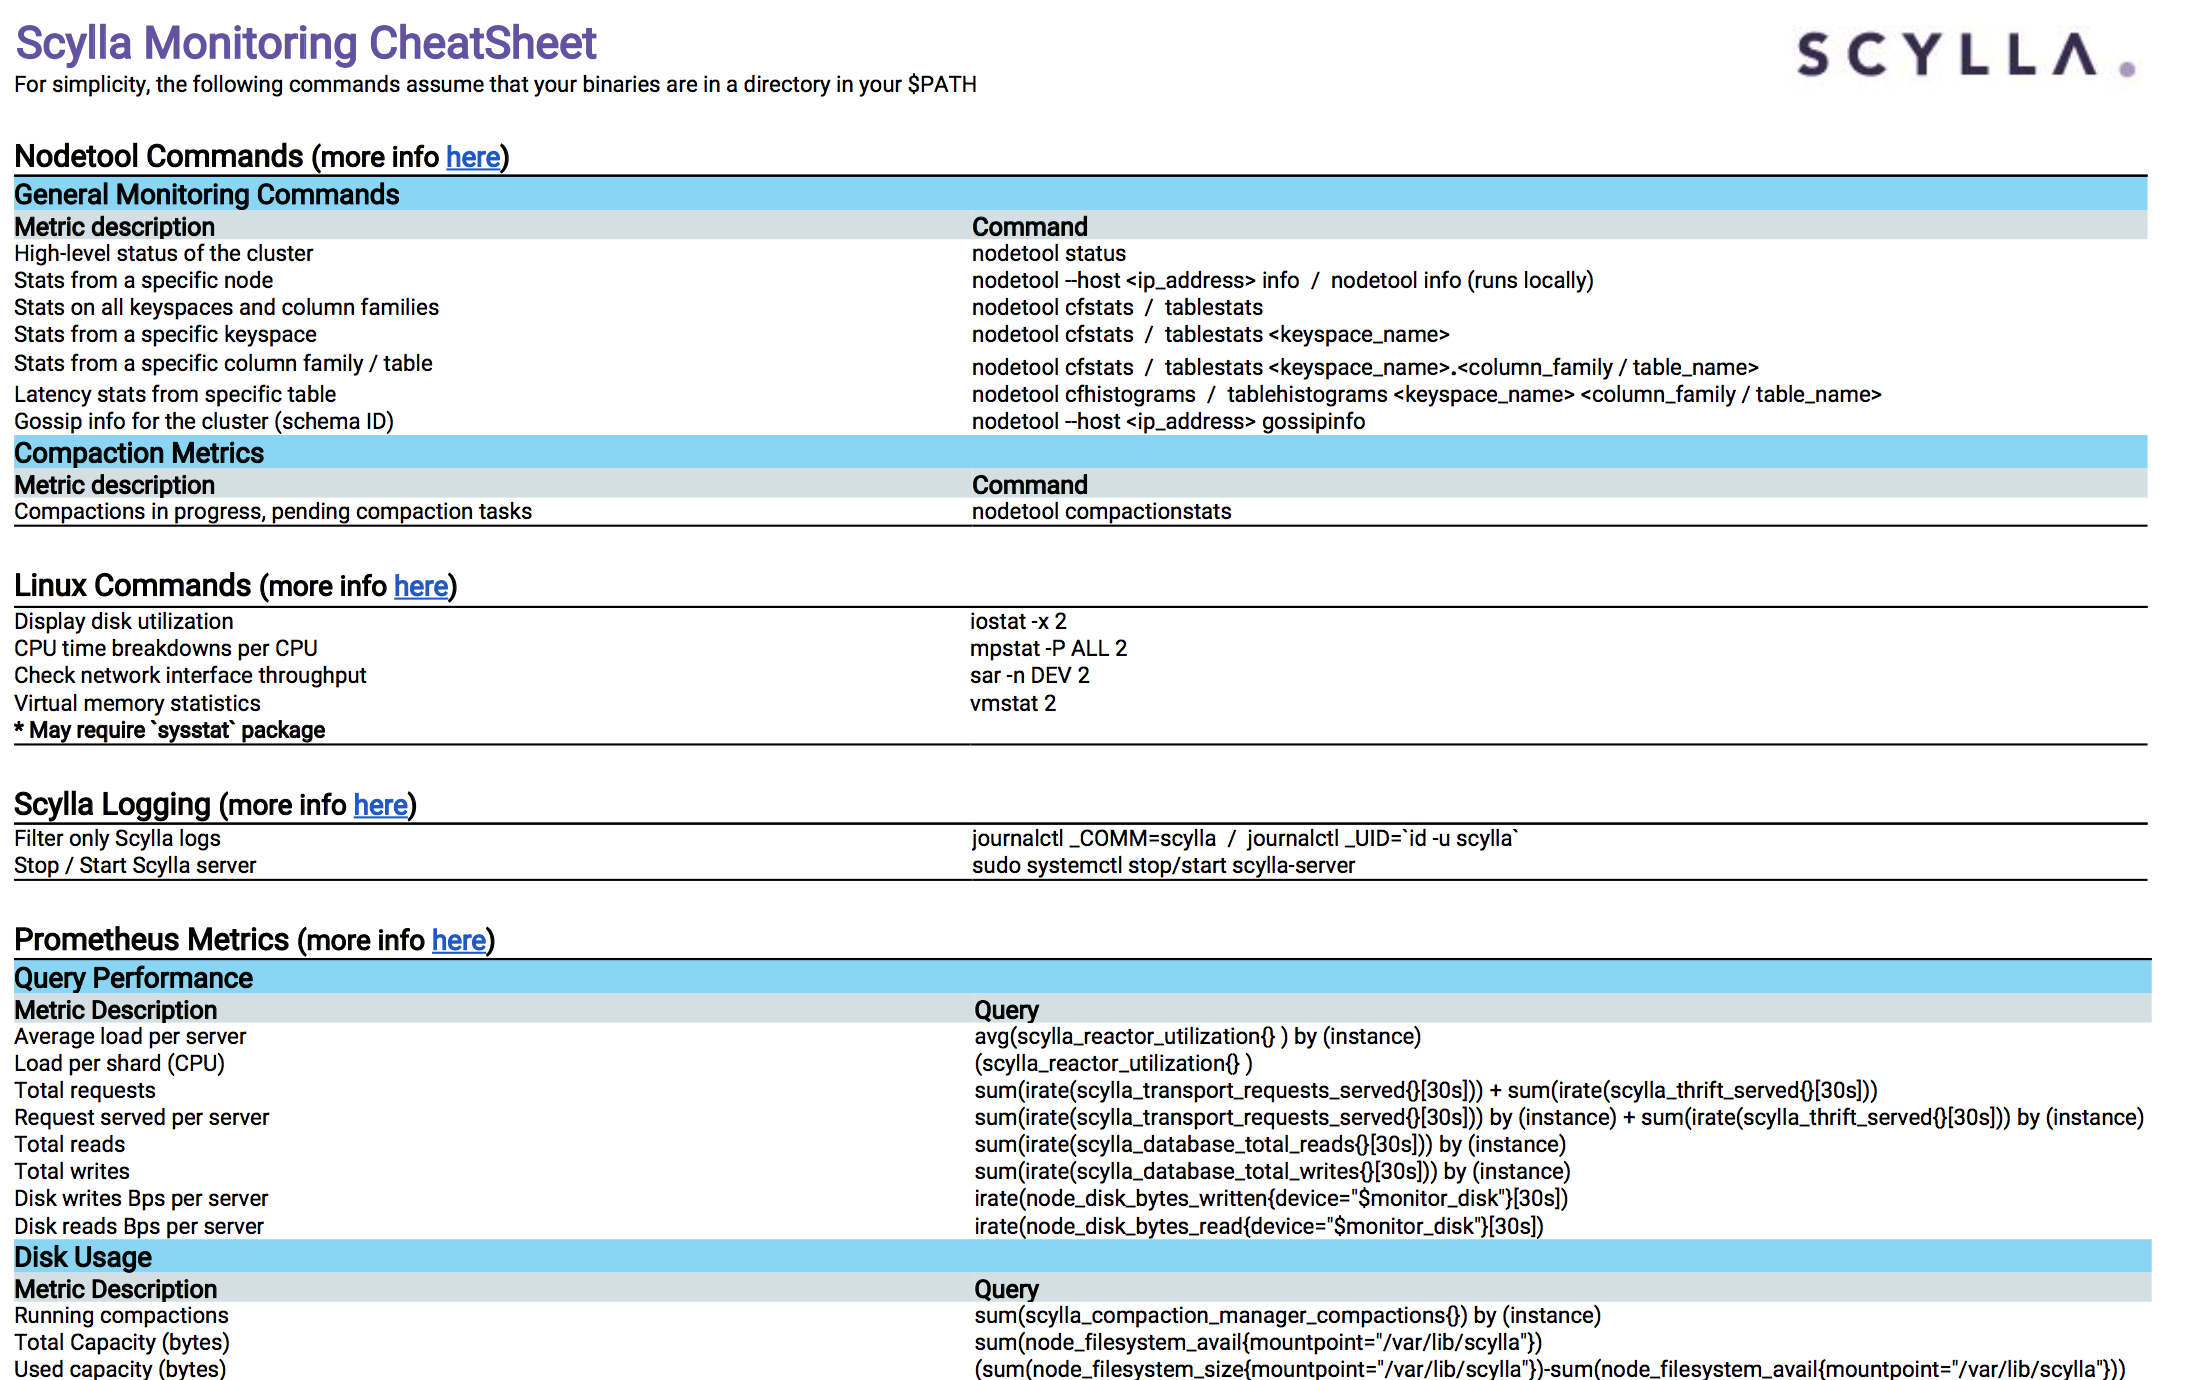
The cheat sheet is available for download here. We hope that it will help make monitoring your ScyllaDB deployment easier than ever.