Yahoo! Japan (YJ) just turned twenty three last month. Founded in April of 1996 the company remains the most influential internet brand in Japan. In December 2018, Yahoo! Japan edged out Google for top spot in the 2018 Nielsen Mobile NetView rating. Evolving with the times, YJ’s portfolio now spans mobile advertising, online stores, plus payment systems such as credit card transactions and mobile wallets. Over half of everyone in Japan, 67.4 million users, uses Yahoo! Japan at some point during the month, whether by PC or mobile device. And its advertising reach comprises 90% of the smartphone users in Japan.
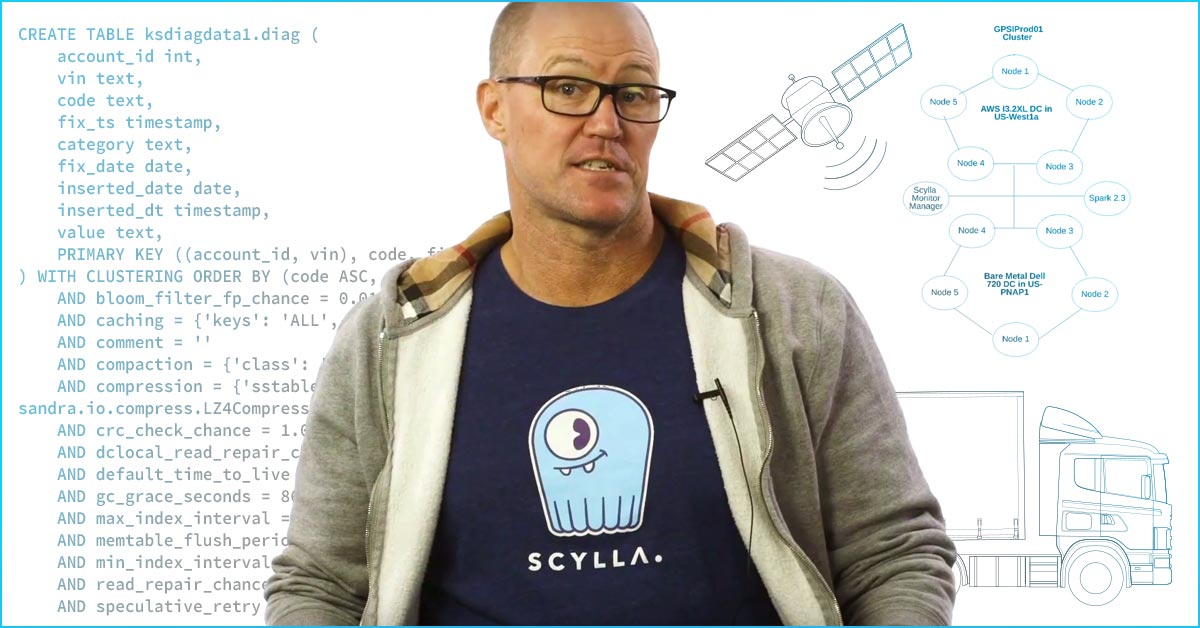
To run their data-oriented business, which encompasses hundreds of mobile apps and web services, Yahoo! Japan relies on a sweeping and heterogeneous architecture encompassing multiple various databases. Oracle and MySQL for SQL. Teradata and HBase for the Hadoop ecosystem. And for NoSQL, Cassandra and ScyllaDB, amongst others.
It is no surprise that such a technology-focused company with a huge user base employed Apache Cassandra early on. Cassandra (often referred to in shorthand by the notation “C*”) was adopted for use at Yahoo! Japan as early as 2010 deploying version 0.5; just as Cassandra exited its incubator status. Since then they have grown to over 4,000 nodes and 200 clusters across multiple project teams.
When you’ve made such a strategic choice for your technology, and it has served for such a long time within a company, there have to be compelling reasons to switch from it.
At ScyllaDB Summit 2018, Yahoo! Japan’s engineers Takahiro Iwase and Murukesh Mohanan took to the stage to describe their reasoning for testing ScyllaDB, a challenger, against Apache Cassandra, their in-house long-time NoSQL favorite. With Cassandra, as Takahiro said, “We have problems. Lots of problems. Cassandra uses the Java Virtual Machine. Java has GC [Garbage Collection] problems. Number one. Second problem: It is very hard to maintain too many nodes.”
Test Setup
Murukesh described their test setup. They used Docker on CentOS on OpenStack for the flexibility to alternatively deploy Cassandra, DataStax Enterprise and ScyllaDB. They used Prometheus, Grafana, and cassandra-stress to benchmark the databases against each other.
To begin their tests, they used spinning disks (Hard Disk Drives, or HDDs) to see if they were even worth moving ahead with them. On hard disk, ScyllaDB and Cassandra were “neck-and-neck when it came to performance. There was nothing to distinguish them at any level of stress.”
Then they moved on to 8-core, 8 GB RAM, 100 GB NVMe SSDs. “At that time, it looked like Cassandra would exhaust heap memory and crash frequently, so we switched to 16 core, 16 GB [RAM] units.”
The cassandra-stress profile had a very simple keyspace:
CREATE KEYSPACE pre07 WITH replication =
     {‘class’: ‘SimpleStrategy’, ‘replication_factor’: 3};
And the following table schema:
CREATE TABLE foo (
       column1 text, # 32 bytes
       column2 timeuuid,
       column3 text, # 1kb ~ 2kb
       PRIMARY KEY (column1, column2)
The only unusual thing was that the third column was fairly large, one to two kilobytes. They had originally tried with 10 kb – 20 kb, but, according to Murukesh, “that also caused weird behavior from Cassandra” so they dropped that data requirement down by an order of magnitude.
“For cassandra-stress, the simplest way is to run with a fixed ops count. Equal to, say, one million or one hundred thousand or whatever. But the thing is that ScyllaDB runs so much faster than Cassandra that it is very difficult to compare what’s going on with ScyllaDB and what’s going on with Cassandra. So we switched to using a fixed duration. Initially at three minutes. Later at 10 minutes and now thirteen minutes or so. And then later on we will be running for hours at a time.”
“These durations have better thread counts so say we’ll be running for ten minutes at a thread count of eight. And maybe a thread count of 24 and so on. So the entire test would take hours. Maybe eight hours or ten hours or so.”
Otherwise the test setup was pretty simple: a consistency level of one, truncate once, no warmup (so they’ll be using fresh data every time) and unlogged batches.
They chose multiple workloads to test:
- Case1: select /insert (2:1)
- Case2: select/insert/update/delete (4:1:1:1)
- Case3: select/insert/update (4:1:1)
For their presentation, the Yahoo! Japan team focused on results for the first two cases, but said the conclusions applied to the other cases as well.
Yahoo! Japan’s Results
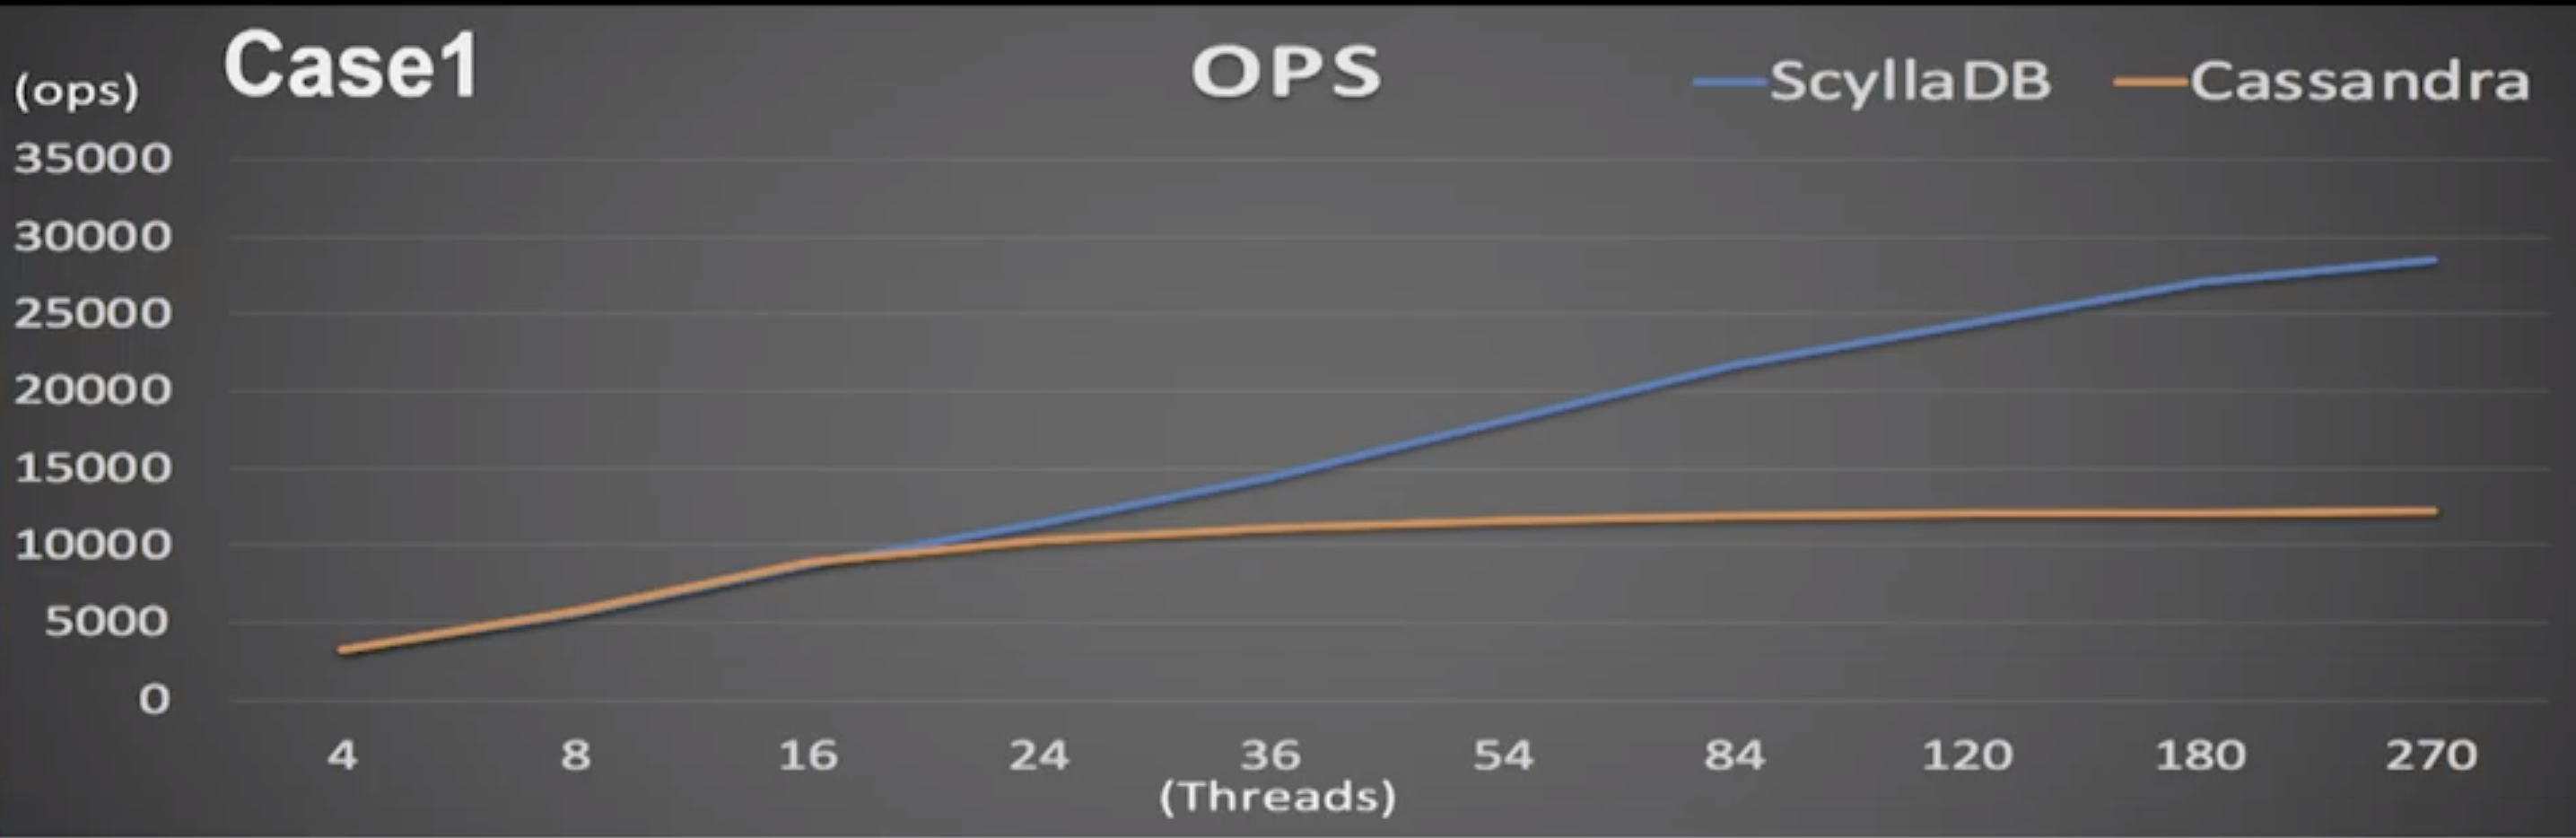
For the select/insert test operation up until 16 threads Cassandra and ScyllaDB performance matched pretty evenly. Beyond that point, however, Murukesh explained, “as the thread counts increase ScyllaDB vastly outperforms Cassandra.” His graph showed Cassandra and ScyllaDB grew linearly up to 16 nodes. Then Cassandra performance plateaued around 11,000 ops. Thereafter, “ScyllaDB sort of takes off and Cassandra is just flat.” Even increasing the node count to 260 saw only the most marginal gains for Cassandra. ScyllaDB with 260 threads approached 30,000 ops.
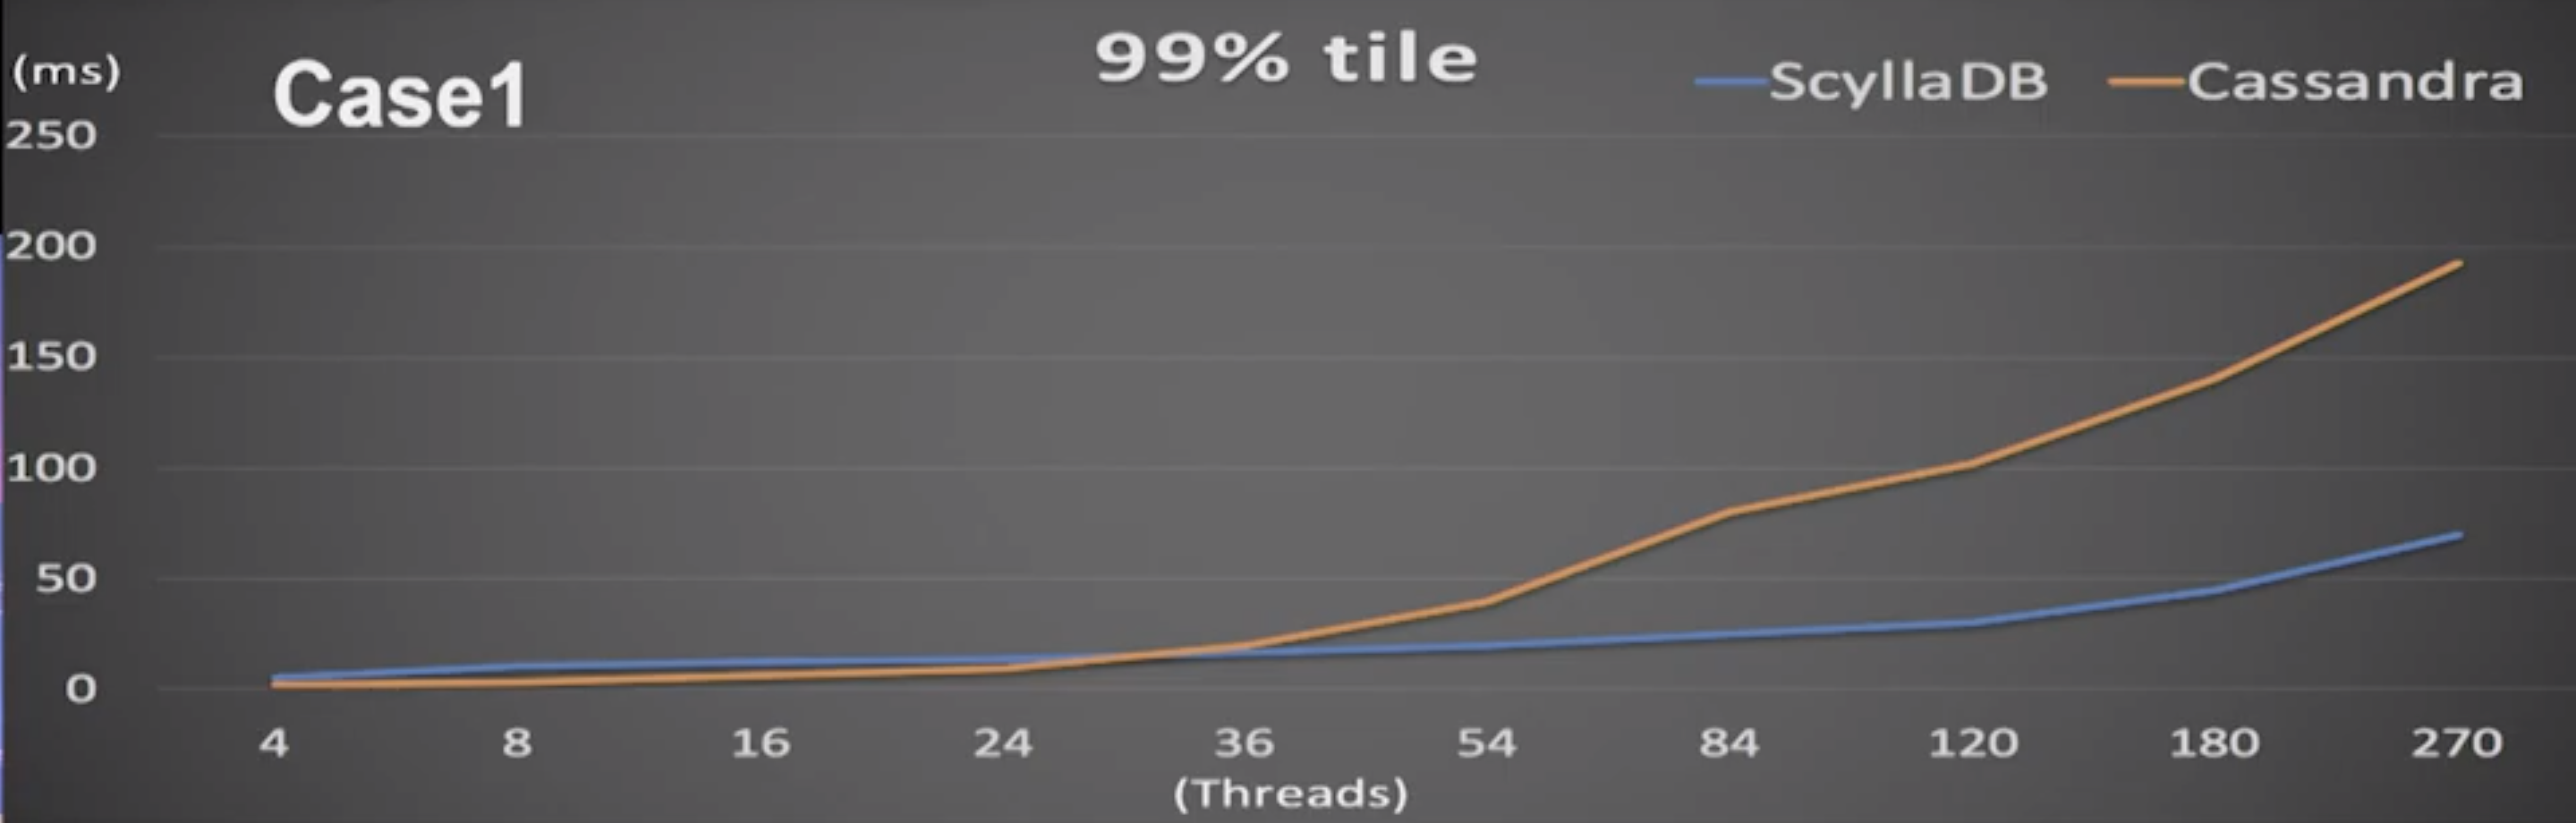
P99 latencies showed a similar trend. (In the following graphic, keep in mind that lower latency is better). Cassandra was even nominally better than ScyllaDB at a low thread count. But once the test scaled to 36 threads or more, Cassandra latencies started to deteriorate at a far greater rate.
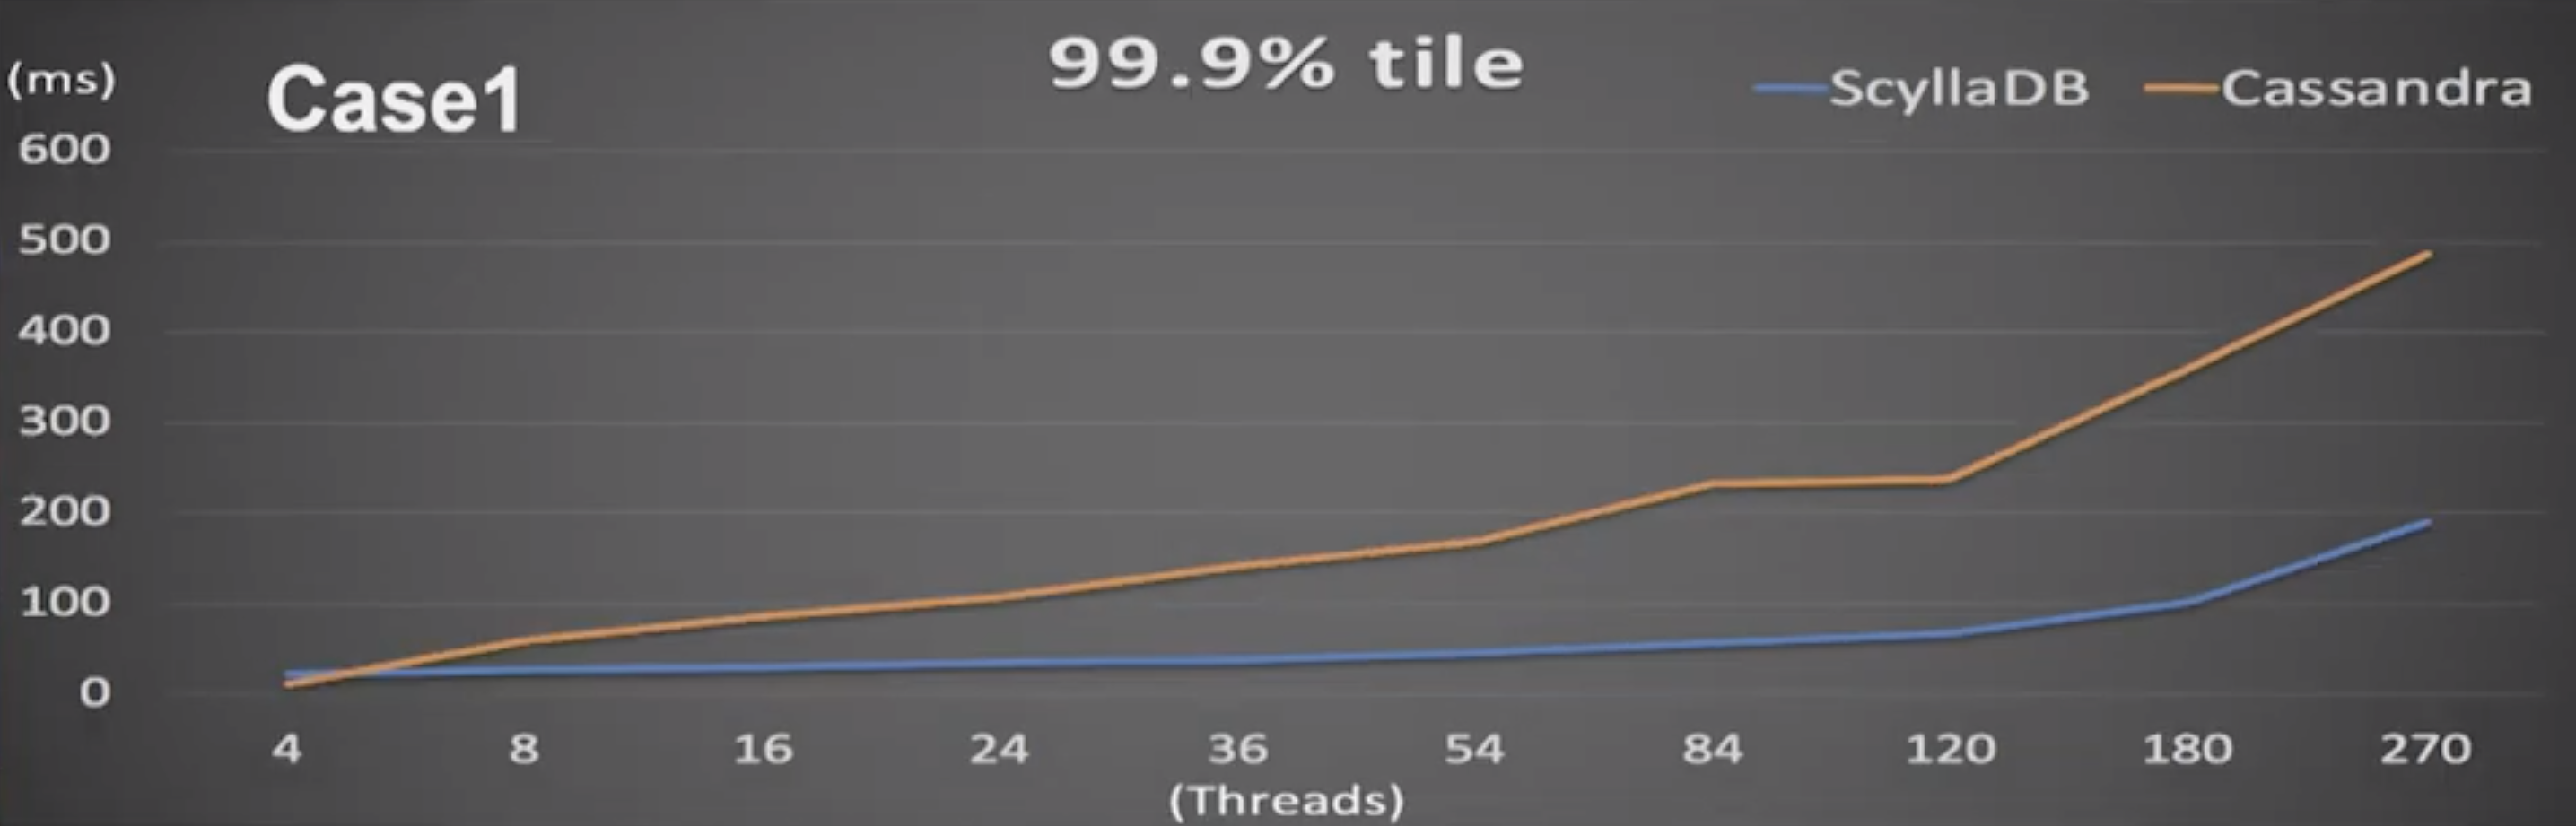
At p999 latencies the difference was even more pronounced. Here even with relatively low thread counts ScyllaDB’s latency remained rather low, whereas Apache Cassandra deteriorated steadily. By the time ScyllaDB’s p999s rose to about 100 ms (around 180 threads), Cassandra’s latencies were around 350 ms. “After a while it’s just sad. I mean, there’s no comparison here.”
ScyllaDB could handle 100 threads with the same latency as Cassandra only using eight threads.
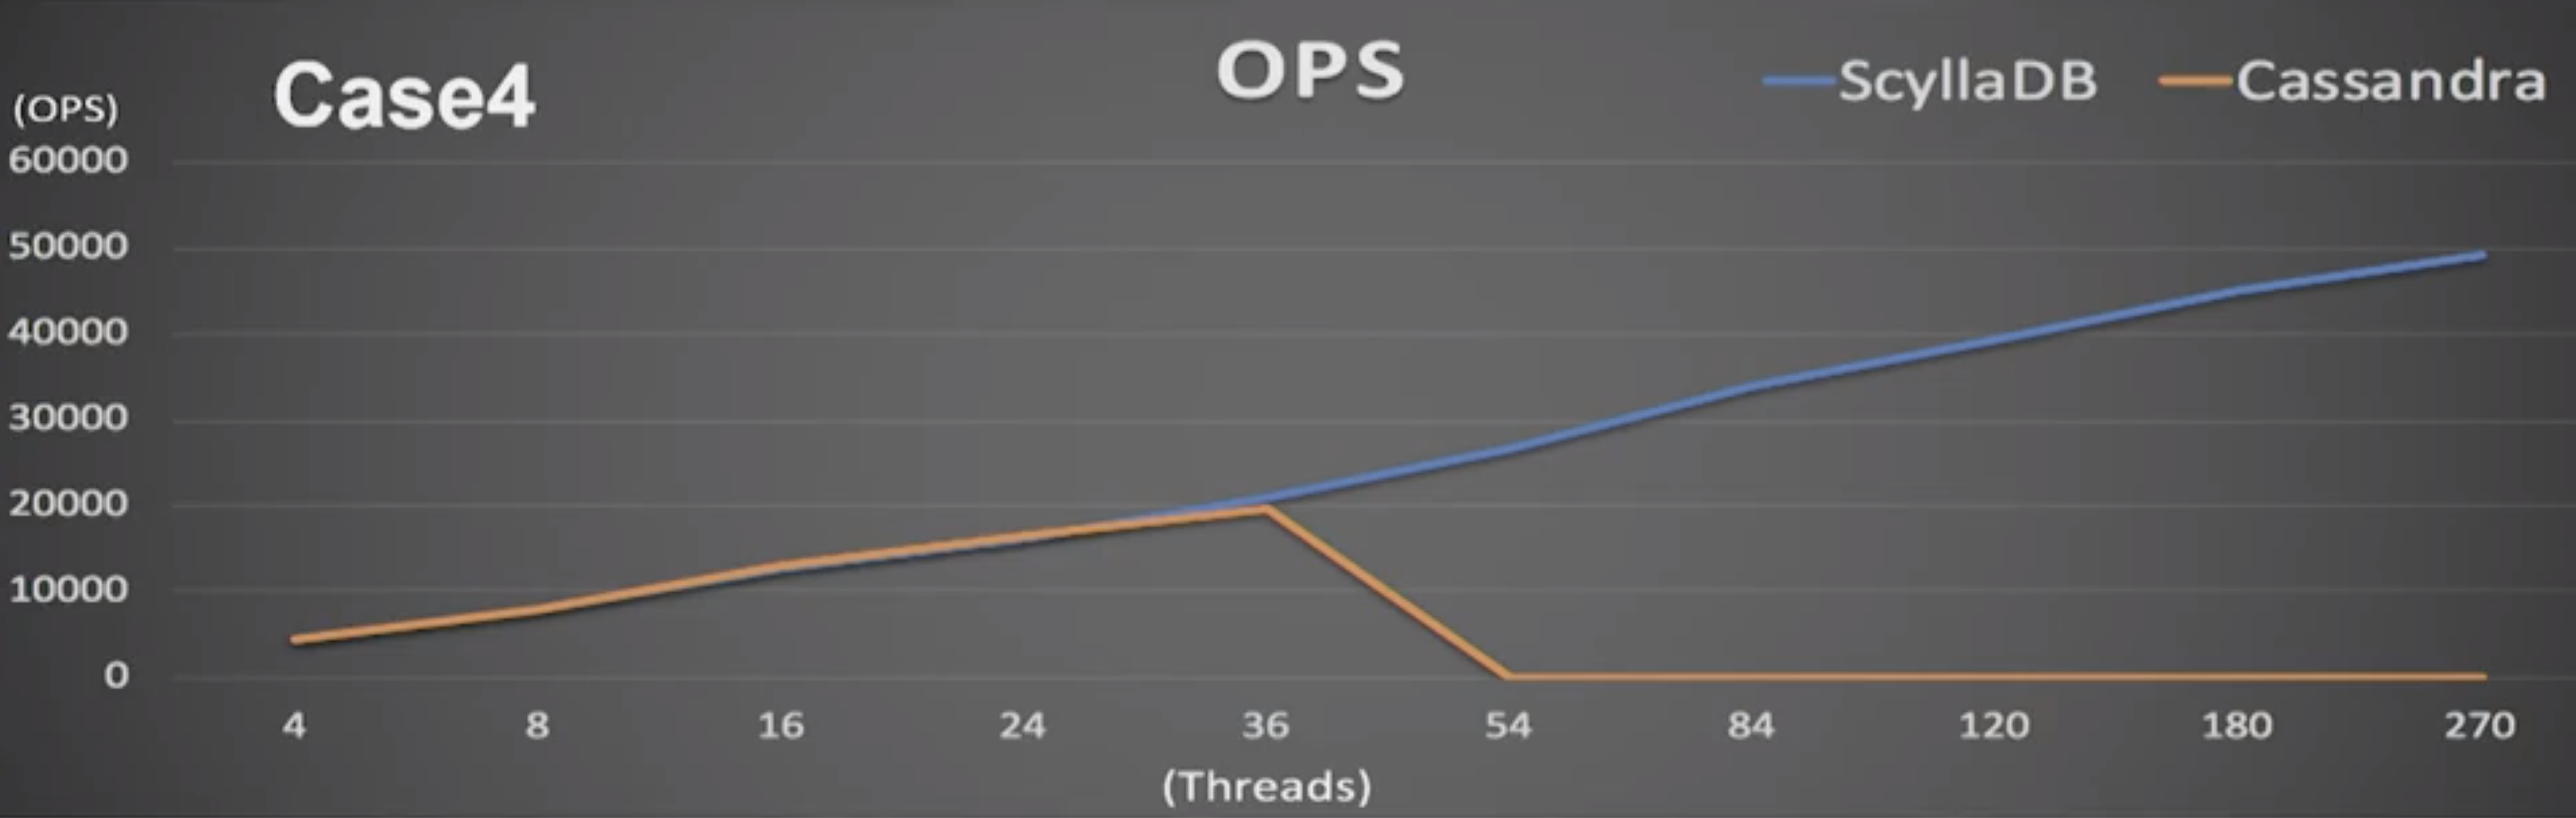
Under other loads Cassandra fared even worse. In this case, of CRUD operations, Cassandra performed as well as ScyllaDB up until both reached 36 threads. “Here we can see the biggest, well, difference. After about 36 threads Cassandra frequently hung up. It didn’t crash. The Cassandra servers were running. Nodetool status would respond. But cassandra-stress wouldn’t get any response. So there are no results after 54 thread counts. But ScyllaDB? Smooth as ever.”
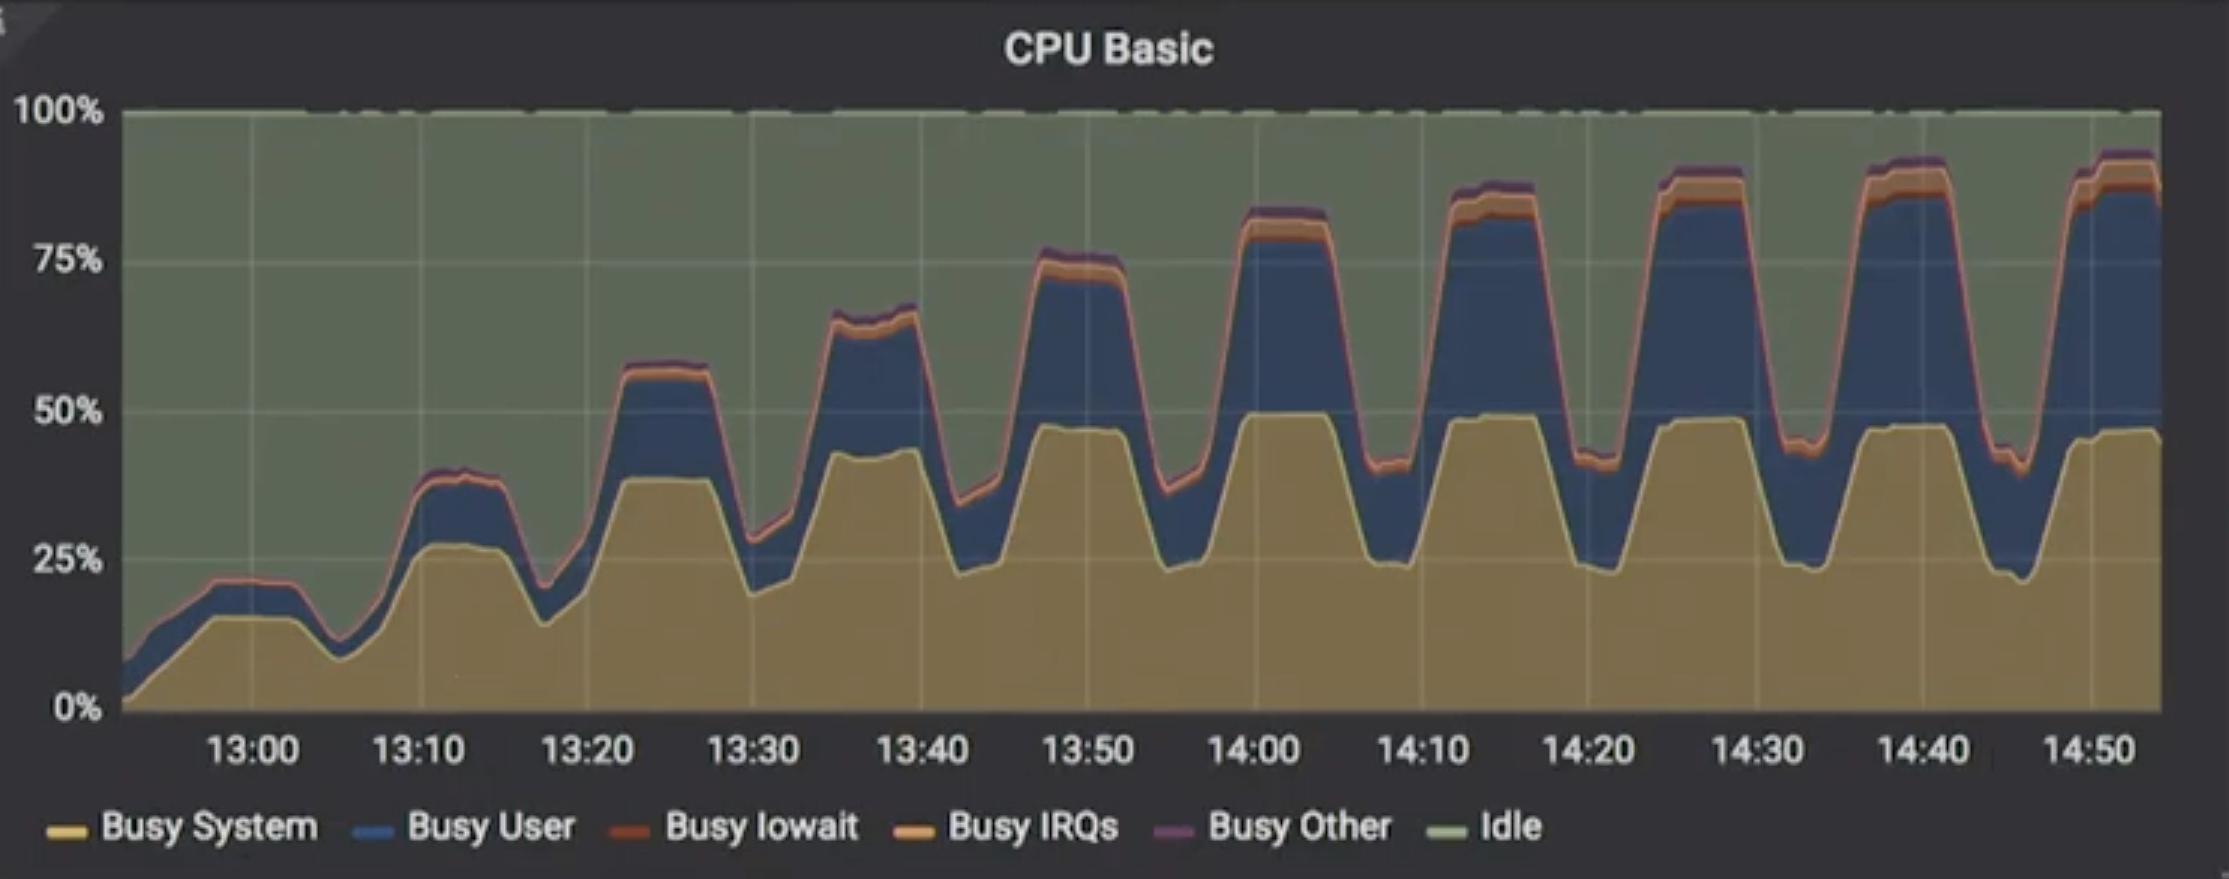
Speaking about resource utilization, Cassandra never utilized even 50% of its available resources and plateaued more often at levels between 25% – 40%.
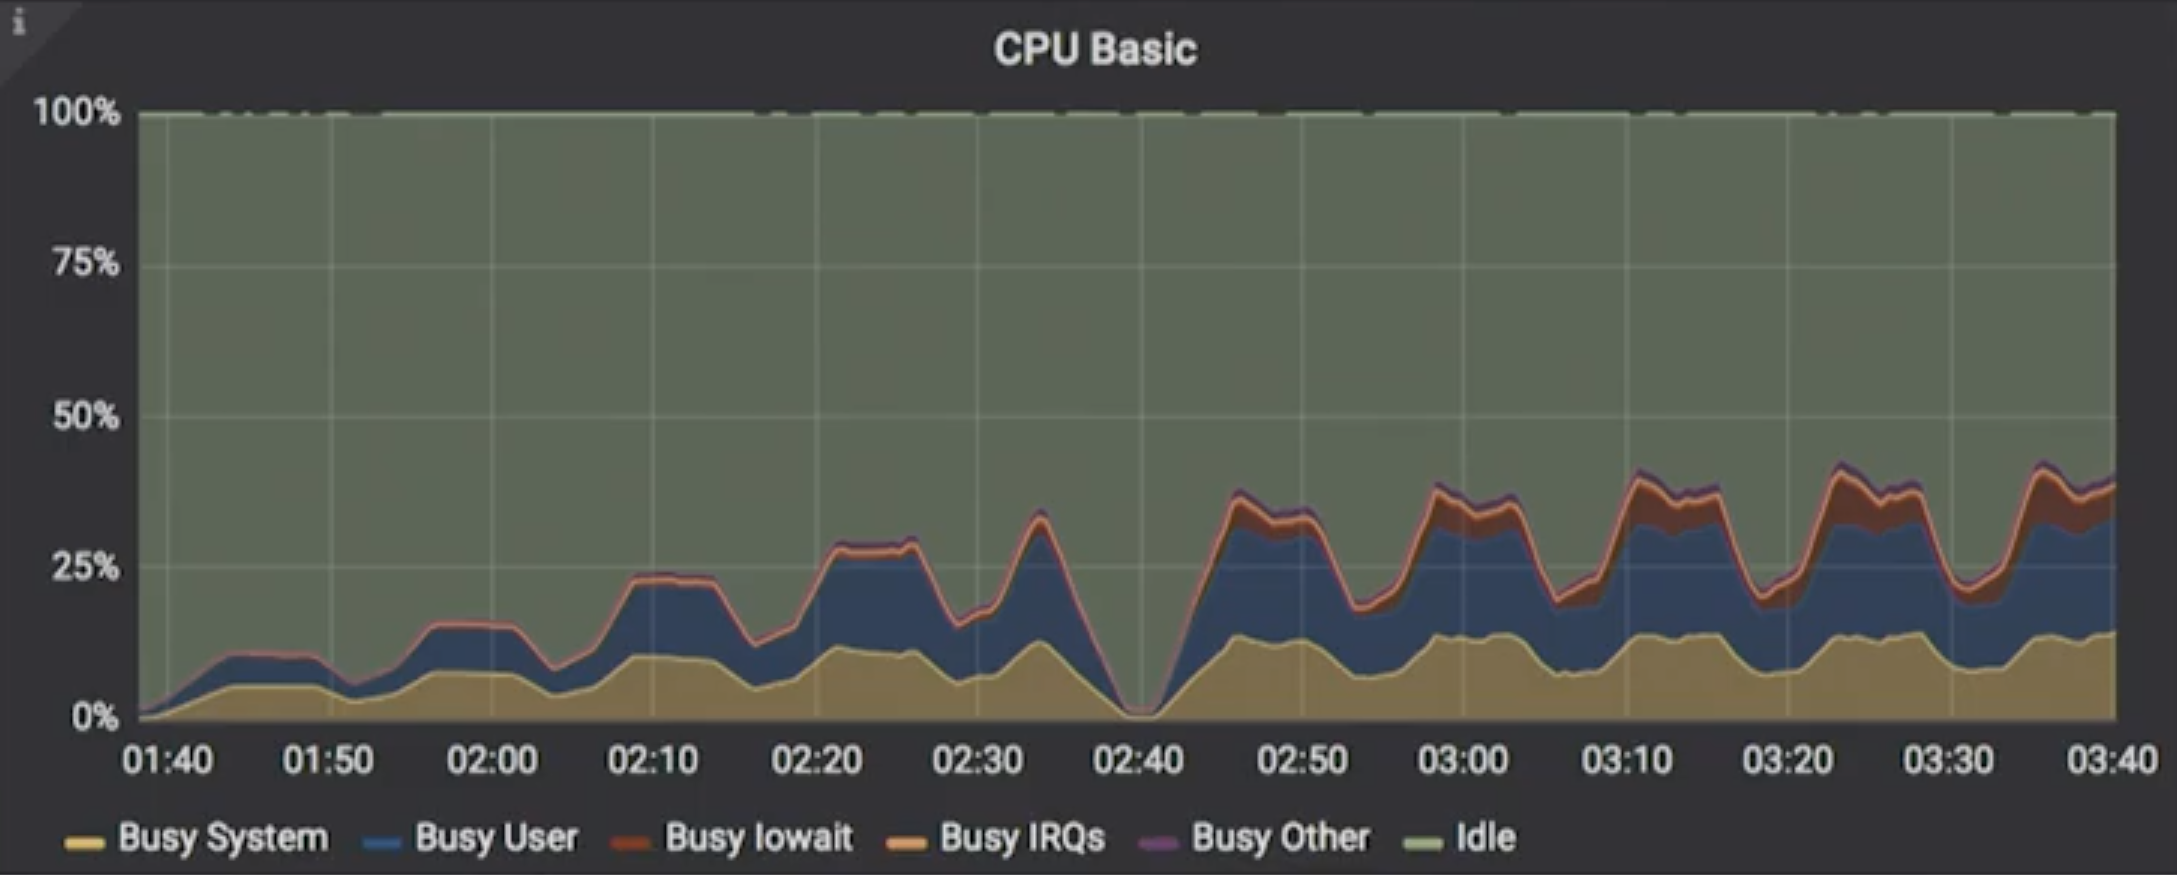
The same chart for ScyllaDB shows that under load it was able to utilize far more of the resources available, approaching closer to 100%. Murukesh also pointed out that, after about sixteen threads, ScyllaDB’s system utilization capitated (around 50% of system resources), after which userspace apps (like ScyllaDB) took over the rest of the CPU.
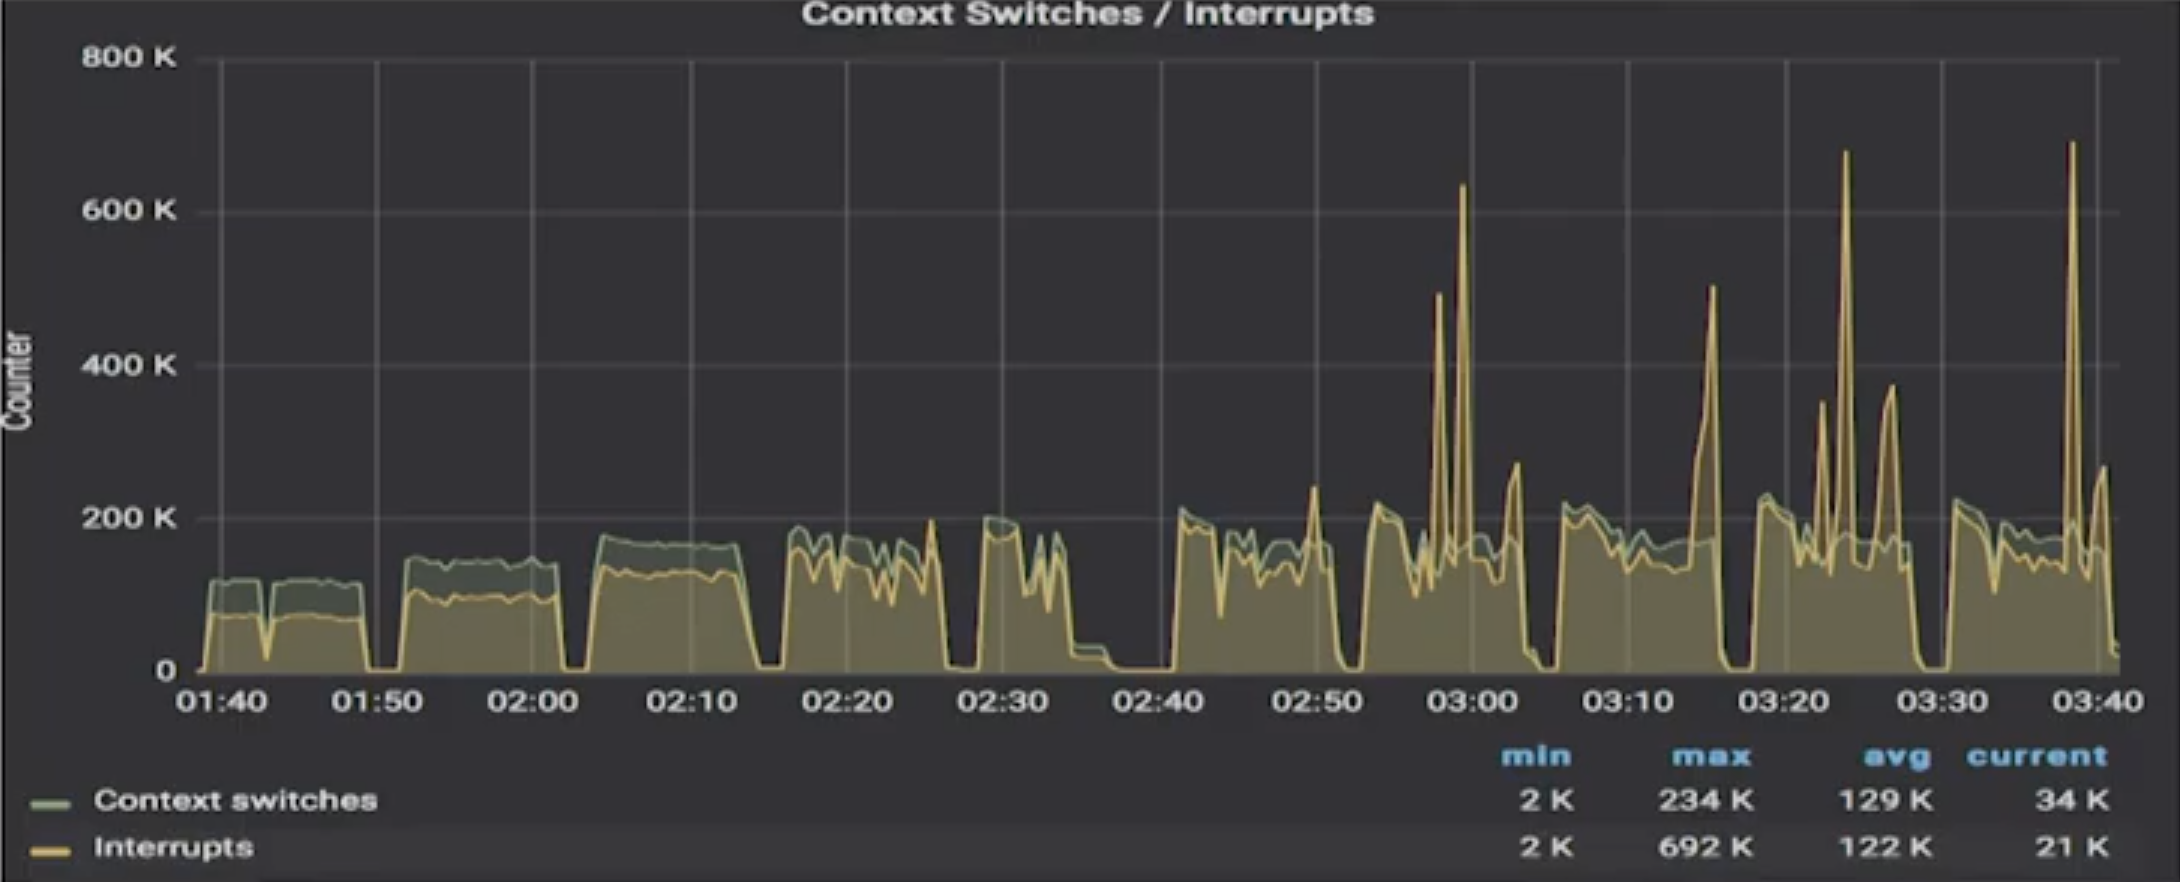
Murukesh then paused as he introduced the next slide. “The odd thing is here when it comes to context switches: initially it looks like Cassandra has a lower level.” He first showed the chart for Cassandra:
Then ScyllaDB results:
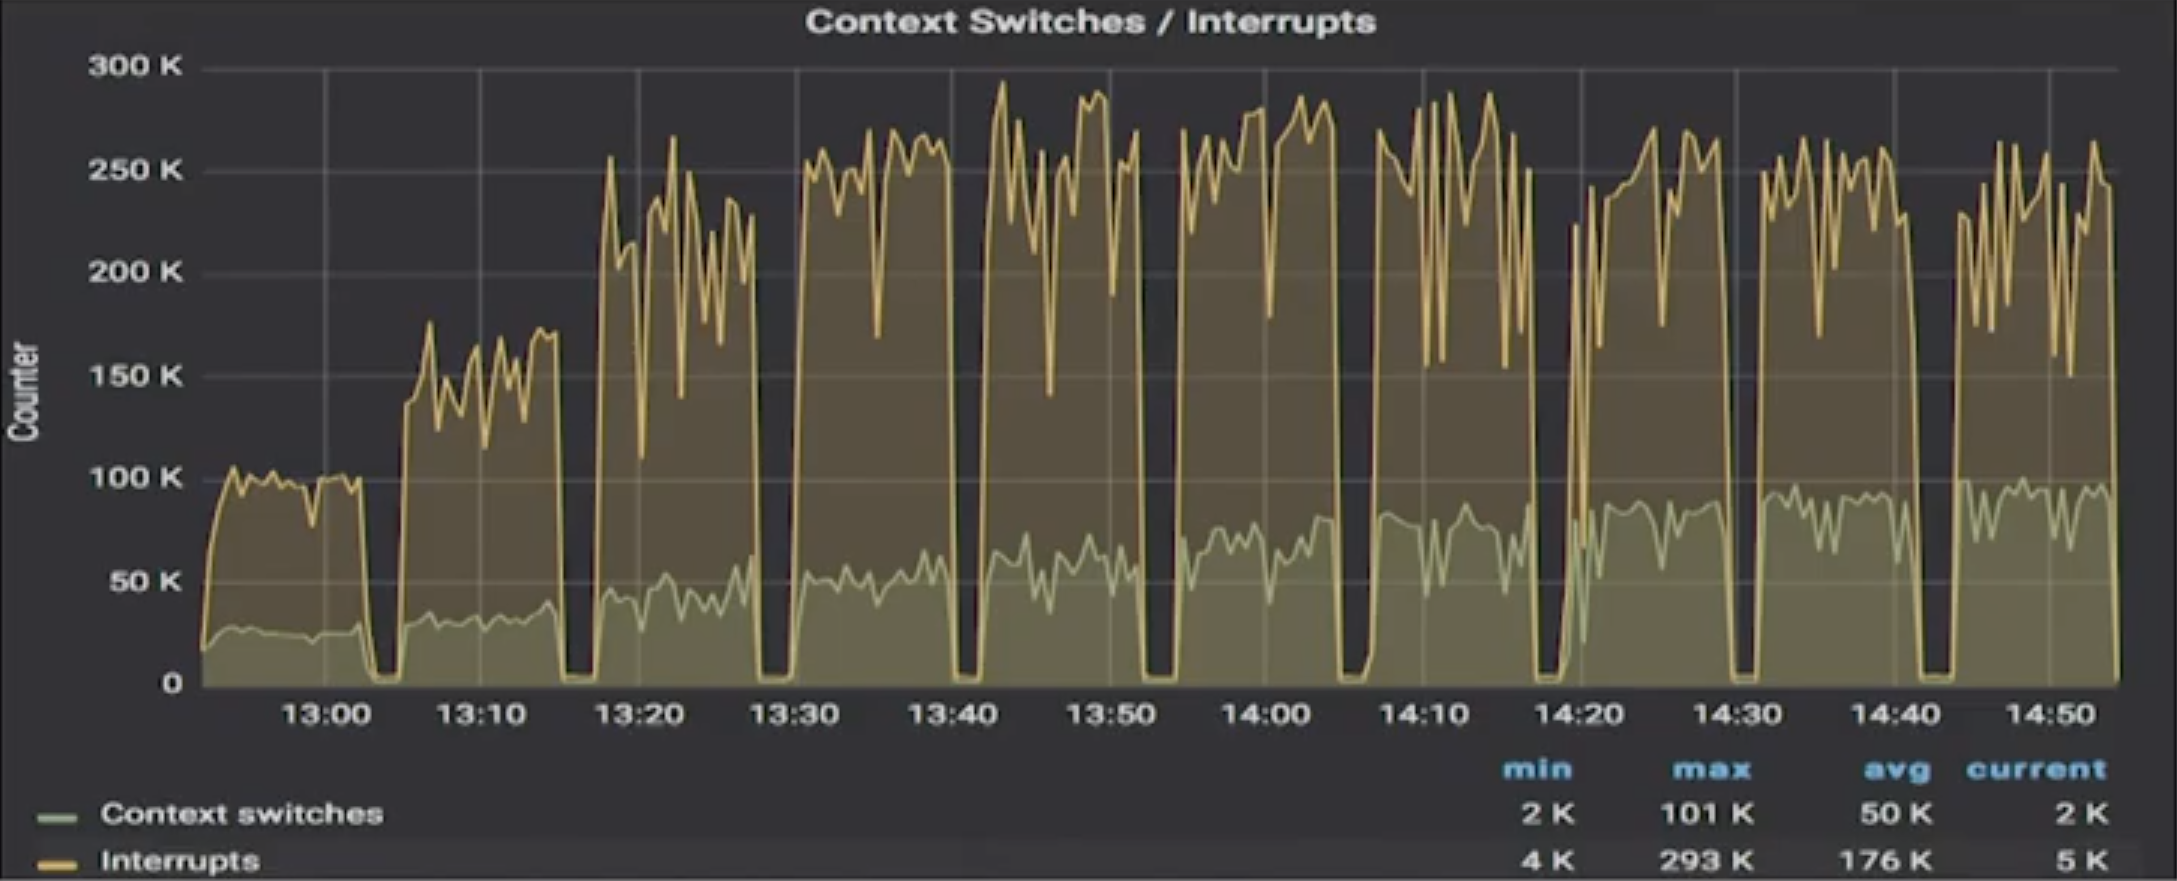
And he noted the scales. For ScyllaDB the chart was 300k max. For Cassandra it was at times spiking past 600k, almost 700k max.
Murukesh continued, “initially Cassandra is fairly smooth, but again, you can see it thrash happen at a particular thread count. After that you can see there are wild jumps in context switches and that sort of thing may affect your jitter.” ScyllaDB, on the other hand, is fairly smooth. There are no huge jumps.
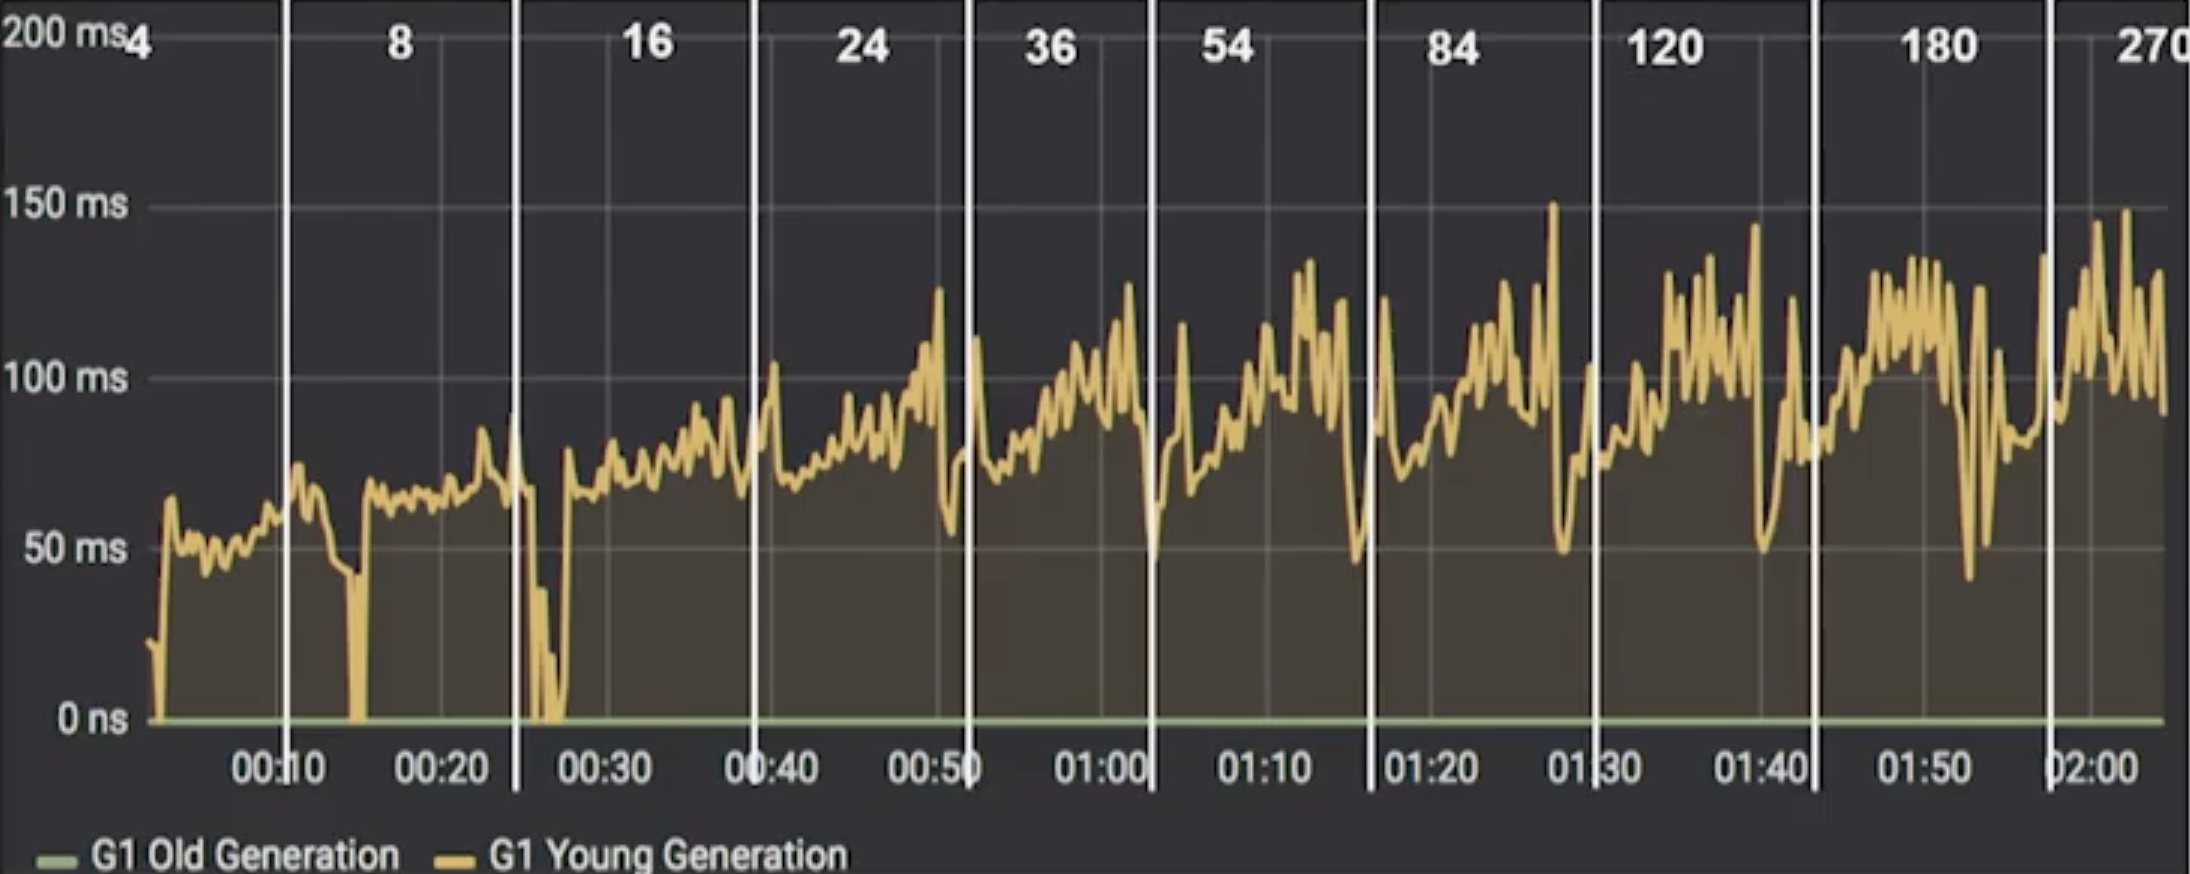
He then went on to Garbage Collection (GC) heap size. Cassandra had been assigned 8 GB of heap size for this. “Cassandra’s heap utilization was fairly normal, I believe here. But again, [utilization was] not as much as it could have been.”
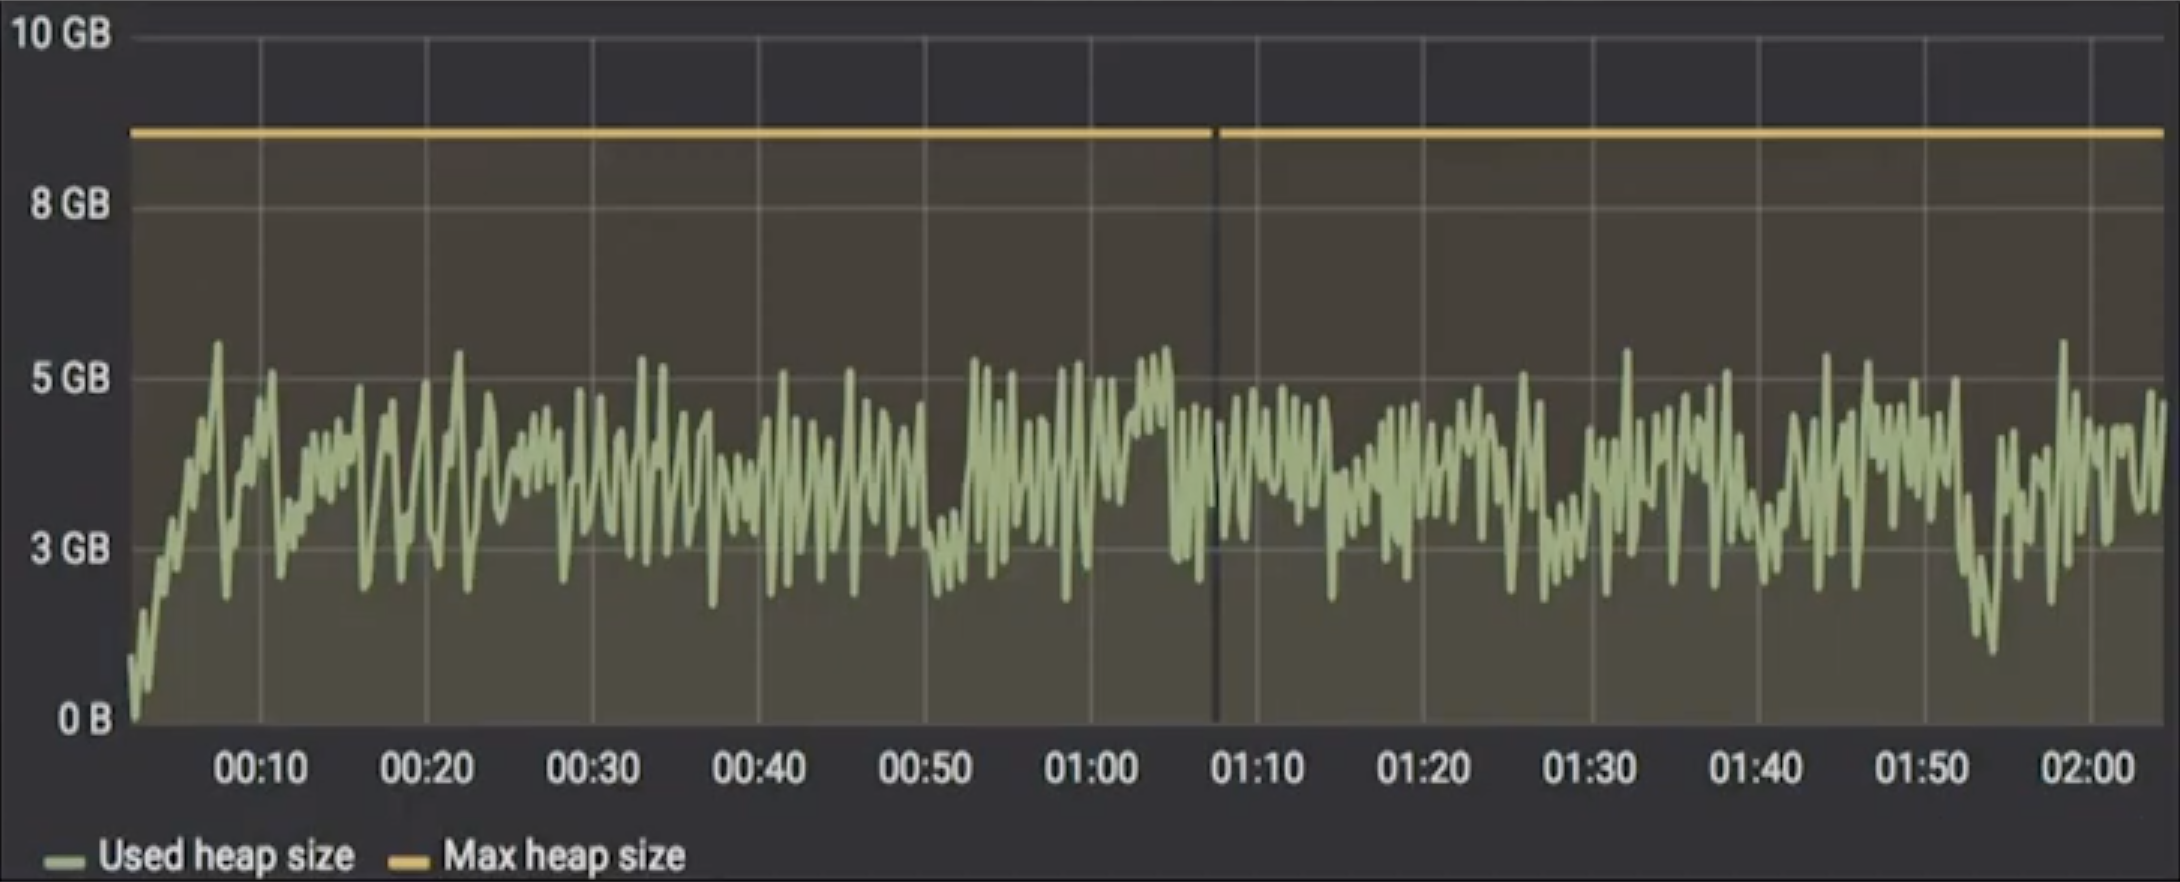
Murukesh then brought up the perennial complaint: “GC time is a major problem in Cassandra. GC times start to swing wildly with increasing load. So that’s more time wasted there. Yet another headache.”
Takeaways
ScyllaDB had clear performance advantages over Cassandra — about 2x to 3x. ScyllaDB had better latency, too. He compared his results to ScyllaDB’s own claims of 10x performance improvements. He believes a major reason behind this was his Docker installation. Because a script that needs to run to optimize performance was not possible within the Docker image. This was something he wanted to try to find a work-around for and test again.
Also it was more stable. “Cassandra crashed repeatedly at various operations, various layers of stress. ScyllaDB barely ever crashed.”
To this he did observe a few operational issues, and provided the answer, too: “Where ScyllaDB never crashed, it occasionally had a hiccup in that starting the cluster might take a while.” He discovered the answer to this at an earlier session at ScyllaDB Summit 2018 where it was said you should not try to add more than one node to ScyllaDB at a time. “And that’s what I was trying. I was just adding all the nodes at the same time.”
While he had those mild criticisms for ScyllaDB, he gave his frank assessment of the competition: “Whereas Cassandra was not able to take use of the available resources. I mean, half the CPU’s underutilized. The memory is just lying there without, you know, the JVM reaching that level. ScyllaDB is taking whatever it can. And then just running ahead with it.”
In terms of stability, “WIth Cassandra, one of the major problems behind crashing was probably the garbage collection algorithm.” With their initial JVM “crashes happened earlier and often.” Once they switched out the JVM it was much better. He suggested those operating Cassandra to look into their JVMs.
Murukesh noted that Cassandra has a lot of tuneables when it comes to the JVM. ScyllaDB on the other hand? Not so much. But again, he observed, having a lot of tuneables was a double-edged sword. “Every time you tune something there are first degree, second degree, and third degree network effects that you have to worry about. You never know which particular tunable might adversely effect some other.” All of these tweeks can cause problems later on. “Personally I hate tunables. I just want the thing to run without any babysitting at all.”
You can watch Yahoo! Japan’s whole presentation (and see his slides) from ScyllaDB Summit 2018 in our Tech Talks section. And if you enjoy these in-depth technical insights from Yahoo! Japan, as well as other NoSQL industry leaders, this is also a good reminder that registration is now open for ScyllaDB Summit 2019.