At ScyllaDB, we love Grafana and use it a lot. However, if you are familiar with Grafana, then you are probably familiar with issues when you want to create a dashboard in Grafana. For example, we find adding a new dashboard, row, or panel from the GUI is a breeze. But since we maintain our dashboards as files (sorry DB users, we like Git and commit messages) things can get messy.
Say you have this huge file that describes a dashboard and you want to do some minor change in it like duplicate a panel with a different metric. You will need to find your way through chunks of JSON parts, figure out what panel that you are looking for, and hopefully copy it to the right place after you remember to change things like id. If you have ever practiced the dark art of Copy-Paste-HTML creation, you know the feeling.
But proper HTML has CSS files, which not only hide your styling mess – CSS files hide it in a hierarchical way. Since CSS classes share attributes, it is easier to change styling throughout your document.
Sounds good, right? So we took these principles of splitting repeated and redundant styling from the main logic in a hierarchical way and used them for our Grafana dashboards.
Before going into the details, here is what we achieved:
- File size (lines and bytes) are about 30% of their original size
- Changes are easier to maintain and track
- Copying panels and rows between dashboards is much easier as all the styles and ids are no longer in those objects
So this panel:
Became this:
So how did we do it?
- We added a ‘class’ attribute to the different components (luckily Grafana just ignores it)
- We added a type definition file that defines those classes (similar to a CSS in HTML)
- We created a Python program called make_dashboards.py that merges it all.

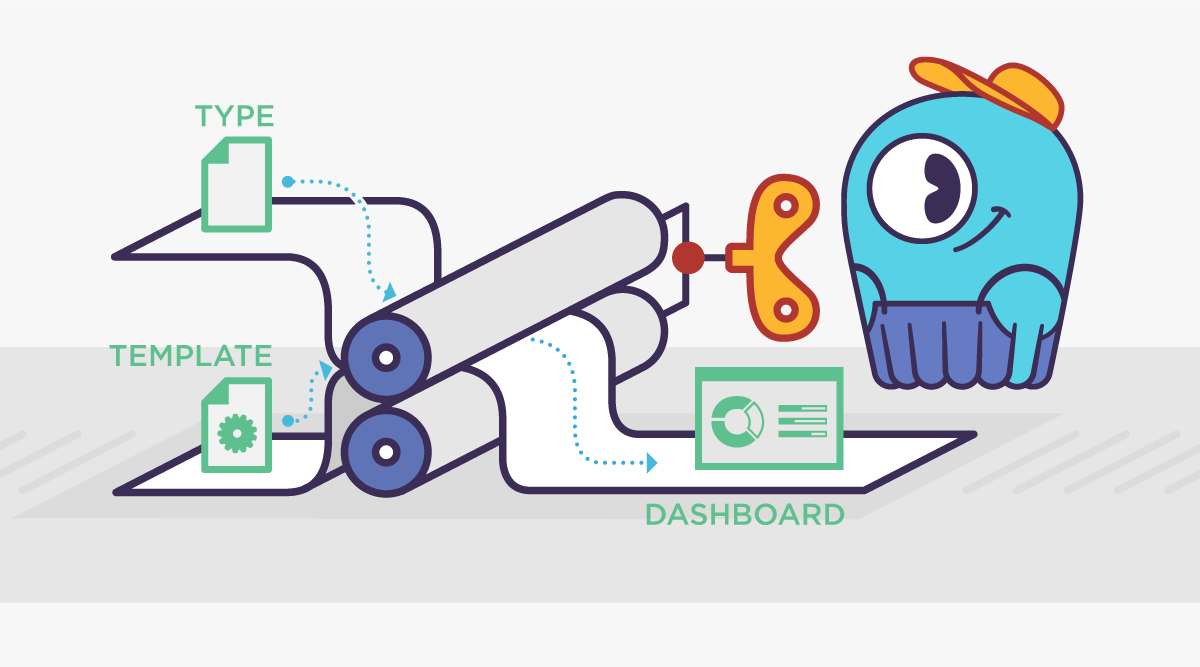
make_dashboards takes a type JSON file and a template file and merges them into a single file.
How does it work?
make_dashboards reads the template file and if a JSON object has a class attribute, it finds it in the type definitions. Please note that a class can inherit from other classes, so a full merge is done first.
The combined type acts as the base for the object and the attributes from the template are added or override the base attributes.
It’s time for an example, so let us look at how ‘row’ is defined and used.
In the types.json file, rows are defined as shown below:
That’s because we have other kinds of rows such as for headers or the small one with our logo.
In the template we have:
The dashboard will look like:
When the script read the template and saw the “row” class, it used the types to decide what ‘row’ is by combining ‘base_row’ and ‘row’. It then added the ‘panels’ attribute and overridden the ‘height’ attribute.
Some final notes
- If you already have your dashboards and want to move to templated dashboards, the script has a reverse option that can help you do that.
- JSON object without a class attribute will simply be copied, so you can use a mixture of templates and regular dashboard objects.
Going forward
It would be nice to push the template mechanism inside Grafana. When the minor issues with scripted dashboards are solved, we may do that. We’re thinking about other representations for the templates, yaml anyone?.
If you are a ScyllaDB user, we hope you use our monitoring project. You can find out more about adding dashboards here.


