The ScyllaDB team is pleased to announce the release of ScyllaDB Manager 1.1, a production-ready release of ScyllaDB Manager for ScyllaDB Enterprise customers.
ScyllaDB Manager adds centralized cluster administration and recurrent task automation to ScyllaDB Enterprise. ScyllaDB Manager 1.x includes automation of periodic repair, with future releases providing rolling upgrades, recurrent backup, and more. With time, ScyllaDB Manager will become the focal point of ScyllaDB Enterprise cluster management, including a GUI frontend. ScyllaDB Manager is available for all ScyllaDB Enterprise customers. It can also be downloaded from scylladb.com for a 30-day trial.
Related links
- Get started with ScyllaDB Manager
- Using sctool, ScyllaDB Manager CLI tool
- Download ScyllaDB Manager – for customers only, or for limited evaluation
- Upgrade ScyllaDB Manager 1.0 to 1.1
- Report issues with ScyllaDB Manager using the ScyllaDB Enterprise support channels
New features in ScyllaDB Manager 1.1
ScyllaDB Manager Metrics, Dashboard, and Alerts
ScyllaDB Manager now reports metrics over the Prometheus protocol. You can use ScyllaDB Manager metrics directly or with the ScyllaDB Manager dashboard from the ScyllaDB Monitoring Stack.
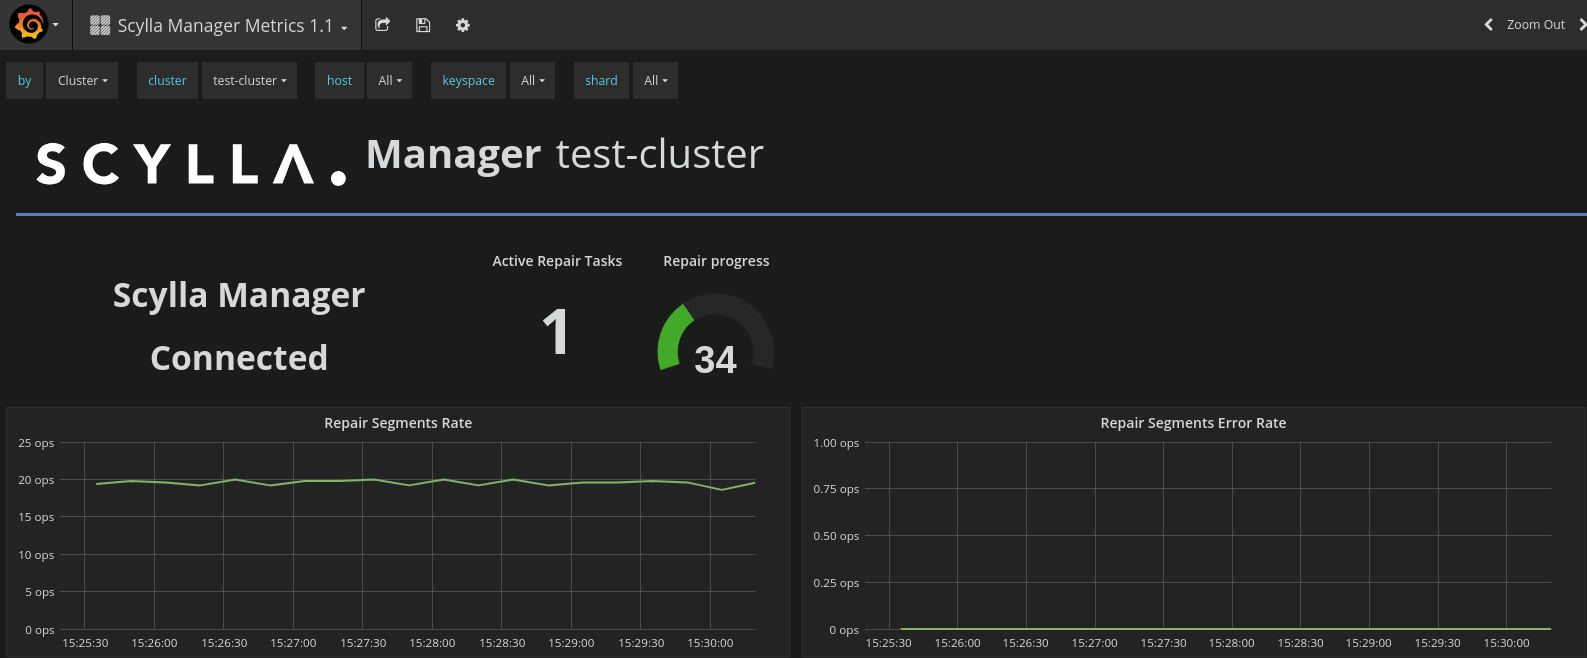
With the latest addition of alerts to the ScyllaDB Monitoring Stack, an alert will be triggered in case a repair has failed, or if ScyllaDB Manager exits for any reason. More on Alerts here.
Full List of ScyllaDB Manager metrics:
| Parameter | Description |
| cluster | Cluster unique identification (string) |
| host | Host IP address |
| shard | Shard (core) number |
| unit | Repair Unit |
| quantile | Histograms quantile |
| Metric | Type | Description |
| repair_duration_seconds | summary | repair_duration_seconds. The time repair has been running in seconds. |
| repair_segments_success | gauge | Number of repaired segment |
| repair_segments_error | gauge | Number of segments that failed to repair |
| repair_segments_total | gauge | Total number of segments to repair. Where repair_segments_error + repair_segments_success = repair_segments_total |
| ssh_open_streams_count | gauge | Number of active (multiplexed) connections to ScyllaDB node. |
| log_error_total counter | counter | Total number of ERROR messages |
| log_info_total counter | counter | Total number of INFO messages |
Repair Retries
Starting from ScyllaDB Manager 1.1, during a repair, should a segment fail for any reason, ScyllaDB Manager skips the segment and continues until all segments have been repaired. It will then go back to the skipped segments and try to repair it a second time. Each repair attempt is considered a retry. The number of retries is configurable in the scylla-manager.yaml (see below)
You can follow the progress of retries using the sctool repair progress command or Grafana Manager dashboard.
Repair Configuration
The following new configuration parameters are now available:
sctool updates
- New date format across the tool. The new format contains TZ (UTC) info and is easier to read ie. 13 Apr 18 00:00 UTC
- Start/End/Duration info in the repair progress command
- Task list can be used without a cluster argument to see tasks on all the clusters
REST API updates
- New
/pingservice for testing manager availability - New
/metricsservice expose Manager metrics (also, see ScyllaDB Manager Metrics above) - New
/progress/{run_id}return status of a specific repair - Rest API Update:
/cluster/{cluster_id}/repair/unit/{unit_id}/progressis now/cluster/{cluster_id}/repair/unit/{unit_id}/progress/{run_id}making the repair run ID mandatory.
Other improvements
- New script scyllamgr_ssh_test performs a quick test of SSH connectivity between ScyllaDB manager and ScyllaDB nodes
Noteworthy bug fixes in ScyllaDB Manager 1.1
- All Time types are now represented as UTC (Coordinated Universal Time)
- sctool: The task list command now displays duration instead of end time. In addition, any task list command that is run without a cluster name argument, reports a list of tasks from all clusters.
- ScyllaDB Manager log level is now configurable in the manager.yaml file
- ScyllaDB REST API was reporting SSH errors with confusing error messages, this has been fixed.
- dist: A Restart directive was added to the scylla-mgmt service