The ScyllaDB Enterprise team is pleased to announce the release of ScyllaDB Manager 1.3, a production-ready release of ScyllaDB Manager for ScyllaDB Enterprise customers.
ScyllaDB Manager 1.3 adds a new Health Check, which works as follows.. ScyllaDB nodes are already reporting on their status through “nodetool status” and via ScyllaDB Monitoring Stack dashboards; but in some cases, it is not enough. A node might report an Up-Normal (UN) status, while in fact, it is slow or not responding to CQL requests. This might be a result of an internal problem in the node, or an external issue (for example, a blocked CQL port somewhere between the application and the ScyllaDB node).
ScyllaDB Manager’s new Health Check functionality helps identify such issues as soon as possible, playing a similar role to an application querying the CQL interface from outside the ScyllaDB cluster.
ScyllaDB Manager 1.3 automatically adds a new task to each a new managed cluster. This task is a health check which sends a CQL OPTION command to each ScyllaDB node and measures the response time. If there is a response faster than 250ms the node is considered to be ‘up’. If there is no response or the response takes longer than 250 ms, the node is considered to be ‘down’. The results are available using the “sctool status” command.

ScyllaDB Manager 1.3 Architecture, including the Monitoring Stack, and the new CQL base Health Check interface to ScyllaDB nodes.
If you have enabled the ScyllaDB Monitoring stack, Monitoring stack 2.0 Manager dashboard includes the same cluster status report. A new Alert was defined in Prometheus Alert Manager, to report when a ScyllaDB node health check fails and the node is considered ‘down’.
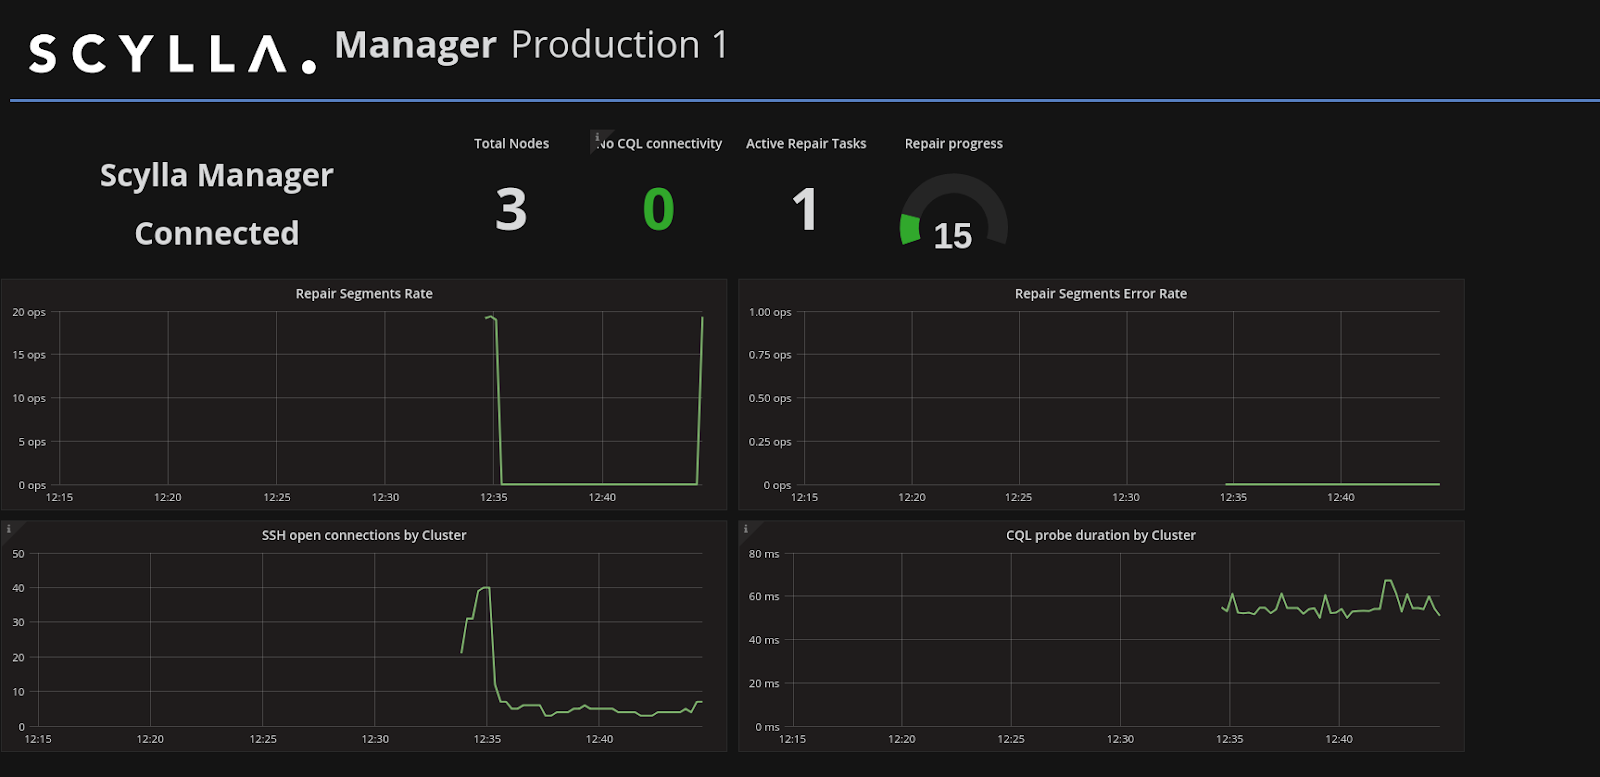
Example of Manager 1.3 Dashboard, including an active repair running, and Health Check reports of all nodes responding to CQL.
Related links:
- Download ScyllaDB Manager – for customers only, or for limited evaluation.
- Get started with ScyllaDB Manager 1.3
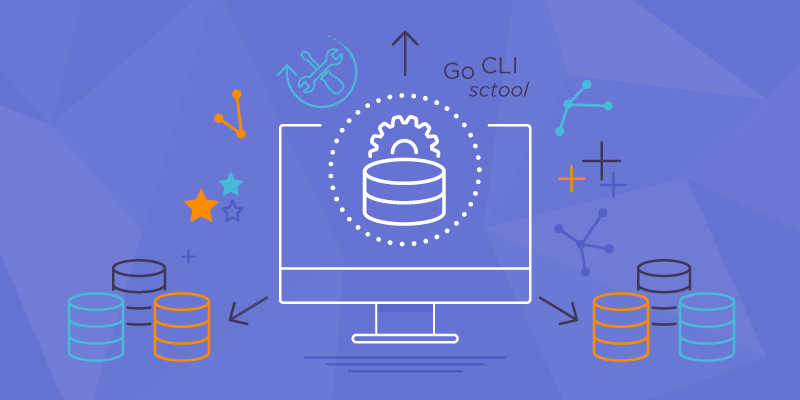
- sctool, ScyllaDB Manager 1.3 CLI tool reference
- Upgrade ScyllaDB Manager 1.2 to 1.3 (CentOS only, Ubuntu and Debian Upgrade guide will be publish shortly)
- Report issues with ScyllaDB Manager using the ScyllaDB Enterprise support channels
Upgrade to ScyllaDB Manager 1.3
Read the upgrade guide carefully. In particular, you will need to redefine scheduled repairs. Please contact ScyllaDB Support team for help in installing and upgrading ScyllaDB Manager.
Monitoring
ScyllaDB Grafana Monitoring 2.0 now includes the ScyllaDB Manager 1.3 dashboard
About ScyllaDB Manager
ScyllaDB Manager adds centralized cluster administration and recurrent task automation to ScyllaDB Enterprise. ScyllaDB Manager 1.x includes automation of periodic repair. Future releases will provide rolling upgrades, recurrent backup, and more. With time, ScyllaDB Manager will become the focal point of ScyllaDB Enterprise cluster management, including a GUI front end. ScyllaDB Manager is available for all ScyllaDB Enterprise customers. It can also be downloaded from scylladb.com for a 30-day trial.