
Jaeger has gained significant popularity in the software development community due to its powerful capabilities and ease of integration with various programming languages and frameworks. With the rise of microservices and cloud-native applications, Jaeger has become a crucial tool for developers and system administrators to gain insights into the performance and behavior of their applications.
How do you make Jaeger even more effective for monitoring and troubleshooting distributed applications, especially in high-traffic, demanding environments where a high-performance storage solution is critical? Use the best-performing Jaeger storage backend that you can find.
Using ScyllaDB, a monstrously fast and scalable NoSQL database, as the storage backend for Jaeger Server can offer improved performance, scalability, and resource efficiency. This makes Jaeger even more effective for monitoring and troubleshooting distributed applications, especially in high-traffic, demanding environments where a high-performance storage solution is critical.
Tl;DR
In this post ,you’ll discover how to integrate a ScyllaDB cluster with a Jaeger server as a storage backend. Using ScyllaDB as the Jaeger backend boosts the performance and provides high scalability.
Architecture
Here is what the example architecture will look like:
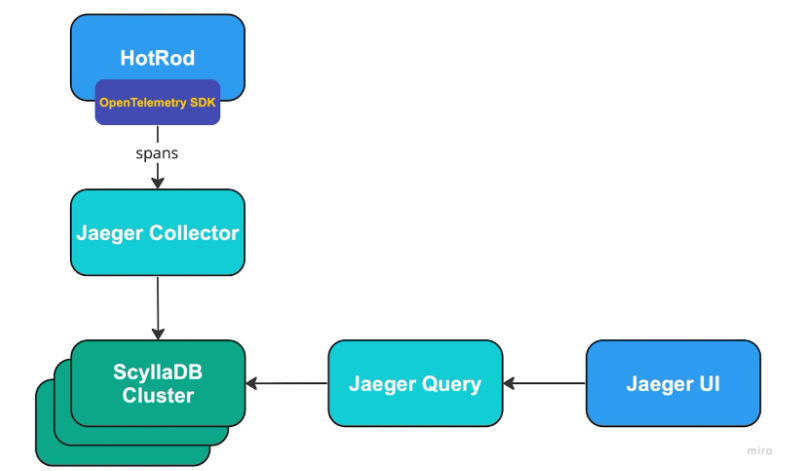
It consists of a few parts:
- HotRod: The Jaeger Demo Application that can generate spans. It uses OpenTelemetry SDK and pushes spans via GRPC API directly to the Jaeger Collector.
Jaeger Collector: Responsible for receiving spans from the Jaeger agent, performing validations and transformations, and saving them to the storage backend (ScyllaDB Cluster in our case). - ScyllaDB Cluster: Jaeger supports various storage backends to store the spans. In our case, we use a ScyllaDB Cluster built from 3 nodes.
- Jaeger Query: A service responsible for retrieving traces from the Jaeger storage backend and making them accessible for the Jaeger UI.
- Jaeger UI: A React application that lets you visualize the traces and analyze them. Useful for debugging system issues.
Jaeger Server
Jaeger Server is an open-source distributed tracing system, originally developed by Uber Technologies, aimed at monitoring and troubleshooting the performance of microservices-based applications. It provides end-to-end visibility into the interactions among different components in a distributed architecture, which is invaluable when dealing with complex, large-scale applications.
Now using an updated architecture, Jaeger relies on direct communication between applications and the Jaeger Collector, which processes and stores trace data in backend storage systems such as Cassandra, Elasticsearch, or Kafka. The Jaeger Query service offers a web-based UI and API for users to explore, visualize, and analyze trace data. Jaeger also supports integration with other observability tools like Prometheus and Grafana, making it a popular choice for monitoring modern distributed applications.
Service Setup With Docker
In this exercise, you’ll use Docker.
Ensure that your environment meets the following prerequisites:
- Docker for Linux, Mac, or Windows. Please note that running ScyllaDB in Docker is only recommended for evaluating ScyllaDB outside of production. For best performance, a regular install is recommended
- 8GB of RAM or greater for Jaeger and ScyllaDB services
- Git
ScyllaDB and Jaeger Setup
Let’s create a docker network which will be used later by Jaeger services, the ScyllaDB cluster and the demo app:
docker network create --driver bridge jaeger-scylladb
When network is created, we can run whole infra with single docker compose from jaeger examples, which can be downloaded and located by:
git clone [email protected]:jaegertracing/jaeger.git cd jaeger/plugin/storage/scylladb
Run docker compose:
docker compose up -d
This starts the ScyllaDB cluster and waits until it becomes initialized and healthy (about 40 seconds).
To make sure the ScyllaDB cluster is up and running, run:
docker exec -it scylladb-scylladb-1 nodetool status
Once the node is ready you will see it has the UN status.
Then, the jaeger-cassandra-schema image is used to populate the ScyllaDB cluster with the required schema. It starts, creates the schema and exits.
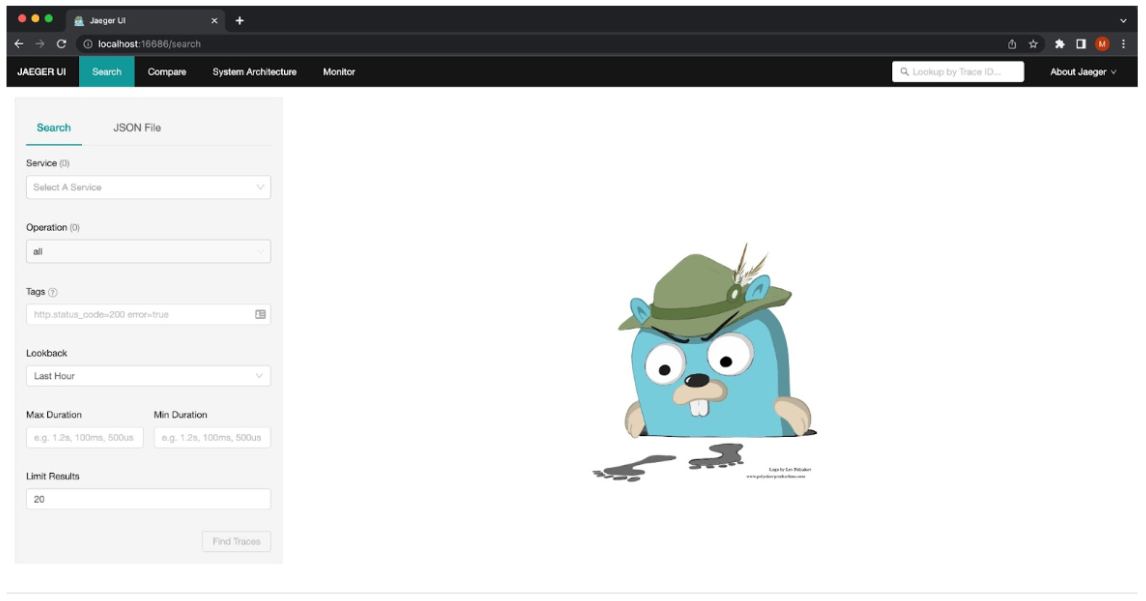
Then docker compose starts Jaeger Collector, Jaeger Query and Jaeger UI services. At this point, the Jaeger UI is up and running at http://localhost:16686.
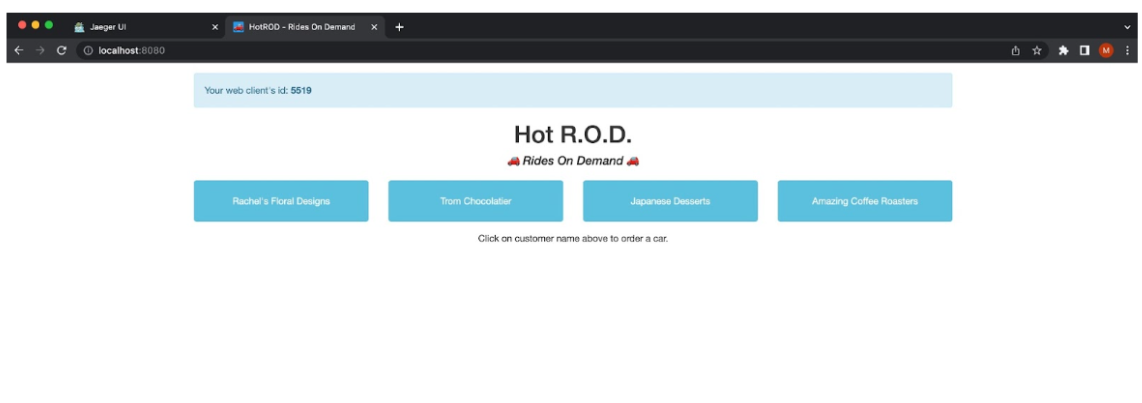
As a final step, the demo app is launched and can be accessed via http://localhost:8080/
The docker compose output should look like this
[+] Running 7/7
⠿ Container scylladb-scylladb-1 Healthy 38.8s
⠿ Container scylladb-scylladb2-1 Started 0.9s
⠿ Container scylladb-scylladb3-1 Started 0.7s
⠿ Container scylladb-cassandra-schema-1 Started 39.0s
⠿ Container scylladb-web-1 Started 39.2s
⠿ Container scylladb-collector-1 Started 39.2s
⠿ Container scylladb-hotrod-1 Started 39.4s
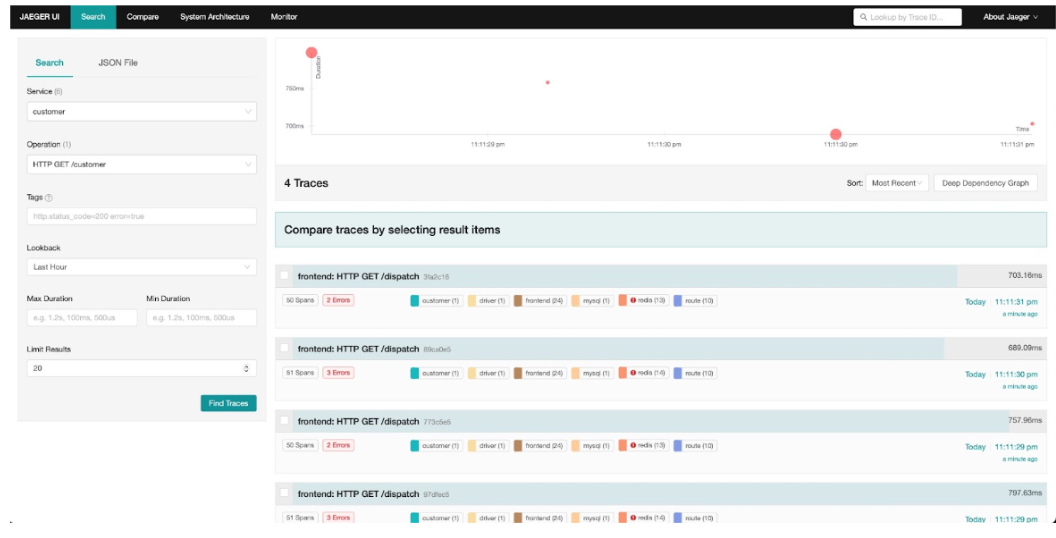
Test the Integration
Click some buttons in the HotRod demo app…
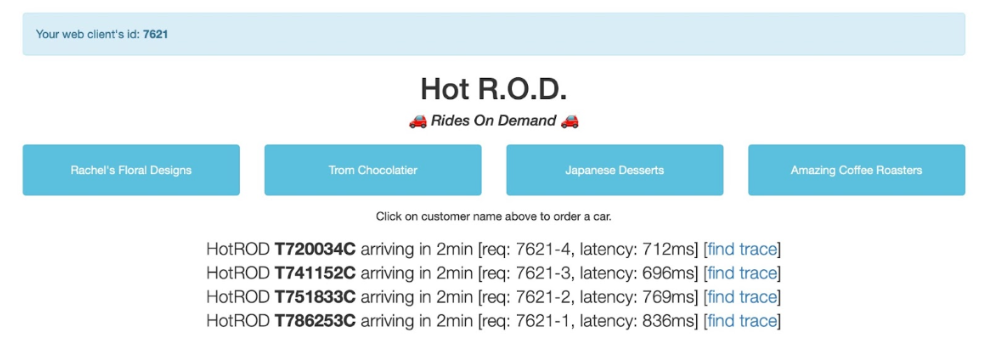
And observe the traces in the Jaeger UI.
Jaeger with ScyllaDB Performance
The performance of Jaeger is of utmost importance as it directly impacts the ability to diagnose and resolve performance bottlenecks, latency issues, and errors in distributed systems. By accurately measuring and tracing the execution path of requests, Jaeger enables developers to optimize their applications, improve user experience, and ensure reliable and efficient operation of their systems.
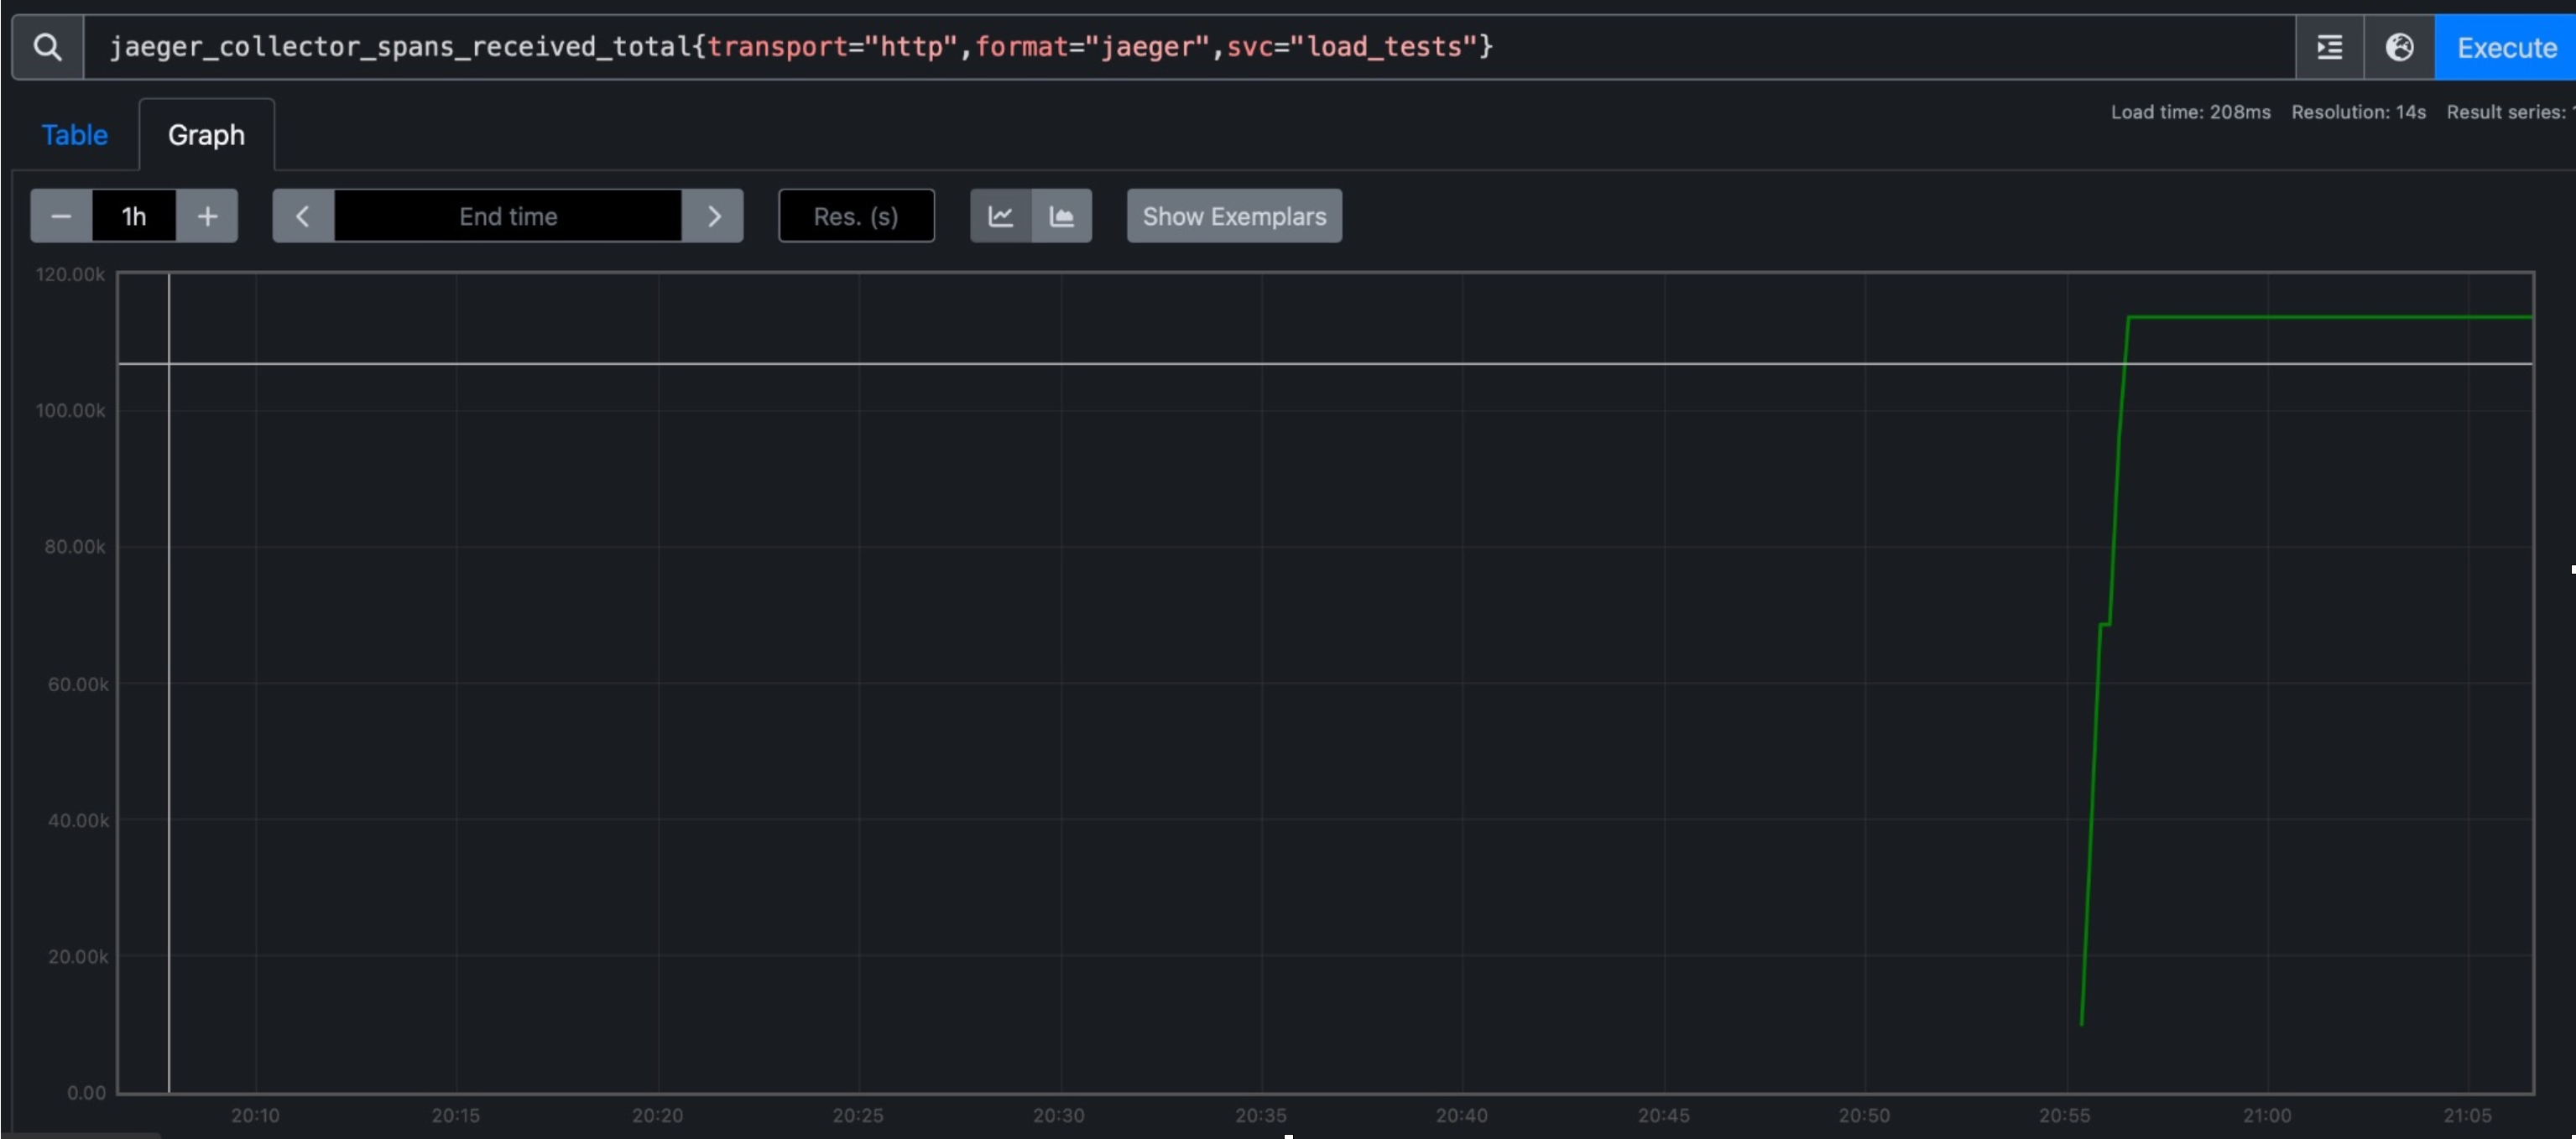
In a proof of concept test using ScyllaDB as a storage backend for Jaeger, ScyllaDB did well in terms of span collection rate. With three nodes, an allocated 1GB of RAM and 512 CPU credits each, it collected approximately 120,000 spans within a 60-second duration, averaging around 2,000 spans per second. We compared these with using Apache Cassandra as the storage backend and the performance was significantly better. These results were not surprising, when taking into account ScyllaDB’s better performance when compared to Cassandra. You can read more about the details of the test in the appendix below. Note this is an evaluation, not a production-ready ScyllaDB deployment.
Summary
To summarize, in this post, you saw how easy it is to run Jaeger with ScyllaDB as the storage backend. By doing so you can achieve great performance, scalability and efficiency for the Jaeger Collector, enabling the Jaeger Collector to handle a larger number of spans per second.
You can discuss this post on the ScyllaDB community forum.
Appendix: Proof of Concept Test Infrastructure
The entire infrastructure for this proof of concept was deployed on Amazon Web Services (AWS) using Terraform. The deployment process includes setting up a Virtual Private Cloud (VPC), a subnet, a security group, and an EC2 instance. On the EC2 instance, the Jaeger Collector is installed, enabling the collection and processing of distributed traces. Additionally, a Prometheus server, database clusters, and a load generator instance are created to facilitate the load testing procedure.
Note that there is no “common” hardware specification for the Jaeger Collector to run on. Typically, it is recommended to start with a small setup and scale up as needed. In this load test, we will use the smallest available instances (t2.micro, 1 CPU, 1GB RAM) whenever possible to establish a baseline starting point.
Note that the load test performed is not a full-fledged benchmark. The goal is to demonstrate the benefits of using a stable, high throughput, low latency database as the storage backend.
POC Test Design
Load testing is a crucial aspect of assessing the performance and scalability of any system. By subjecting the Jaeger Collector to various levels of simulated traffic, we can analyze its behavior and identify potential bottlenecks or areas for optimization. This test specifically deals with the performance of the Jaeger Collector when using ScyllaDB as the storage backend.
For this load test, we decided to generate synthetic traces using the load generator instance. These traces would be ingested by the Jaeger Collector.
The load test for the Jaeger Collector involves configuring various environment variables to define the parameters of the test. These variables determine the behavior of the load generator and control the characteristics of the generated traces. Let’s explore each of these environment variables:
1. CONCURRENCY: (Default = 10) This variable specifies the number of coroutines used to generate traces concurrently during the load test. The higher the concurrency value, the greater the number of traces generated simultaneously. Increasing the concurrency can help simulate a higher volume of concurrent requests to assess the system’s scalability and response under heavy load.
2. SPANS_COUNT: (Default = 10) The SPANS_COUNT variable determines the number of child spans created per trace. A span represents a unit of work or activity within a trace. By defining the number of spans per trace, you can simulate different levels of complexity in the distributed traces generated during the load test. Increasing the spans count can help evaluate the system’s performance in handling more intricate trace structures.
3. TAGS_COUNT: (default = 10) This variable controls the number of tags associated with each individual span within a trace. Tags provide additional contextual information about a span, such as metadata or labels. By adjusting the tags count, you can simulate scenarios where each span carries varying amounts of metadata. This helps assess the system’s ability to process and store a larger volume of tag data associated with the distributed traces.
4. DURATION_S: (default = 60) The DURATION_S variable sets the duration in seconds for which the load test will run. It defines the total time during which traces will be continuously generated and ingested by the Jaeger Collector. By specifying the duration, you can control the duration of the load test and observe how the system’s performance and resource utilization evolve over time.
By adjusting these environment variables, you can tailor the load test to mimic different scenarios and workloads, allowing for a comprehensive evaluation of the Jaeger Collector’s performance under varying conditions. It is recommended to carefully choose appropriate values for these variables based on your specific testing objectives and the expected production workload characteristics.
During the load test, the load generator instance will utilize the defined values for these variables to generate and send traces to the Jaeger Collector. The collector will then process and store the traces on ScyllaDB. The performance of the Jaeger Collector, including metrics such as throughput, latency, and resource utilization, can be monitored and analyzed to gain insights into its behavior and scalability under different load test scenarios.
Performance Metrics
To evaluate the performance of the Jaeger Collector and analyze the performance when using ScyllaDB as the storage backend, we will primarily focus on the total spans count processed by the Jaeger Collector during the load tests.
Since we don’t have access to the OpenTracing SDK for measuring latency between the load test generator and the Jaeger Collector directly, we will rely on the spans count as an indicator of the Jaeger Collector’s capability to handle the incoming traces.
By observing the spans count, we can assess the ability of the Jaeger Collector to process and store distributed traces efficiently on the storage backend. A higher spans count indicates that the Jaeger Collector successfully handled a larger volume of traces, reflecting better performance and scalability.
Comparing the spans count between the load tests provides a good indicator for the performance of ScyllaDBas the storage backend for the Jaeger Collector.
Load Test Execution
For the load test execution, we will utilize the following environment variable values:
– CONCURRENCY: 10
– SPANS_COUNT: 10
– TAGS_COUNT: 10
– DURATION_S: 60 seconds
These values are set in the Terraform configuration, specifically in the load test service container definition. They determine the parameters and characteristics of the load generated during the test.
The Jaeger Collector, Prometheus, and the load test itself will be deployed on EC2 instances of the t2.micro type. These instances offer 1 CPU and 1GB RAM. The database cluster, consisting of three nodes, will be deployed on t2.medium instances. Each t2.medium instance provides 2 CPUs and 4GB RAM. This hardware configuration allows for a sufficient level of resources to support the load test activities.
All services, including the Jaeger Collector, Prometheus, and the load test, are packaged into Docker images and deployed to the respective hosts as ECS services. Additionally, each host also runs the Prometheus Node Exporter, which collects host-level metrics such as CPU usage, RAM utilization, disk I/O, and network I/O.
By deploying the services as ECS services and utilizing Docker containers, we ensure consistency and ease of deployment across the infrastructure. The load test environment is designed to be scalable, allowing for the efficient execution of the load test with the specified environment variable values.
During the load test execution, the load generator will generate traces based on the defined environment variables. These traces will be sent to the Jaeger Collector, which will process and store them based on the selected storage backend (ScyllaDB or Cassandra).
The Prometheus server will monitor the performance metrics of the load test environment, including the resource utilization of the EC2 instances, container-level metrics, and any custom metrics exposed by the load test itself.
By collecting and analyzing these metrics, we can gain insights into the performance, scalability, and resource utilization of the Jaeger Collector and the overall load test infrastructure. These metrics will provide valuable information for evaluating the efficiency and capacity of the system under the specified load and configuration.
Throughout the load test execution, it is recommended to monitor the Prometheus metrics to ensure the stability and health of the environment. This monitoring approach enables real-time visibility into the system’s behavior and performance during the load test, facilitating prompt identification of any potential issues or bottlenecks.
Overall, the load test execution is designed to be straightforward and reliable, allowing for the evaluation of the Jaeger Collector’s performance under the specified load conditions and infrastructure setup.
Results and Analysis
During the load test, ScyllaDB successfully ran three nodes on the same host, with each node allocated 1GB of RAM and 512 CPU credits. The Jaeger Collector, utilizing ScyllaDB as the backend storage, managed to collect approximately 120,000 spans within a 60-second duration. This translates to an average rate of around 2,000 spans per second.
Analysis
ScyllaDB demonstrated better scalability and resource utilization compared to Cassandra in this specific load test scenario. Despite having fewer resources allocated to each node, ScyllaDB was able to handle a significantly higher number of spans per second, indicating its superior performance in processing and storing distributed traces.