
A look at why Visually.io chose ScyllaDB to replace MongoDB as its main production real-time database, and how they run it on spot (volatile) instances that cost 1/4 of the regular cloud compute price.
Serving over 1M OPS with an average latency of a few milliseconds — while reading/writing real-time user-level data that can grow to billions of rows — is not a trivial task. It requires serious infrastructure that typically has a premium price tag and requires a team of experts to operate.
What if I tell you that all you need is a Kubernetes cluster and an open source database to achieve zero downtime failovers, single-digit millisecond-level response times, both vertical and horizontal scaling, data sharding per CPU core, fully distributed read/write ops and much more? In this article, I’ll share how my team at Visually.io used ScyllaDB to replace MongoDB as our main real-time production database.
ScyllaDB is an open source NoSQL database that’s API-compatible with Apache Cassandra (and also DynamoDB). It has all the advantages of a ring architecture masterless database while avoiding all the issues Cassandra is notorious for, including Java virtual machine issues like stop-the-world garbage collection, a large memory footprint, slow startup, just-in-time warmup and complex configuration.
ScyllaDB comes with a production-ready Helm chart, Kubernetes operator, and a plug-and-play configuration. It’s open source and it works flawlessly on spot (volatile) instances that cost 1/4 of the regular cloud compute price.
Why Move from MongoDB to ScyllaDB ?
All that sounds amazing, but what’s wrong with MongoDB? It’s open source and supports data sharding. But MongoDB’s architecture is quite different. It has a single point of failure: If the coordinator goes down, the database starts a failover, and it’s unavailable during that time. In addition, achieving high availability requires that every MongoDB shard runs as a replica set (more nodes). The ring architecture shared by both Cassandra and ScyllaDB is superior in this sense. Moreover, ScyllaDB’s driver is shard-aware and knows to reach the precise node/CPU that’s responsible for the queried row, which allows true distribution.
But why are high availability and zero downtime failovers so important? If you plan to run on spot instances (1/4 of the compute price), you will experience frequent (daily) failovers because Kubernetes will constantly kill and re-create nodes, which will cause all pods/processes running on them to die, including your database.
Getting up and Running on Kubernetes
First, you’ll want to run ScyllaDB locally and play. Use its drivers and run some CQL (Cassandra Query Language) as described in the docs. I used the gocql driver. Remember that ScyllaDB drivers are shard-aware, and you need to connect to the shard-aware ScyllaDB port 19042 (not the default Cassandra port on 9042).
The ScyllaDB Kubernetes Operator repo contains three Helm charts:spot
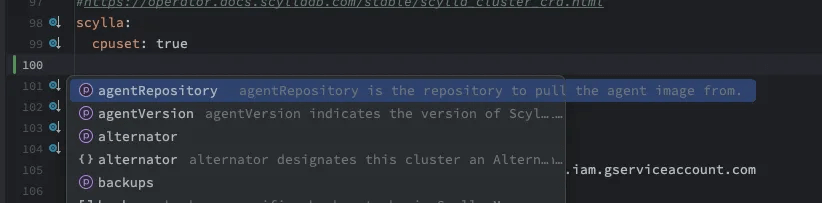
- scylla: The database itself. It contains the ScyllaCluster CRD (Kubernetes custom resource definition), a YAML that configures the ScyllaDB cluster, its size, resources, file system and so on.
- scylla operator: Installs a Kubernetes controller that will take this YAML and creates from it a StatefulSet, services and other Kubernetes entities.
- scylla manager: Basically a singleton service that automates tasks. It is connected to all ScyllaDB nodes and can run clusterwide tasks such as a repair or a cloud storage backup.
I used Argo CD to install and configure the charts mentioned above. It allows GitOps mechanics rollbacks and provides visibility for the things happening in Kubernetes. (Argo CD is outside the scope of this article, but basically, instead of running a Helm install command, I will be clicking a few UI buttons and pushing a few YAMLs into a git repo).
Configuring the cluster
The configuration of the operator chart is pretty straightforward. The only thing you need to define is a Kubernetes nodeSelector and taint tolerations if you need them. Define on which k8s nodes the operator can run, then it’s plug and play.
Now, we’ll move on to ScyllaDB Manager. Let’s look at the Chart.yaml:
The dependencies directive declares that scylla-manager imports scylla chart, so when you install it, you install both of them. The manager configuration (values.yaml) has a section for ScyllaDB, where all the action takes place.
The key point regarding the above configuration is the xfs storageClassName, which is advised by ScyllaDB and provides better performance. The chart does not contain the storage class definition, but you can add it yourself:
apiVersion: storage.k8s.io/v1
kind: StorageClass
metadata:
  name: xfs-class
provisioner: pd.csi.storage.gke.io
parameters:
  type: pd-ssd
  csi.storage.k8s.io/fstype: xfs
volumeBindingMode: WaitForFirstConsumer
allowVolumeExpansion: true
Notice the allowVolumeExpansion flag. It will allow you to later increase the PersistentVolumeClaim (PVC) disk size seamlessly while the database is running. After Argo CD installed both charts, here is the result:
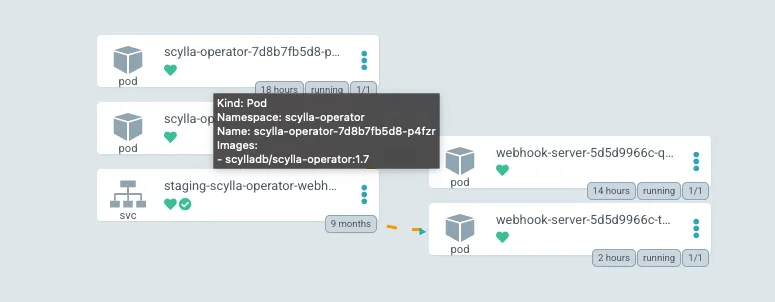
ScyllaDB Operator
ScyllaDB Operator is up and running. A thing to note here is that the operator itself is highly available and has two replicas of its own. It will now create the ScyllaDB cluster based on its CRD.
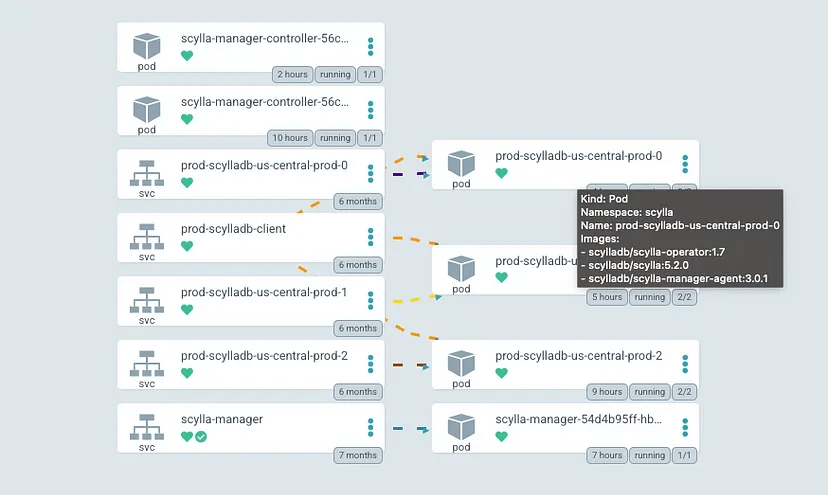
ScyllaDB Cluster
In our case, the operator created a cluster of three nodes. Every pod is running the database itself, ScyllaDB Manager and operator clients. This helps replace “the team of experts” and automates administration and operation tasks.
Monitoring
No production database can exist without proper monitoring and alerting in place. ScyllaDB Operator achieves this with the Prometheus service monitor configuration.
scylla:
...
  serviceMonitor:
      promRelease: staging-prometheus-operator
      create: true
This flag causes the operator to create two service monitors.
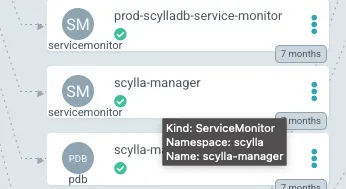
ServiceMonitors
This will cause Prometheus to scrape the database metrics periodically, store them in a time series database and allow running promQL queries to define Grafana dashboards and alerts.
Dashboards
Grafana JSON dashboards can be found here. Here’s how to add them to the Helm charts that ScyllaDB provides.
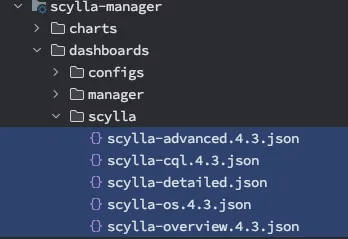
ScyllaDB dashboards added to the chart
To do that, we need to create Kubernetes ConfigMaps and label them as Grafana dashboards. Fortunately, Helm can help us with that.
{{- range $path, $_ :=  .Files.Glob  "dashboards/scylla/*.json" }}
{{- $filename := trimSuffix (ext $path) (base $path) }}
apiVersion: v1
kind: ConfigMap
metadata:
  name: scylla-dashboard-{{ $filename }}
  namespace: monitoring
  labels:
    grafana_dashboard: "1"
    app.kubernetes.io/managed-by: {{ $.Release.Name }}
    app.kubernetes.io/instance: {{ $.Release.Name }}
data:
  {{ base $path }}: |-
{{ $.Files.Get $path | indent 4 }}
---
{{- end }}
The above snippet will result in five config maps being added to Kubernetes and labeled with grafana_dashboard: "1"(which will cause Grafana to mount them).
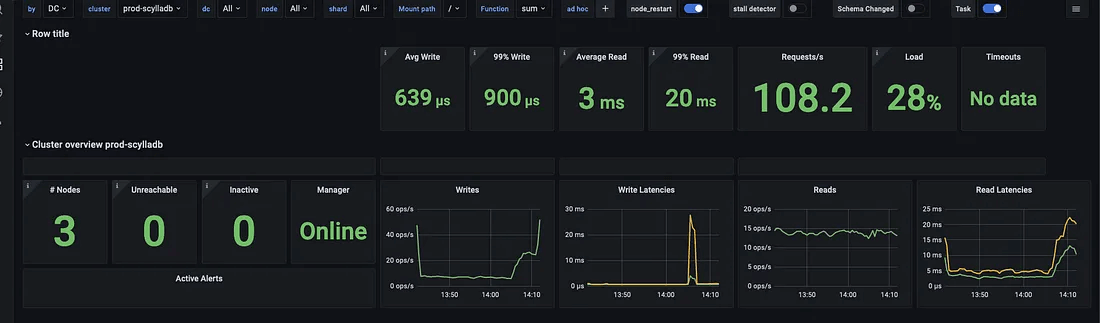
ScyllaDB overview dashboard – view 1
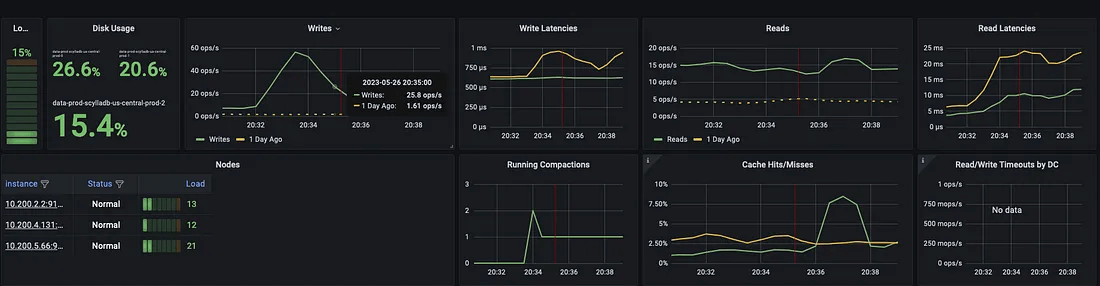
ScyllaDB overview dashboard – view 2
There are many graphs with nuanced metrics exported, which allows fine-grained monitoring for everything the database experiences. The following graph is very important; it describes all the failovers in the past 24 hours.
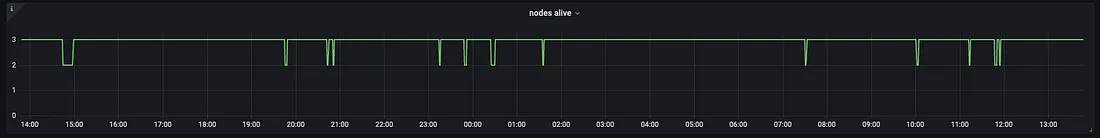
13 failovers in 24 hours
Every time Kubernetes kills a random spot instance, it then schedules a new ScyllaDB pod, which rejoins the cluster, without any downtime, in a couple of minutes.
We have been running ScyllaDB for almost a year now, and it works like clockwork. A useful tip here is to overprovision the node pool by one node at all times. This will, most likely, ensure that there is at least one available node that can be scheduled with the new database pod. It increases the price a bit, but it’s still much more cost-efficient than using regular nodes.
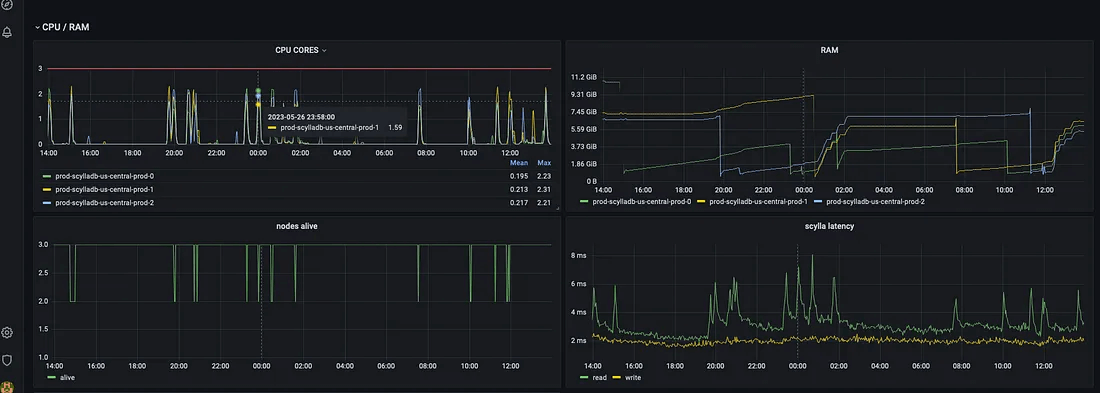
Failovers / RAM / CPU / latency
The above image shows that every time a ScyllaDB instance is killed, a short CPU spike occurs, the latency is increased by a couple of milliseconds, and the RAM is dropped since all the cache ScyllaDB was building in RAM disappears. This is a clear disadvantage of using spot instances. However, in our use case it’s worth trading short, very small latency spikes for a large compute price discount.
Conclusion
In conclusion, ScyllaDB, the fastest NoSQL Database, proves to be an exceptional open source database that lives up to its promises. The fact that ScyllaDB is freely available as open source is truly remarkable. As a software developer, I have no affiliation with ScyllaDB, but I am grateful for the technology it provides. This article serves as a heartfelt thank you to the ScyllaDB community for its dedication to open source and for empowering developers like myself with such remarkable technology.