

See how NoSQL data modeling anti-patterns actually manifest themselves in practice, and how to diagnose/eliminate them.
In NoSQL Data Modeling Guidelines for Avoiding Performance Issues, we explored general data modeling guidelines that have helped many teams optimize the performance of their distributed databases. We introduced what imbalances are, and covered some well-known imbalance types – such as uneven data distribution and uneven access patterns.
Let’s now dive deeper, and understand how some anti-patterns actually manifest themselves in practice. We will use ScyllaDB throughout to provide concrete examples, although the majority of the strategies and challenges are also applicable to other NoSQL databases.
To help you follow along, we have created a GitHub repository. It includes sample code that can be used to observe and reproduce most of these scenarios, plus build additional (and more complex) ones.
As you play along and reproduce hot and large partitions, large collections, large tombstone runs, etc., be sure to observe the results along with the ScyllaDB Monitoring Stack in order to understand how the anti-pattern may affect your cluster stability in practice.
Not Addressing Large Partitions
Large partitions commonly emerge as teams scale their distributed databases. Large partitions are partitions that grow too big, up to the point when they start introducing performance problems across the cluster’s replicas.
One of the questions that we hear often– at least once a month – is what constitutes a large partition. Well, it depends. Some things to consider:
- Latency expectations: The larger your partition grows, the longer it will take to be retrieved. Consider your page size and the number of client-server round trips needed to fully scan a partition.
- Average payload size: Larger payloads generally lead to higher latency. They require more server-side processing time for serialization and deserialization, and also incur a higher network data transmission overhead.
- Workload needs: Some workloads organically require larger payloads than others. For instance, I’ve worked with a web3 blockchain company that would store several transactions as BLOBs under a single key, and every key could easily get past 1MB in size.
- How you read from these partitions: For example, a time-series use case will typically have a timestamp clustering component. In that case, reading from a specific time-window will retrieve much less data than if you were to scan the entire partition.
The following table illustrates the impact of large partitions under different payload sizes, such as 1, 2 and 4KB.
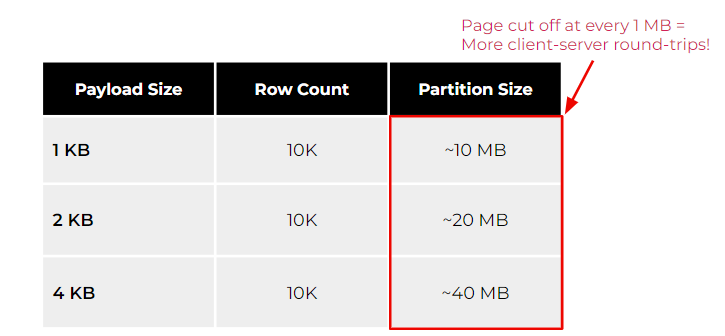
As you can see, the higher your payload gets under the same row count, the larger your partition is going to be. However, if your use case frequently requires scanning partitions as a whole, then be aware that databases have limits to prevent unbounded memory consumption. For example, ScyllaDB cuts off pages at every 1MB to prevent the system from potentially running out of memory. Other databases (even relational ones) have similar protection mechanisms to prevent an unbounded bad query from starving the database resources. To retrieve a payload size of 4KB and 10K rows with ScyllaDB, you would need to retrieve at least 40 pages to scan the partition with a single query. This may not seem a big deal at first. However, as you scale over time, it could impact your overall client-side tail latency.
Another consideration: with databases like ScyllaDB and Cassandra, data written to the database is stored in the commitlog and under an in-memory data structure called a “memtable.”
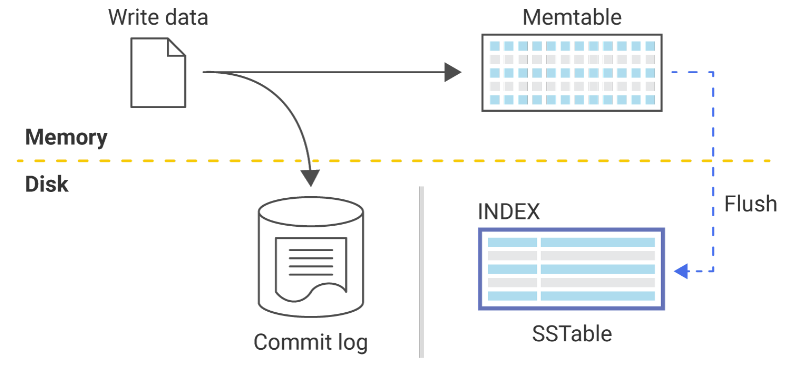
The commitlog is a write-ahead log that is never really read from, except when there’s a server crash or a service interruption. Since the memtable lives in memory, it eventually gets full. In order to free up memory space, the database flushes memtables to disk. That process results in SSTables (which is how your data gets persisted).
What does all this have to do with large partitions? Well, SSTables have specific components that need to be held in memory when the database starts. This ensures that reads are always efficient and minimizes wasting storage disk I/O when looking for data. When you have extremely large partitions (for example, we recently had a user with a 2.5TB partition in ScyllaDB), these SSTable components introduce heavy memory pressure, therefore shrinking the database’s room for caching and further constraining your latencies.
Introducing Hot Spots
Hot spots can be a side effect of large partitions. If you have a large partition (storing a large portion of your data set), it’s quite likely that your application access patterns will hit that partition more frequently than others. In that case, it also becomes a hot spot.
Hot spots occur whenever a problematic data access pattern causes an imbalance in how data is accessed in your cluster.One culprit: when the application doesn’t impose any limits on the client side and allows tenants to potentially spam a given key. For example, think about bots in a messaging app frequently spamming messages in a channel. Hot spots could also be introduced by erratic client side configurations in the form of retry storms. That is, a client attempts to query specific data, times out before the database does, and retries the query while the database is still processing the previous one.
Monitoring dashboards should make it simple for you to find hot spots in your cluster. For example, this dashboard shows that shard 20 is overwhelmed with reads.
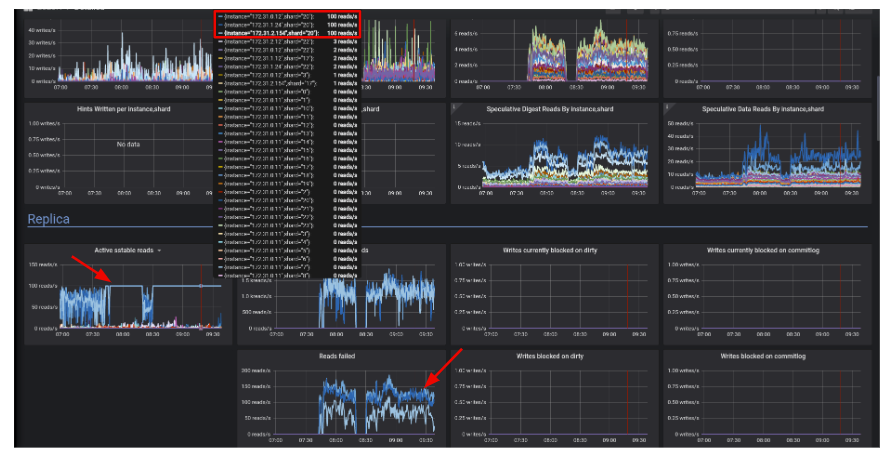
For another example, the following graph shows 3 shards with higher utilization, which correlates to the replication factor of 3 configured for the keyspace in question.
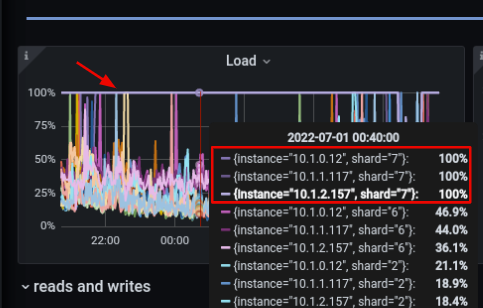
Here, shard 7 introduces a much higher load due to the spamming.
How do you address hot spots such as hot partitions? With ScyllaDB, you can use the nodetool toppartitions command to gather a sample of the partitions being hit over a period of time on the affected nodes. You can also use tracing, such as probabilistic tracing, to analyze which queries are hitting which shards and then act from there.
Misusing Collections
Teams don’t always use collections, but when they do … they often use them incorrectly. Collections are meant for storing/denormalizing a relatively small amount of data. They’re essentially stored in a single cell, which can make serialization/deserialization extremely expensive.
When you use collections, you can define whether the field in question is frozen or non-frozen. A frozen collection can only be written as a whole; you can not append or remove elements from it. A non-frozen collection can be appended to, and that’s exactly the type of collection that people most misuse. To make things worse, you can even have nested collections, such as a map which contains another map, which includes a list, and so on.
Misused collections will introduce performance problems much sooner than large partitions, for example. If you care about performance, collections can’t be very large at all. For example, if we create a simple key:value table, where our key is a sensor_id and our value a collection of samples recorded over time, as soon as we start ingesting data our performance is going to be suboptimal.
     	CREATE TABLE IF NOT EXISTS {table} (
           	sensor_id uuid PRIMARY KEY,
           	events map<timestamp, FROZEN<map<text, int>>>,
        	)
The following monitoring snapshots show what happens when you try to append several items to a collection at once.
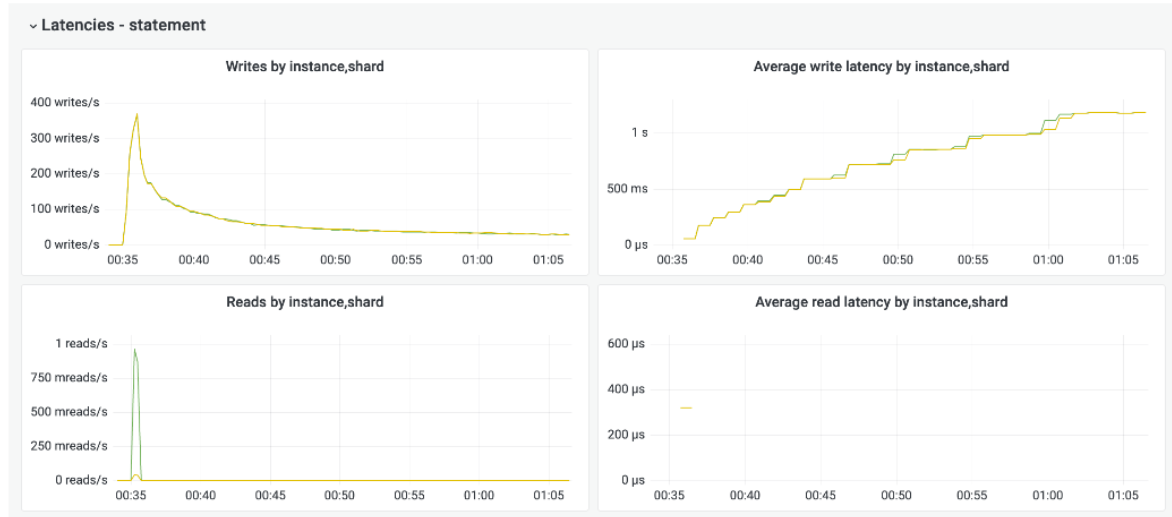
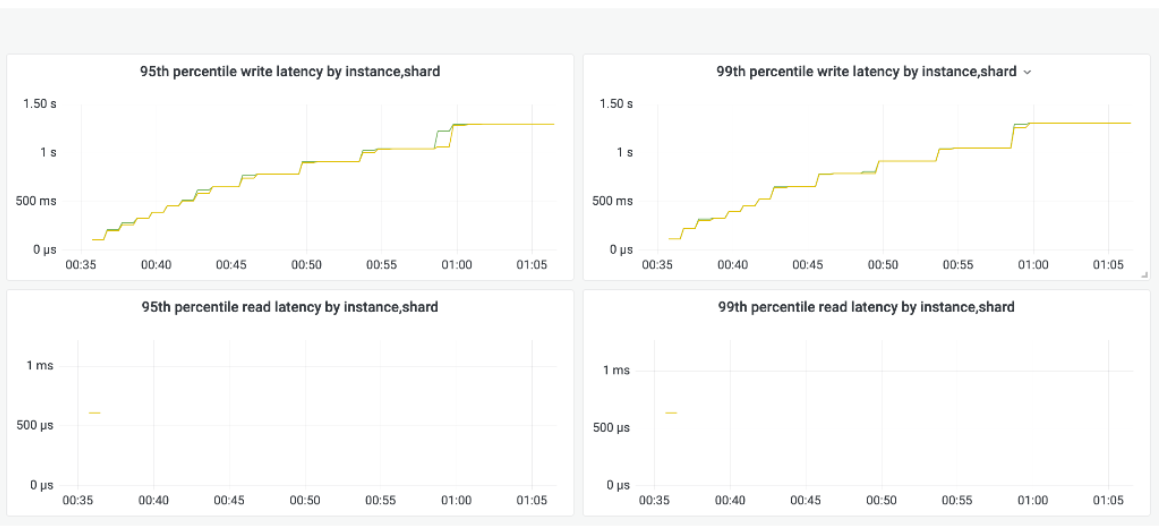
We can see that while the throughput decreases, the p99 latency increases. Why does this occur?
- Collection cells are stored in memory as sorted vectors
- Adding elements requires a merge of two collections (old & new)
- Adding an element has a cost proportional to the size of the entire collection
- Trees (instead of vectors) would improve the performance, BUT…
- Trees would make small collections less efficient!
Returning that same example, the solution would be to move the timestamp to a clustering key and transform the map into a FROZEN collection (since you no longer need to append data to it). These very simple changes will greatly improve the performance of the use case.
	CREATE TABLE IF NOT EXISTS {table} (
           	sensor_id uuid,
		record_time timestamp,
           	events FROZEN<map<text, int>>,
	 PRIMARY KEY(sensor_id, record_time)
        	)
Using Low Cardinality Indexes & Views
Creating a low cardinality view is in fact a nice way to win the lottery and introduce hotspots, data imbalances and large partitions all at the same time. The table below shows approximately how many large partitions you will end up creating depending on the type of data you chose as either a base table key or as a view key:
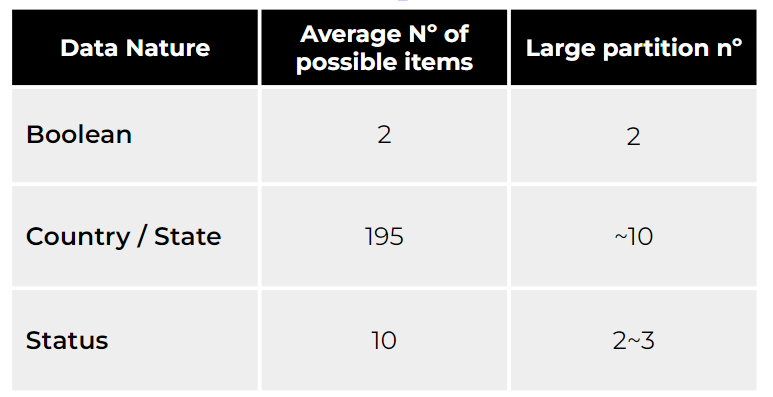
A boolean column has 2 possible values, which means that you will end up with 2 large partitions (100%). If you decide to restrict by country, then there are a total of 195 countries in the world. However, countries such as the US, China, and India are likely to become large partitions. And if we decide to select from a field such as “Status” (which might include active, inactive, suspended, etc.) it is likely that a good portion of the data set will result in large partitions.
Misuse of Tombstones (for LSM-Tree-Based Databases)
When you delete a record in a database with a Log-Structured Merge tree storage engine, then you need to know that your deletes are actually writes. Tombstones are a write-marker that tells the database that your data should be eventually deleted from disk.
On top of that, there are different types of tombstones (since when running DELETE operations, there are several ways to delete data):
- Cell-level tombstones, which delete single columns
- Range tombstones, which delete a whole range of information (such as all records since last week)
- Row tombstones, which delete an entire row
- Partition tombstones, which delete an entire partition
When deleting data – especially if you have a delete-heavy use case – always prefer to delete partitions entirely because that’s much more performant from the database perspective. If you delete a lot and create many tombstones, you may end up with elevated latencies on your read path.
In order to understand why tombstones may slow down your read path, let’s re-revisit the ScyllaDB and Cassandra write path again:
- Data is written to an in-memory data structure, known as the memtable.
- The memtable eventually gets flushed to disk, and results in a SSTable, which is how your data gets persisted
- This cycle repeats
- Over time, these SSTables will accumulate
As SSTables accumulate, this introduces a problem: The more SSTables a partition contains, the more reads need to scan through these SSTables to retrieve the data we are looking for, which effectively increases the read latency. Then, with tombstones, what happens is that the database may need to scan through a large amount of data that shouldn’t be returned back to clients. By the time it manages to fetch only the live rows you need, it may have already spent too much time walking through a large tombstone run.
Over time, ScyllaDB and Cassandra will merge your SSTables via a process known as compaction, which will improve the latencies. However, depending on how many tombstones are present in the output, latency may still suffer. In the following example, it took 6 seconds for the database to reply back with a single live row in a partition with around 9 million range tombstones.
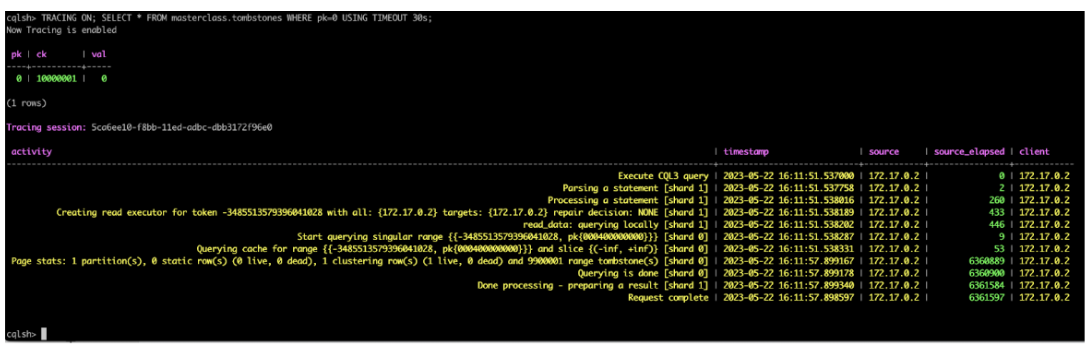
In the following extreme example, the partition in question was simply unreadable, and the database would timeout whenever trying to read from it.
cqlsh> TRACING ON; SELECT * FROM masterclass.tombstones WHERE pk=0;
ReadTimeout: Error from server: code=1200 [Coordinator node timed out waiting for replica nodes' responses] message="Operation timed out for masterclass.tombstones - received only 0 responses from 1 CL=ONE." info={'received_responses': 0, 'required_responses': 1, 'consistency': ONE}
cqlsh>
Diagnosing and Preventing Data Modeling Mistakes with ScyllaDB
Finally, let’s talk about some of the ways to prevent or diagnose some of these mistakes becuase…trust me…you might end up running into them. Many before you already did. 🙂 To provide specific examples, we’ll use ScyllaDB, but you can accomplish many of the same things with other databases.
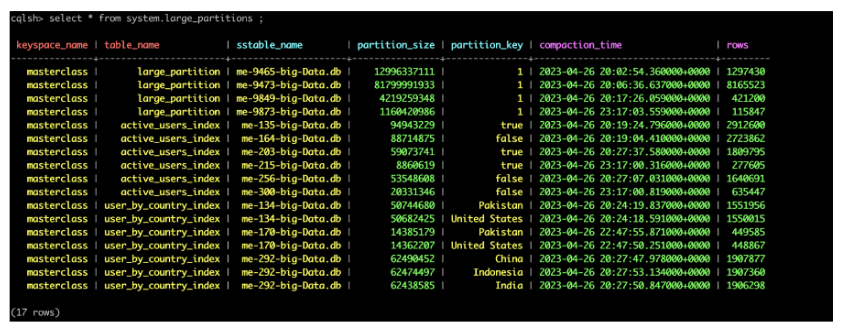
Finding Large Partitions / Cells / Collections
ScyllaDB has several system tables that record whenever large partitions, cells or collections are found. We even have a large partition hunting guide you can consult if you ever stumble upon that problem. Below, you can see an example of the output of a populated large_partitions table:
Addressing Hot Spots
As mentioned previously, there are multiple ways to identify and address hot spots. When in doubt of which partition may be causing you problems, run the nodetool toppartitions command under one of the affected nodes to sample which keys are most frequently hit during your sampling period:
nodetool toppartitions <keyspace> <table> <sample in ms>
If hot partitions are often a problem to you, ScyllaDB allows you to specify per partition rate limits, after which the database will reject any queries that hit that same partition. And remember that retry storms may cause hot spots, so ensure that your client-side timeouts are higher than the server-side timeouts to keep clients from retrying queries before the server has a chance to process them.
Addressing Hot Shards
Remember per-shard imbalances that may introduce contention in your cluster? You can use monitoring to identify whether the affected shards are on the coordinator or the replica side. If the imbalance is just on the coordinator side, then it likely means that your drivers are not configured correctly. However, if it affects the replica side, then it means that there is a data access pattern problem that you should review.
Depending on how large the imbalance is, you may configure ScyllaDB to shed requests past a specific concurrency limit. ScyllaDB will shed any queries that hit that specific shard past the number you specify. To do this, you use:
--max-concurrent-requests-per-shard <n>
And of course, make use of tracing, which can be user defined, probabilistic, slow query logging, and many other tracing options that you can try which may be the best fit for your problem.
Using Tombstone Eviction
Ensure that your tombstone eviction is efficient to avoid slowing down your read path, especially when your use case heavily relies on deletes! Everything starts with selecting the right compaction strategy for your use case, and reviewing your DELETE patterns. Remember: Deleting a partition is much more performant than deleting a row, or a cell, for example.
ScyllaDB’s Repair-based Tombstone Garbage Collection feature allows you to tell the database how to evict tombstones. We also introduced the concept of empty replica pages. This allows ScyllaDB to hint to the driver to wait for a longer period of time before receiving live data (while it may be scanning through a potentially long tombstone run).
Learn More – On-Demand NoSQL Data Modeling Masterclass
Want to learn more about NoSQL data modeling best practices for performance? Catch our NoSQL data modeling masterclass – 3 hours of expert instruction, now on-demand (and free).
Designed for organizations migrating from SQL to NoSQL or optimizing any NoSQL data model, this masterclass will assist practitioners looking to advance their understanding of NoSQL data modeling. Pascal Desmarets (Hackolade), Tzach Livyatan (ScyllaDB) and I team up to cover a range of topics, from building a solid foundation on NoSQL to correcting your course if you’re heading down a dangerous path.
You will learn how to:
- Analyze your application’s data usage patterns and determine what data modeling approach will be most performant for your specific usage patterns.
- Select the appropriate data modeling options to address a broad range of technical challenges, including benefits and tradeoffs of each option
- Apply common NoSQL data modeling strategies in the context of a sample application
- Identify signs that indicate your data modeling is at risk of causing hot spots, timeouts, and performance degradation – and how to recover
- Avoid the data modeling mistakes that have troubled some of the world’s top engineering teams in production