
The ScyllaDB team is pleased to announce the release of ScyllaDB Monitoring Stack 2.0
ScyllaDB Monitoring is an open source stack for Monitoring ScyllaDB Enterprise and ScyllaDB Open Source, based on Prometheus and Grafana. ScyllaDB Monitoring 2.0 stack supports:
- ScyllaDB Open Source versions 2.1, 2.2, 2.3
- ScyllaDB Enterprise versions 2017.x and 2018.x
- ScyllaDB Manager 1.1
ScyllaDB Monitoring 2.0 brings many improvements, both in dashboard usability and the underlying stack, in particular, moving to a new version of Prometheus. Please read the Monitoring upgrade guide carefully before upgrading.
Enterprise users are welcome to contact us for proactive help in the upgrade process.
Open Source users are welcome to use the User Slack or User Mailing list for any questions you may have.
New in Monitoring 2.0
- Move to Prometheus version 2.3.2.
ScyllaDB Monitoring stack 1.0 was based on Prometheus 1.x. Moving to Prometheus 2.x brings many improvements, mostly in the storage format. Note that Prometheus 2.x is not backward compatible with Prometheus 1.x, which can make the monitoring stack upgrade process more complex. More here. - Support for Multi-cluster and multi-DC dashboards
The Prometheus target files contain mapping information to map nodes to their respective data centers (DCs) and clusters. You can then use Prometheus to filter charts on the dashboard for either the cluster or DC by choosing DC or Cluster from the drop-down multi-select buttons. This is very useful in cases where you are using one monitoring stack to monitor more than one cluster.
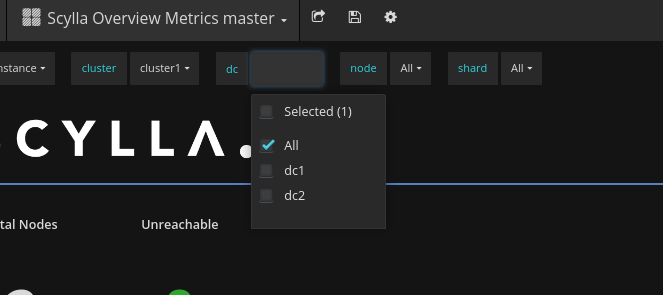
Example from prometheus/scylla_servers.yml, monitoring two clusters (cluster1, cluster2), the first with two DCs (dc1, dc2)
- targets:
- 172.17.0.1:9180
- 172.17.0.2:9180
labels:
cluster: cluster1
dc: dc1
- targets:
- 172.17.1.1:9180
- 172.17.2.2:9180
labels:
cluster: cluster1
dc: dc2
- targets:
- 172.17.10.1:9180
- 172.17.10.2:9180
labels:
cluster: cluster2
The same applies to prometheus/node_exporter_servers.yml, with node_exporter port (9100)
Note that the Monitoring stack uses the data provided in the target file (or service discovery), and not the ScyllaDB cluster topology as presented in “nodetool status”. We plan to fix this gap in a future release. #139
- Identify nodes by their IP.
Node IPs are replacing hostname as node identifiers in all dashboards. This unifies the identifiers of ScyllaDB and node_exporter(OS level) metrics. #244 - Support for ScyllaDB Open Source 2.3.
Use start-all.sh -v 2.3 to start with ScyllaDB 2.3 Grafana dashboards. You can use multiple dashboards at the same time, for example,start-all.sh -v 2.2,2.3The following dashboards are available:
- ScyllaDB Overview Metrics 2.3
- ScyllaDB CPU Per Server Metrics 2.3
- ScyllaDB Per-Server Disk I/O 2.3
- ScyllaDB Per Server Metrics 2.3
- Accept any instance name. Characters such as underscore and colon may be used for instance names for example, “127.0.0.1:9180” is a valid instance name. #351
Related Links