ScyllaDB 2.3 was just recently released, and you can read more about that here. Aside from the many interesting feature developments like improved support for materialized views and hardware enablement like native support for AWS i3.metal baremetal instance, ScyllaDB 2.3 also delivers even more performance improvements on top of our already industry-leading performance.
Most of the performance improvements center around three pillars:
- Improved CPU scheduling, with more work being tagged and isolated
- The result of a diligent search for latency-inducing events, known as reactor stalls, particularly in the ScyllaDB cache and in the process of writing SSTables
- A new, redesigned I/O Scheduler that aims to provide lower latencies at peak throughput for user requests
In this article we will look into performance benchmark comparisons between ScyllaDB 2.2 and ScyllaDB 2.3 that should highlight those improvements. The results show that ScyllaDB 2.3 improves the tail latencies for CPU-intensive workloads by about 20% in comparison to ScyllaDB 2.2 while I/O-bound read latencies are up to 85% better in ScyllaDB 2.3.
CPU-Intensive mixed workload
| Read Latency | ScyllaDB 2.2 | ScyllaDB 2.3 | Improvement |
| average | 1.5ms | 1.4ms | 7% |
| p95 | 2.7ms | 2.5ms | 7% |
| p99 | 4.1ms | 3.3ms | 20% |
| p99.9 | 7.7ms | 5.8ms | 25% |
Table 1: Client-side read latency comparison between ScyllaDB 2.2 and ScyllaDB 2.3. The average and 95th percentiles are virtually identical. But the higher percentiles are consistently better
| Write Latency | ScyllaDB 2.2 | ScyllaDB 2.3 | Improvement |
| average | 1.2ms | 1.2ms | 0% |
| p95 | 2.0ms | 2.0ms | 0% |
| p99 | 3.1ms | 2.8ms | 10% |
| p99.9 | 6.3ms | 5.6ms | 11% |
Table 2: Client-side write latency comparison between ScyllaDB 2.2 and ScyllaDB 2.3. Writes are not fundamentally faster, therefore there is no improvement in average and 95th percentile latencies. But as we make progress with the ScyllaDB CPU Scheduler and fix latency-inducing events, higher percentiles like the 99th and 99.9th percentiles are consistently better.
For this benchmark, we have created two clusters of three nodes each using AWS i3.8xlarge (32 vCPUs, 244GB RAM). In each cluster, we populated 4 separate tables with 1,000,000,000 keys each with a replication factor of three. The data payload consists of 5 columns of 64 bytes each, yielding a total data size of approximately 300GB per table, or 1.2TB for the four tables.
After population, we ran a full compaction to make the read comparison fair, and then ran a cache warmup session of 1 hour and started four pairs of clients (total of 8). Each pair of clients works a different table and has:
- a reader client issuing QUORUM reads at a fixed throughput of 20,000 reads/s using a gaussian distribution
- a writer client issuing QUORUM writes at a fixed throughput of 20,000 reads/s using the same gaussian distribution as the reads.
The gaussian distribution is chosen so that after the warm-up period we will achieve high cache hit ratios (> 96%) making sure that we exercise the CPU more than we exercice the storage. Over the four tables, this workload will generate 80,000 reads/s and 80,000 writes/s for a total of 160,000 ops/s.
To showcase the improvement, we can focus on one of the read-write pairs operating in a particular table and look at their client-side latencies. The results are summarized in Table 1, for the read results, and Table 2 for the write results. As we would expect, the underlying cost of read and write requests didn’t change between ScyllaDB 2.2 and ScyllaDB 2.3 so there is not a lot of difference in the lower percentiles. But as we deliver improvements in CPU Scheduling and hunting down latency inducing events, we can see those improvements reflected in the higher percentiles.
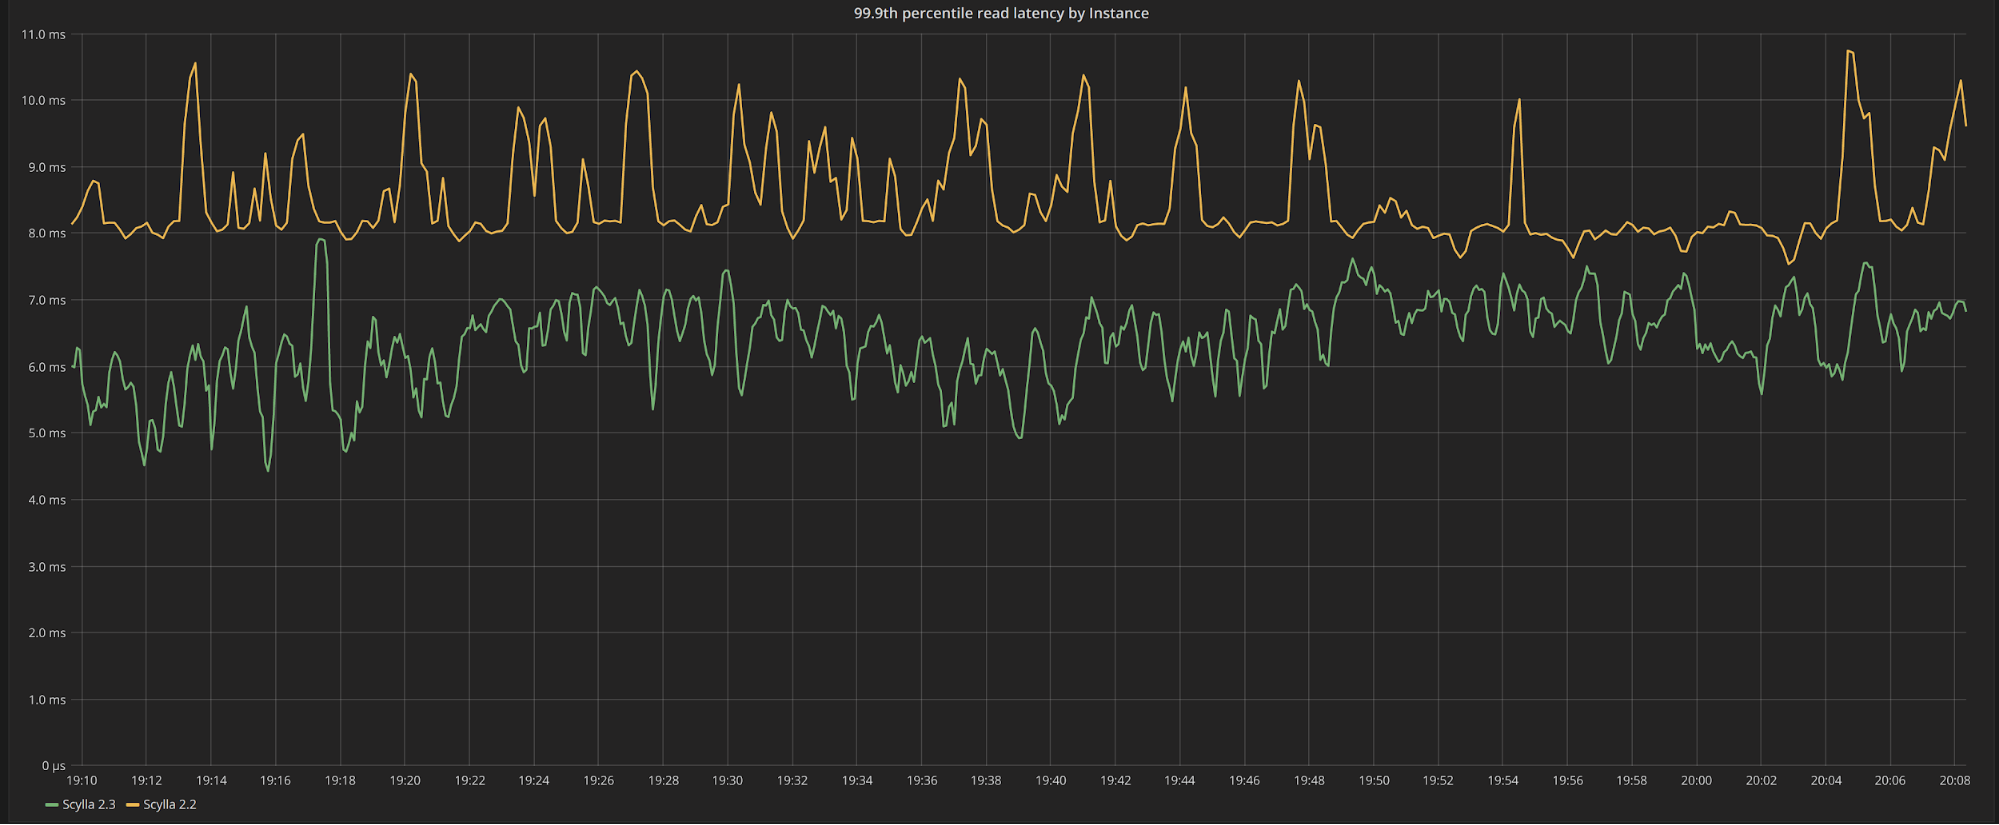
The clients will report the latency percentiles over the entire one hour run. It is more enlightening to look at how the tail latencies behave over time. In Figure 1 we can see the 99.9th percentile read latencies, measured every 30 seconds for the entire run. We can see that ScyllaDB 2.3 yields consistently lower latencies than ScyllaDB 2.2.
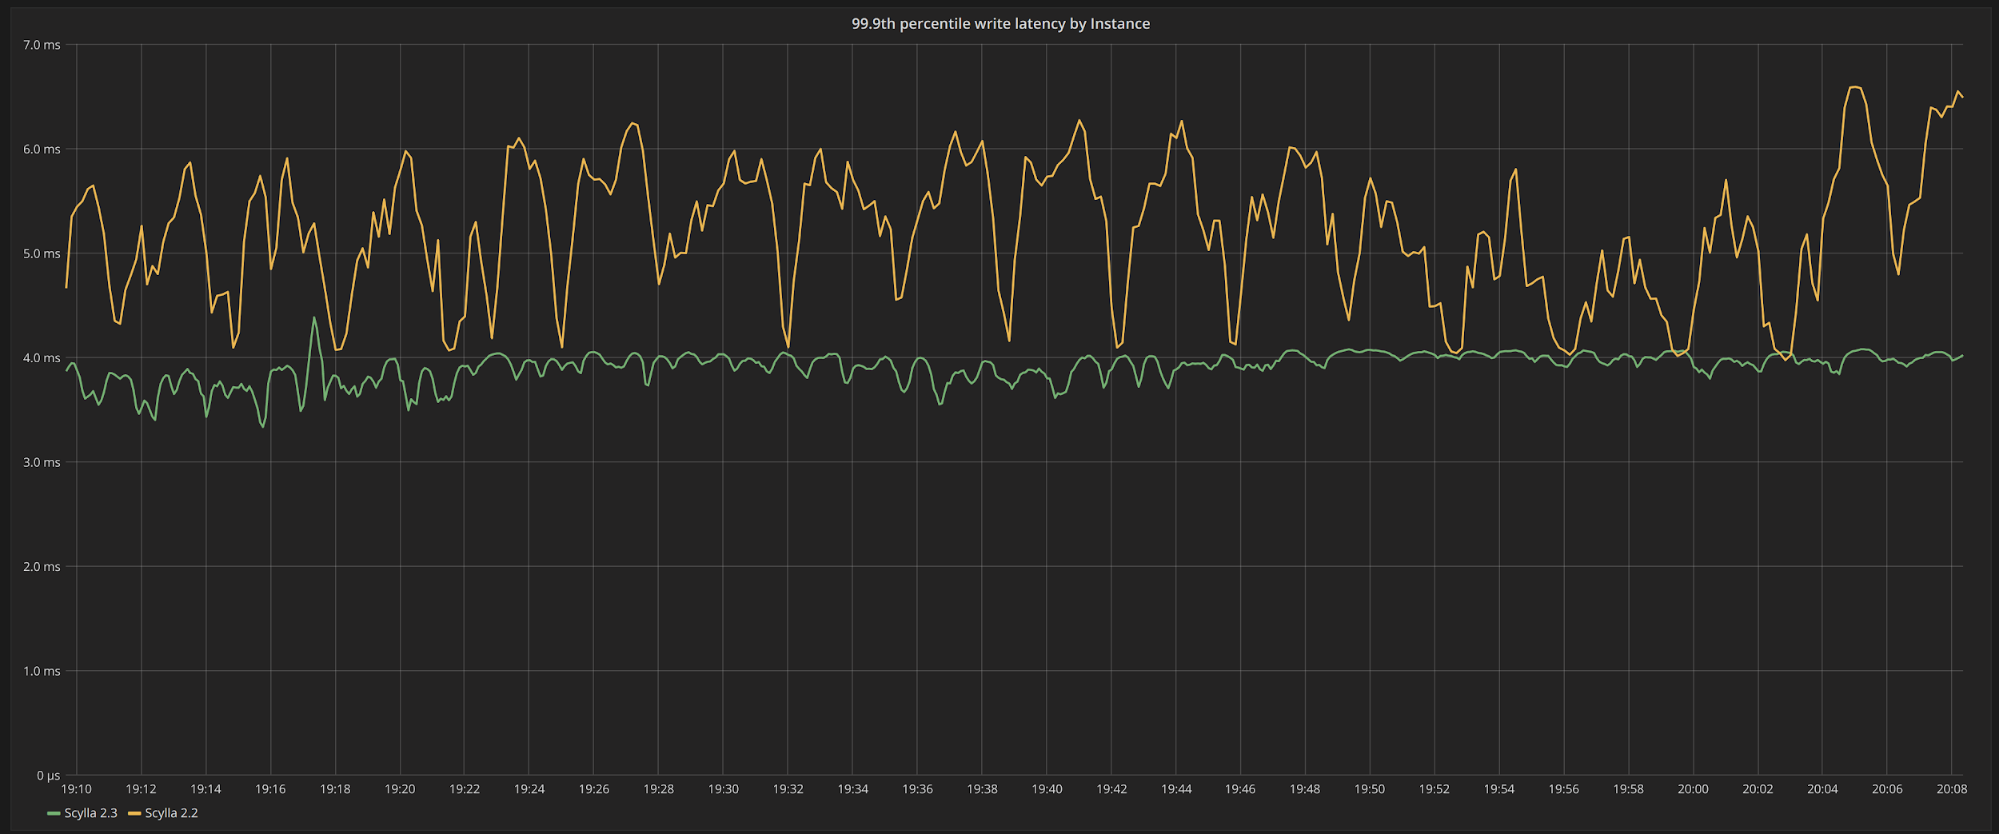
Figure 2 shows a similar scenario for writes. While the 99.9th percentile for writes fluctuate between 4ms and 6ms, they sit tightly at the 4ms mark for ScyllaDB 2.3. Since ScyllaDB’s write path issues no I/O operation and happens entirely in memory for this workload, we can be sure that the improvements seen in this run are due entirely to changes in CPU scheduling and fixing latency-inducing events.

Figure 1: Server-side, 99.9th percentile read latency over the entire execution during constant throughput workload served from cache. ScyllaDB 2.3 (in green) exhibits consistently lower latencies than ScyllaDB 2.2 (in yellow)

Figure 2: Server-side, 99.9th percentile write latency over the entire execution during constant throughput workload. As I/O operations are not present in the write foreground path, the improvement in latency seen in ScyllaDB 2.3 (in green) as compared to ScyllaDB 2.2 (in yellow) is entirely due to CPU improvements.
IO-bound read-latencies workload during major compactions
| ScyllaDB 2.2 | ScyllaDB 2.3 | Improvement | |
| average | 8.4ms | 6.0ms | 40% |
| p50 | 5.6ms | 3.1ms | 80% |
| p95 | 15ms | 8ms | 85% |
| p99 | 67ms | 63ms | 6.3% |
Table 3: read latency distributions in ScyllaDB 2.2 and ScyllaDB 2.3 during a major compaction. The tail latencies are about the same, as we expect those to be ultimately determined by the storage technology. But the lower percentiles are improved up to 85% for ScyllaDB 2.3 as the I/O Scheduler is more capable to uphold latencies for foreground operations in the face of background work
In this benchmark, we are interested in understanding how read latencies behave in the face of background operations, like compactions, that can bottleneck the disk. Because the disks are relatively slow, peaking at 162MB/s, compactions can easily reach that number by themselves. Read requests that will need to access the storage array can be sitting behind the compaction requests in the device queue and incur added latencies. This is the scenario that the new I/O Scheduler in ScyllaDB 2.3 improves.
We have created two clusters of three nodes each, using AWS c5.4xlarge (16 vCPUs, 32GB RAM) with an attached 3TB EBS volume, amounting to 9000 IOPS and 162MB/s, to mimic a situation where the user is bound to slower than NVMe storage. This is a fairly common situation with environments doing medium-size deployments on premises with older SSD devices.
We populated both the ScyllaDB 2.2 the ScyllaDB 2.3 cluster with a key-value schema in a single table with 220,000,000 keys using a replication factor of three. The data payload consists of values that are 1kB in size, yielding a total data size of approximately 200GB— much larger than the memory in the instance.
After starting a major compaction, we issue reads at a fixed throughput of 5,000 reads/s with consistency level of ONE for both ScyllaDB 2.2 and ScyllaDB 2.3. The keys to be read are drawn from a uniform distribution, and since the data set is larger than memory the cache hit ratio is verified to be at most 3%, meaning that those reads are served from disk.
Table 3 summarizes the results seen from the perspective of the client. For this run, we don’t expect a lot of changes in the high tail latencies as this will likely be determined by the storage characteristics. But we can see that ScyllaDB 2.3 shows stark improvements in the lower percentile latencies— with the 95th percentile being 85% better than ScyllaDB 2.2, as well as the average.
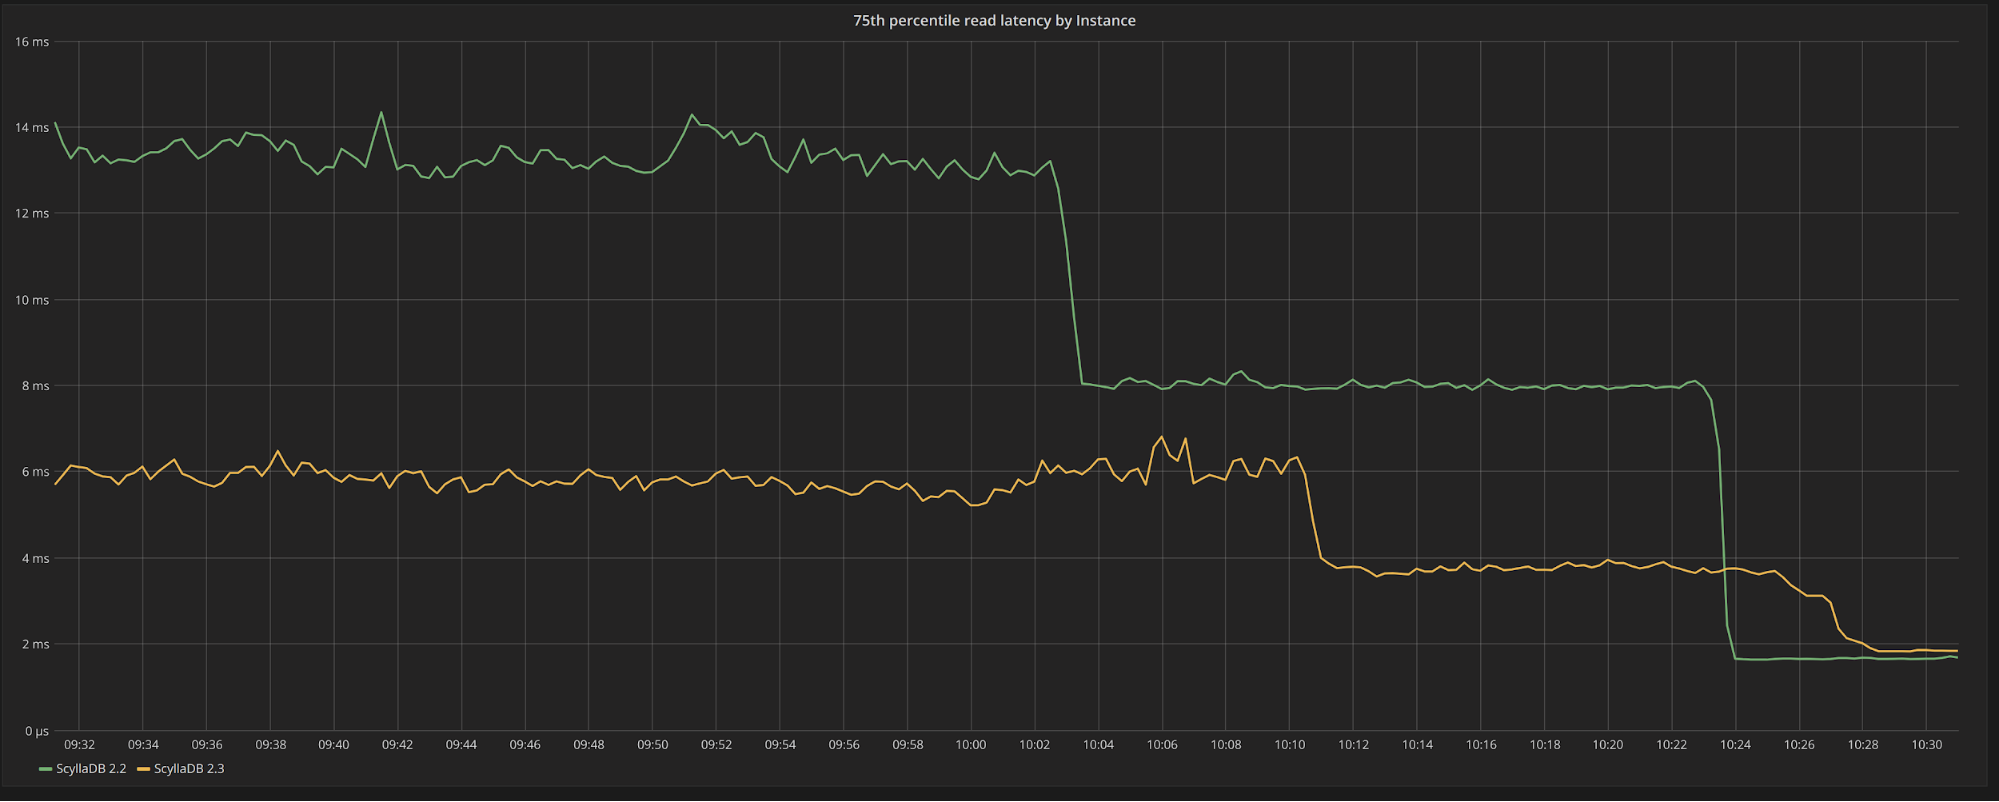
In Figure 3, we can see the 75th percentile comparative latency over time for ScyllaDB 2.2 and ScyllaDB 2.3. One interesting thing to notice is that some of the compactions finish a bit earlier for ScyllaDB 2.2. With some of the reads now having to read from fewer SSTables and not having to dispute bandwidth with compactions, both versions see a decrease in latency. But the decrease in latency is less pronounced for ScyllaDB 2.3, meaning it was already much closer to the baseline latencies during the compaction. As the reads are not, themselves, cheaper, both versions will eventually reach the same latencies.

Figure 3: 75th percentile read latency for ScyllaDB 2.2 (in green) vs ScyllaDB 2.3 (in yellow). ScyllaDB performs much better during compactions.
Aside from noticing the performance difference between those two versions, it is helpful to notice that the new I/O Scheduler in ScyllaDB 2.3 solves one long standing configuration nuisance and by itself, simplifies deployments a lot. The setup utility scylla_io_setup is known to produce results that vary considerably between disks, even if the disks have the same specifications. This confuses users and adds an unnecessary manual step to get those files to agree. As we show in Table 4, this is no longer the case with ScyllaDB 2.3. The differences between the nodes are minimal.
| Node1 | Node2 | Node3 | |
| ScyllaDB 2.2 | --max-io-requests=1308 |
--max-io-requests=12--num-io-queues=3 |
--max-io-requests=8--num-io-queues=2 |
| ScyllaDB 2.3 | read_iops: 9001read_bandwidth: 160MBwrite_iops: 9723write_bandwidth: 162MB |
read_iops: 9001read_bandwidth: 160MBwrite_iops: 9723write_bandwidth: 162MB |
read_iops: 9001read_bandwidth: 160MBwrite_iops: 9720write_bandwidth: 162MB |
Table 4: I/O configuration properties in ScyllaDB 2.2 and ScyllaDB 2.3 For ScyllaDB 2.2, this is /etc/scylla.d/io.conf. For ScyllaDB 2.3, this is /etc/scylla.d/io_properties.yaml. ScyllaDB 2.2 uses a statistical process that is prone to errors and differences. Often times those parameters disagree even if the disks are similar, and the users have to either live with it or manually adjust the parameters. In ScyllaDB 2.3, the process generates more detailed and consistent results and the differences are minimal.
Since the ScyllaDB 2.2 nodes don’t agree on their I/O properties, we have manually changed them so that they all look the same. The configuration shown in Table3 for Node2 was chosen as the one to use, being the one in the middle between all three.
Conclusion
ScyllaDB 2.3 ships with many feature improvements like large partition detection, enhancements to materialized views and secondary indexes and more. But it also brings performance improvements for the common case workloads that are a result of our always ongoing effort to bring consistently low latencies for our users.
We demonstrated in this article that latencies are improved in ScyllaDB 2.3 for disk-bound workloads due to the new improved I/O Scheduler, leading to up to 85% better latencies. Workloads that are not disk-bound, such as the ones executed in fast NVMe like the AWS I3 instances also show latency improvements, mostly visible in the higher percentile latencies, as a result of incremental improvements in the CPU scheduler and diligent work to identify and fix latency inducing events.
Test commands used in the benchmarks:
For the CPU-intensive write workload
Population:
First we create the schema – four keyspaces to be targeted in parallel:
for i in 1 2 3 4; \

do cassandra-stress write \

    no-warmup \

    cl=QUORUM \

    n=1 \

    -schema "replication(factor=3) keyspace=keyspace$i" \

    -mode cql3 native \

    -errors ignore \

    -node $NODES; \

done
Population is done using 4 loaders in parallel, with each loader targeting its own $KEYSPACE_ID (keyspace1..4)
cassandra-stress write \

  no-warmup \
cl=QUORUM \
  n=1000000000 \

  -schema 'replication(factor=3) keyspace=$KEYSPACE_ID' \

  -mode cql3 native \

  -rate 'threads=200' \

  -pop 'seq=1..1000000000' \

  -node $NODES \

  -errors ignore
Reads and writes start once all automatic compactions finish.
Read load command, per table:
cassandra-stress read \

  no-warmup \
cl=QUORUM \
duration=180m \
-schema 'keyspace=$KEYSPACE_ID replication(factor=3)' \
-mode cql3 native \
-rate 'threads=200 limit=20000/s' \
-errors ignore \
-pop 'dist=gauss(1..1000000000,500000000,5000000)' \
-node $NODES
Write load command, per table:
cassandra-stress write \

  no-warmup \

   cl=QUORUM \

   duration=180m \

   -schema 'keyspace=$KEYSPACE_ID replication(factor=3)' \

   -mode cql3 native \
   -rate 'threads=200 limit=20000/s' \

   -errors ignore \

   -pop 'dist=gauss(1..1000000000,500000000,5000000)' \

   -node $NODES
For the I/O-intensive workload:
Population
First we created the schema, then we used four nodes to write the population into the database, with each loader writing a sequential 55 million keys part of the entire 220 million keys population:
Schema creation
cassandra-stress write no-warmup \

  n=1 \
cl=QUORUM \
  -schema 'replication(factor=3)' \

  -mode cql3 native \
-errors ignore \
-node $NODES
Population commands
Loader 1
cassandra-stress write no-warmup \

   CL=ALL \

   n=55000000 \
-pop 'seq=1..55000000' \
-col 'size=FIXED(1024) n=FIXED(1)' \
-schema 'replication(factor=3)' \
-mode cql3 native \
-errors ignore \
-node $NODES \
-rate 'threads=250'
Loader 2
cassandra-stress write no-warmup \

  CL=ALL \
n=55000000 \
-pop 'seq=55000001..110000000' \
-col 'size=FIXED(1024) n=FIXED(1)' \
-schema 'replication(factor=3)' \
-mode cql3 native \
-errors ignore \
-node $NODES \
-rate 'threads=250'
Loader 3
cassandra-stress write no-warmup \

  CL=ALL \
n=55000000 \
-pop 'seq=110000001..165000000' \
-col 'size=FIXED(1024) n=FIXED(1)' \
-schema 'replication(factor=3)' \
-mode cql3 native \
-errors ignore \
-node $NODES \
-rate 'threads=250'
Loader 4
cassandra-stress write no-warmup \
CL=ALL \
n=55000000 \
-pop 'seq=165000001..220000000' \
-col 'size=FIXED(1024) n=FIXED(1)' \
-schema 'replication(factor=3)' \
-mode cql3 native \
-errors ignore \
-node $NODES \
-rate 'threads=400'
Reads and writes start once all automatic compactions finish.
Major compactions are triggered with nodetool compact concurrently in all ScyllaDB cluster nodes.
Read command:
cassandra-stress read no-warmup \

   CL=ONE \
duration=1h \
-pop 'dist=uniform(1..220000000)' \
-col 'size=FIXED(1024) n=FIXED(1)' \
-schema 'replication(factor=3)' \
-mode cql3 native \
-errors ignore \
-node $NODES \
-rate 'threads=500 limit=5000/s'


