One of the cornerstones of ScyllaDB is the I/O Scheduler, described in details at the moment of its inception in a two-part series that can be found here (part 1) and here (part 2). In the two years in which ScyllaDB has been powering mission-critical workloads in production the importance of the I/O Scheduler was solidified and as our users have attested themselves, it plays a key part in isolating workloads and delivering on our Autonomous Operations promise.
But during that same period, we identified areas in which the I/O Scheduler could be improved to provide even better latencies in a variety of situations. In this article, we will examine some of those changes that are ready in ScyllaDB’s master branch and will be soon generally available for ScyllaDB users.
A review of the I/O Scheduler
As the fundamental role of the I/O Scheduler hasn’t changed, it is helpful to review what it tries to achieve and how. It banks on the observation that modern SSDs will increase their throughput as more requests are sent down to the media, but only up to a certain point. After that, we are left with an increase in latency without a corresponding increase in throughput.
Latency increases because once we have more requests than the disk can handle, those requests become queued inside the disk itself. It is then better for the database not to send those requests to the disk in the first place, and keep them queued inside the database.
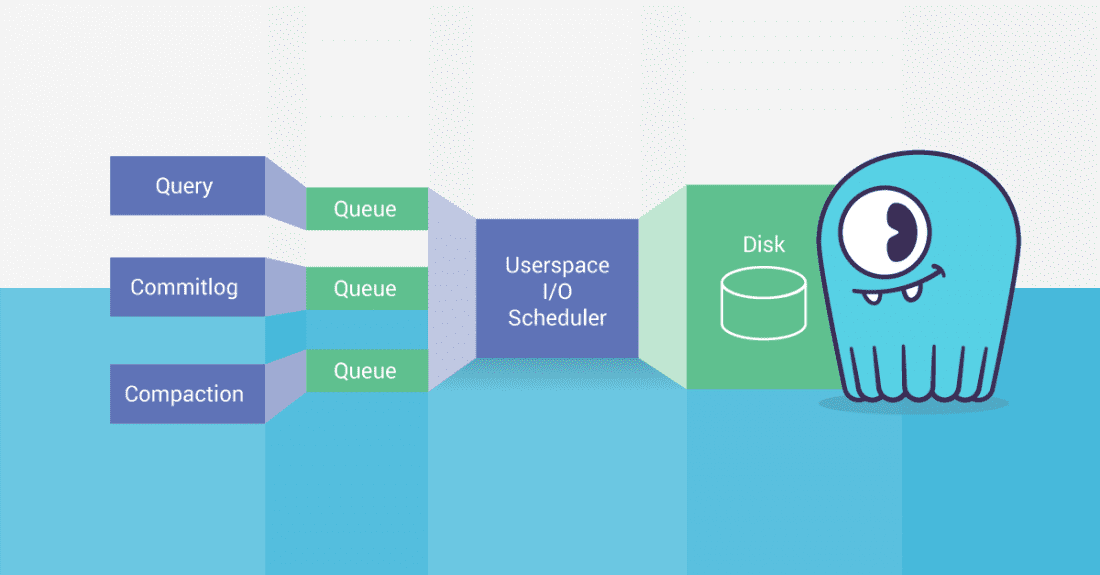
Being inside the database, ScyllaDB can then tag those requests and through prioritization, guarantee quality-of-service among the various classes of I/O requests that the database has to serve: commitlog writes, compaction reads and writes, CQL query reads, etc.
We can see that represented in Figure 1—once we find the maximum useful disk concurrency, we only allow that many requests be sent to disk.
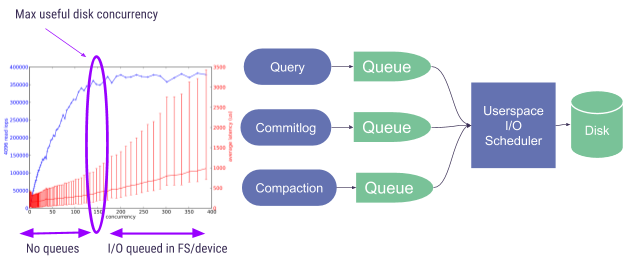
Figure 1: The ScyllaDB I/O Scheduler
Finding the maximum useful disk concurrency
To find the maximum useful disk concurrency, ScyllaDB has been using a statistical process where throughput is measured at various concurrency levels, with the goal of empirically finding a curve that looks like the one shown in Figure 1. We then try to find what is the point in which that curve flattens, or its knee and set that as the maximum useful concurrency.
While this has worked well so far, we noticed the following shortcomings:
1) It is very hard for users to reason about what that max concurrency really means. Very often people get confused believing that higher is always better and keep being puzzled that their new, faster NVMe has a lower max concurrency than their older, slower SSDs. Those things are, in fact, unrelated: NVMe are faster because the individual requests are faster, but they may or may not have a higher concurrency.
Also, when things get mistuned – which is just a fact of life in the real world, it is very hard for people to reason about what to do with that parameter. Should I lower or raise it? By how much? What should I expect? Without experimentation with the disk parameters, the users can’t really understand the disk.
2) It doesn’t differentiate between reads and writes. Many disks aren’t able to serve both reads and writes at equal speeds. There is a single parameter for the disk (–max-io-requests) and it is measured for reads. We have seen in practice disks with ratios higher than 4:1 read:write speed, meaning that for write-heavy workloads the disk gets severely overloaded and latencies get much higher than what we would like them to.
3) It doesn’t take request sizes into account. Our single parameter for maximum useful concurrency is usually discovered based on 4kB reads. But larger request take longer and have a much lower sweet spot for parallelism, meaning that at the tuned parallelism the disk also gets severely overloaded and a latency request coming right after will face long wait times.
We can see that as an example in Figure 2, where we show the response curves for the same disk, for a modern NVMe disk. At 140 4kB requests, the disk is still going strong and has not yet saturated. But with less than 20 128kB requests, we already reached saturation.
This is a common occurrence for people trying to fetch values as low as 512 bytes from the database while a large file is being written at 128kB chunks. The I/O Scheduler will still guarantee that the latencies are bounded and under control, but they could be much lower.


Figure 2: Trying to estimate the maximum useful concurrency for the same disk, at 4kB and 128kB requests.
A key observation
To understand how we can improve those issues, it is helpful to understand how ScyllaDB handles its tasks. Computational tasks are executed without any I/O being dispatched or consumed, and then periodically all the I/O that is generated during the previous period is dispatched down to the Operating System. We call that period the task quota since it represents the maximum amount of time for which a task can run without being preempted by anybody.
With that information in mind, there is a little theoretical observation that we can note that make our lives a little easier. To our rescue, comes Little’s Law for closed systems. It states that:
X = E[t] * T,
Where X is the concurrency, E[t] is the expected time to complete a request (average latency), and T is the throughput. This is a key observation, for the following reasons:
1) If we know what is the maximum throughput of the device, then we can know that increasing concurrency can only increase latency. Conversely, reducing concurrency will reduce latency, provided that this reduction does not result in a decrease in throughput.
2) In steady state, we can only do I/O at each task_quota_ms. What that means is that even if our requests are as fast as a couple of microseconds, we very likely won’t be able to consume them after at least one task quota.
Assuming, for example, a task quota of 0.5ms, and a single CPU driving
1M IOPS, we can write:
X = 0.5ms * 1M IOPS = 500
In other words, if we allow 500 requests to be sent to the disk concurrently, they are expected to take 0.5ms to complete. Even if the individual request is much faster than that we are still okay—we wouldn’t be able to consume it sooner. In practice, we can include a factor (current 1.5) in the calculation, since not all requests will be finished after the task quota elapses (Little Law’s deals with averages). We want to keep the disk busy at all times, so we will slightly overshoot.
From the get-go, this approach addresses the first problem listed in the introduction of this article: users can very easily reason about throughput. If things get mistuned or the disks deteriorate, it is very easy to, by observation, find out what the real throughput is and adjust. Users can very easily reason about what does it mean to increase the throughput by a certain margin or conversely decreasing it. There is no statistical process involved and in some cases, we might not even need to do any measurements—if the information the vendors provide is to be trusted.
But the other problems can also be addressed by noting that Little’s Law is valid for the throughput of any process: we can state read throughput and write throughput, or state them in MB/s, and just limit the number of requests sent to disk based on which one bottlenecks first.
For example, my local SSDs, a Samsung SSD 850 PRO can do 95k IOPS and 512MB/s for reads (and slightly less for writes). 95k/s 4kB requests only amount to 371 MB/s. If all requests are 4kB in size we will hit the IOPS bottleneck but not the throughput bottleneck. But if the requests are larger, 128kB in size, we will hit the bandwidth bottleneck while doing 4,000 IOPS.
While the current I/O Scheduler would keep 32 requests in parallel for all of those situations, the proposed version would (assuming a 0.5ms task quota) keep
x = 95 kIOPS * 1.5 * 0.5 ms = 70 concurrent 4kB requests, and
y = 512 MB * 1.5 * 0.5 ms = 402kB, or ~3 concurrent 128kB requests.
Note how in the first scenario, raw disk latency is likely to be higher than what the current I/O Scheduler produces – but we are assuming we won’t consume before the next task quota anyway. But in the second scenario, latencies will be much lower than what the current I/O Scheduler produces.
Results
To demonstrate this in practice we ran a highly parallel write workload with 128kB write requests being sent continuously against a latency-bound 4kB read workload that dispatches requests every 10ms with a parallelism of one. All of that happens with some CPU load in the background.
The results are shown in Table 1. We can see that this proposal is able to keep throughput at the around same max level as before, but decrease latencies in every percentile for the latency requests–with the averages going down almost 8-fold.
| Before | After | |||
| 128 kB writes | 4kB reads | 128kB writes | 4kB reads | |
| Throughput | 518 MB/s | 219 KB/s | 514 MB/s | 347 KB/s |
| Avg lat | 24ms | 8ms | 24ms | 1ms |
| 95th lat | 24ms | 9ms | 24ms | 2ms |
| 99th lat | 36ms | 12ms | 35ms | 6ms |
| 99.9th lat | 43ms | 15ms | 36ms | 7ms |
Table 1: Impact on latencies for running the improved I/O Scheduler. 128kB writes run with high parallelism continuously, and 4kB reads run with a parallelism of one, dispatched every 10ms.
Conclusion
In its two years of existence, the ScyllaDB I/O Scheduler has been helping us provide great latencies without artificially throttling processes so that everything can proceed at full speeds. But the original process of determining the disk concurrency can result in latencies that are, while bounded, larger than they could be.
ScyllaDB 2.3 will be released with the changes described here and will reduce latencies even further for users with latency sensitive workloads.
Next Steps
- Learn more about ScyllaDB from our product page.
- See what our users are saying about ScyllaDB.
- Download ScyllaDB. Check out our download page to run ScyllaDB on AWS, install it locally in a Virtual Machine, or run it in Docker.
- Take ScyllaDB for a Test drive. Our Test Drive lets you quickly spin-up a running cluster of ScyllaDB so you can see for yourself how it performs.