When we released ScyllaDB 2.2, we announced that it includes many performance (throughput, latency) improvements. We’re glad for the opportunity to quantify some of those improvements. In a recent post, we described a large partition use case with the improved query paging of ScyllaDB 2.2. In this blog post, we will put ScyllaDB 2.2 to the test against ScyllaDB 2.1, comparing the two versions with read and write workloads. This post is a collaborative effort between Larisa Ustalov and myself, with the help of many others.
Highlights of Our Results:
- Read benchmark: 42% reduction in 99th percentile latency with 1kB cells
- Write benchmark: 18% throughput increase
Workloads Tested
We tested with two ScyllaDB use cases: Write and Read. Details, including a description of the workload and results of each workload, are included below.
Read Workload – Latency Test
We tested the impact of ScyllaDB 2.2 on read workload latencies, and in particular, the improvement from changing the row digest hash from md5 to xxHash #2884. To isolate the latency change, the load throughput was fixed to 80K/s, resulting with a CPU load of ~50%. You can find complete details on the test setup in the appendix below.

Source: https://docs.scylladb.com/architecture/anti-entropy/read-repair/
Results – Extracted from cassandra-stress
Latencies (lower is better)
| ScyllaDB 2.1 | ScyllaDB 2.2 | Improvement | |
| Mean latency | 2.6 ms | 1.8 ms | 23% |
| 95% latency | 4.9 ms | 3.3 ms | 32% |
| 99% latency | 7.8 ms | 4.5 ms | 42% |
ScyllaDB 2.1 – 99% latency over time: (each line represents one node in the cluster)
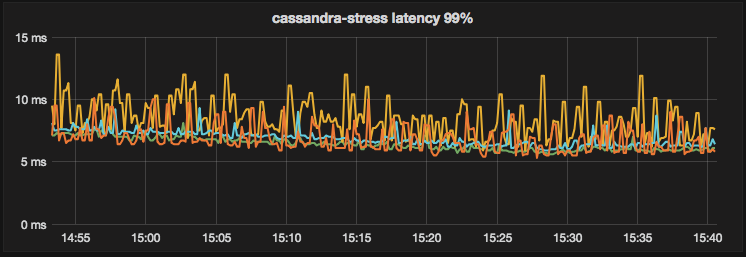
ScyllaDB 2.2 – 99% latency over time:
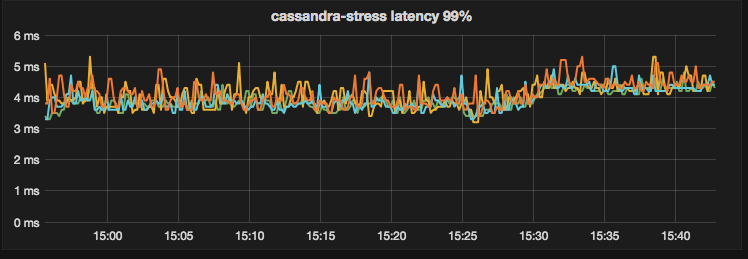
Summary: Running the same workload on ScyllaDB 2.2 results in lower read latency than ScyllaDB 2.1
Write Workload
The write workload was designed to test the effect of the new CPU controller on ScyllaDB 2.2. The impact of the controller is greater when ScyllaDB is fully loaded and needs to balance resources between background tasks, like compactions, foreground tasks, and write requests. To test that, we injected the maximum throughput, writing 500GB of data sequentially. Complete details of test setup are in the appendix below.
Results
Average operations per second for the entire test.
| ScyllaDB 2.1 | ScyllaDB 2.2 | Improvement | |
| Ops | ~354K | ~418K | +18% |
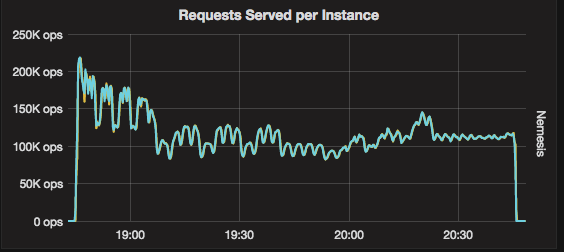
Throughput over time:
ScyllaDB 2.1
ScyllaDB 2.2
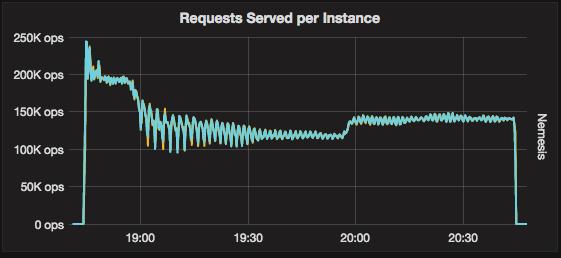
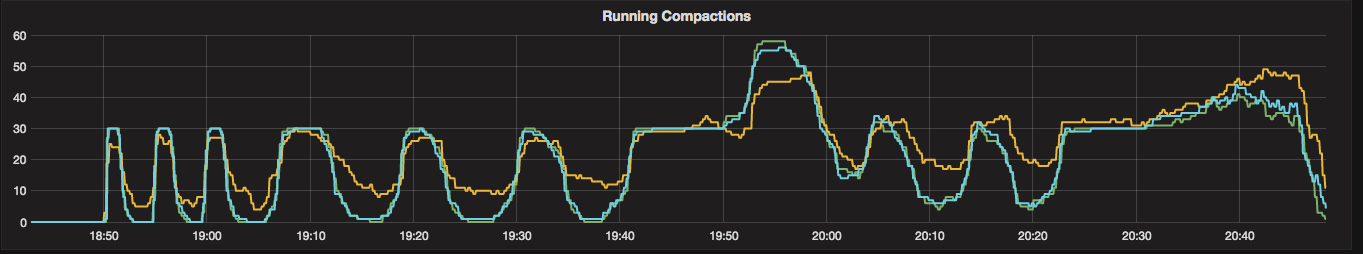
The initial decline in throughput in the first ~15 minutes is expected. As more data accumulates on the storage, compactions kick-in and take resources away from the real-time requests. The difference between the releases is the controller. In ScyllaDB 2.2, it is doing a better job of stabilizing the system and provides more consistent throughput during compactions. This effect is more evident when looking at the number of concurrent compactions. Compared to ScyllaDB 2.1, ScyllaDB 2.2 more consistently runs the same number of compactions, resulting in smoother performance.
ScyllaDB 2.1 – Number of active compactions
ScyllaDB 2.2 – Number of active compactions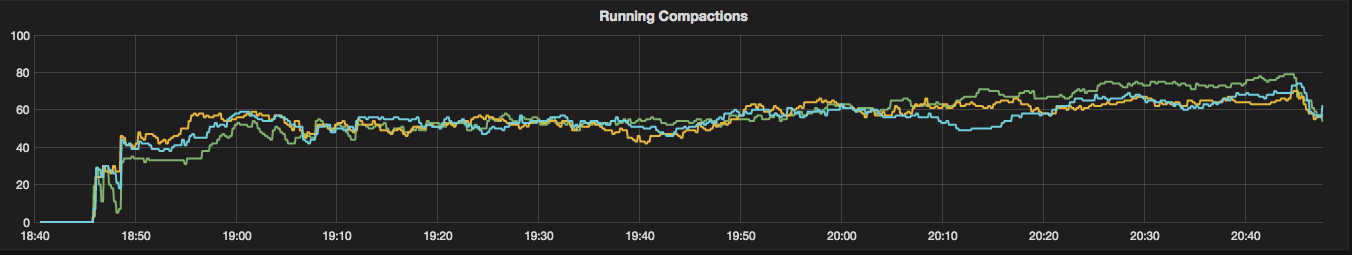
Summary: Using the same setup, ScyllaDB 2.2 can handle higher write throughput than ScyllaDB 2.1
Conclusions
Our performance comparison of ScyllaDB 2.2 and ScyllaDB 2.1 demonstrates significant improvements with write throughput and read latency for two simplistic use cases. Stay tuned for additional benchmarks of ScyllaDB 2.2 with future releases.
Next Steps
- ScyllaDB Summit 2018 is around the corner. Register now!
- Learn more about ScyllaDB from our product page.
- See what our users are saying about ScyllaDB.
- Download ScyllaDB. Check out our download page to run ScyllaDB on AWS, install it locally in a Virtual Machine, or run it in Docker.
Appendix – Test Setup
- ScyllaDB Cluster
- Nodes: 3
- Instance type: I3.8xlarge
- ScyllaDB 2.1.6 AMI (, us-east-1)
- ScyllaDB 2.2rc3 AMI (ami-917521ee, us-east-1)
- Loaders
- Servers: 4
- Instance type: c4.4xlarge
- Workloads (all of them)
- Replication Factor(RF) = 3
- Consistency Level(CL) = QUORUM
- Compaction Strategy: Size-Tiered
Read Workload
- Data: 1,000,000,000 (1 Billion) keys with 1,024 bytes each (raw data 1 TB)
cassandra-stress(c-s) command used to populate data: - 4 loaders, each running 150 threads, limit to a value – 20000/s
- cassandra-stress command used to populate the data:
cassandra-stress write no-warmup cl=QUORUM n=1000000000 -schema 'replication(factor=3)' -port jmx=6868 -mode cql3 native -rate threads=200 -col 'size=FIXED(1024) n=FIXED(1)' -pop seq=1..1000000000" - cassandra-stress command used to read the data:
cassandra-stress read no-warmup cl=QUORUM duration=100m -schema keyspace=keyspace$2 'replication(factor=3)' -port jmx=6868 -mode cql3 native -rate 'threads=150 limit=20000/s' -errors ignore -col 'size=FIXED(1024) n=FIXED(1)' -pop 'dist=gauss(1..750000000,500000000,250000000)'
Write Workload
- Date: 10^9 keys with 10^3 bytes each (raw data 1 TB)
- 4 loaders, each running 1,000 threads
- cassandra-stress command:
cassandra-stress write no-warmup cl=QUORUM duration=120m -schema keyspace=keyspace$2 'replication(factor=3)' -port jmx=6868 -mode cql3 native -rate 'threads=1000' -errors ignore -pop 'seq=1..500000000'