
In this blog post, we will look into ScyllaDB’s paging, address some of the earlier problems with it, and describe how we solved those issues in our recently released ScyllaDB 2.2. In particular, we will look at performance problems related to big partitions and how we alleviated them to improve throughput by as much as 2.5X. We will restrict ourselves to queries of a single partition or a discrete set of partitions (i.e., “IN” queries). We will address scanning queries, which return a range of partitions, in a separate post.
Prior to ScyllaDB 2.2, ScyllaDB’s paging was stateless. This meant that at the end of each page, all objects related to the query were discarded and all associated resources were freed. While this approach led to simple code when compounded with how ScyllaDB works (no page-cache or any other OS cache are used), it also led to a lot of duplicate work. Before we cover what this duplicate work is and how we can avoid it, let’s first look into what exactly paging is and how it works in ScyllaDB.
What is Paging?
Queries can return any amount of data. The amount of data that is returned is known only when the query is executed. This creates all sorts of resource management problems for the client as well as for the database. To avoid these problems, query results are transmitted in pages of limited size, one page at a time. After transmitting each page, the database stops and waits for the client to request the next one. This is repeated until the entire result set is transmitted. The size of pages can be limited by the client by limiting the number of rows that they can contain. There is also a built-in (non-optional) size limit of 1MB.
How Paging Works?
On each page, the coordinator selects a list of replicas for each partition to send read requests to. The set of replicas is selected such that it satisfies the required Consistency Level (CL). All read requests are sent concurrently. To quickly recap, the coordinator is the node that receives the query request from the client and the replicas are the nodes that have data that pertains to the subject of the query. Note that the coordinator can be a replica itself especially in cases where the client application uses a token-aware driver.
The replicas execute the read request and send the results back to the coordinator that merges them. For each partition in the list, the coordinator requests a page worth of data from the replicas. If, after merging, the merged result set has more data than the page limits, all extra data is discarded.
To be able to continue the query on the next page, the database must remember where it stopped. It does this by recording the position where the query was interrupted in an opaque (to the client) cookie called the paging state. This cookie is transmitted with every page to the client and then retransmitted by the client to the database on every page request. Since the paging state is completely opaque (just a binary blob) to the client, it can be used to store other query-related states in addition to the page end position.
At the beginning of the next page, the coordinator examines the queried partition list and drops partitions that were already read. To determine which partitions were already read, the coordinator uses the position stored in the paging-state mentioned above. It then proceeds with the query as if it were a new query, selecting the replicas, sending them the read requests, and so on. From the replicas’ perspective, each page is like a brand new query. On each page, the replicas locate all of the sources that contain data for the queried partition (memtable, row-cache, and sstables) and at the end of the page, all this work is thrown away. Note that especially in the case of sstables, this is a non-trivial amount of work that involves a fair amount of disk I/O on top of reading the actual partition data. This results in increased latency and lower throughput as the replicas are spending all of those extra CPU cycles and disk bandwidth on each page.
Making Queries Stateful
The solution is to make queries stateful. That is, don’t throw away all of the work done when initializing the query on the replicas. Instead, keep this state around until the next page and just continue where the previous one left off. This state is, in fact, an object and is called the querier. So after a page is filled, the query state (querier object) is saved in a special querier-cache. On the next page, the saved querier object is looked up and the query continues where it was left off. Note that there is a querier object created on every shard of every replica from which any of the queried partitions is read.
Although this sounds simple enough, there are quite a few details to get right in order for it to work. First off, a querier created for a certain query should not be used for another query. Different queries can have different restrictions, orderings, query times, etc. It would be nearly impossible and highly error-prone to validate all this to test whether a querier can be used for a given query. To avoid having to do this at all, each query is assigned a unique identifier at the beginning of the first page. This identifier is remembered throughout the query using the paging-state and is used as the key under which queriers are saved and looked up on replicas.
Validating the Saved State
It’s not enough to make sure that queriers are used for only the query they were created for. A lot can go wrong in a distributed database. To make sure a querier can be safely reused, a thorough validation is done on lookup to decide whether it can be reused or if it needs to be dropped and a new one should be created instead.
Each read request sent to a replica contains a read position from which it has to start reading the data. This is used to continue from where the previous page left off. On lookup, the querier’s position is matched against the request’s start position. If there is a mismatch, the querier is dropped and a new one with the correct position is created instead. Position mismatch can happen for a number of reasons — transient network partition, mismatching data, the coordinator discarding results from the previous page to avoid overfilling the page, etc.
Schema upgrades can run concurrently with ongoing reads. The coordinator will always use the current (latest) schema version for the read requests. So it is possible that a replica will receive a read request with a schema version that is more recent than that of the cached querier. To keep things simple in situations like that, the cached querier is dropped and a new one with the new schema is created instead.
Sticking to the Same Replicas
Saved queries are useful only if they are reused. To ensure this happens as much as possible, ScyllaDB will try to stick with the same set of replicas that were used to serve the first page. This is done by saving the set of replicas that served the first page in the paging-state. Then, on each subsequent page, these replicas will be preferred over other ones.
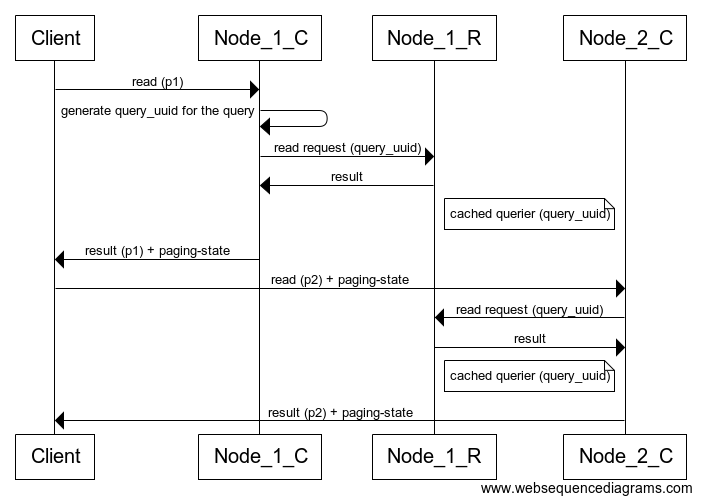
Figure 1: Simplified sequence diagram of a paged query. Note how Node_1 is both a coordinator and a replica while serving the first page. Also, note that Node_2 sticks to reading from Node_1 even though it has the data also so that the existing cached querier can be reused.
Managing Resource Consumption
Although they are inactive, cached querier objects consume resources — primarily memory, but they can also pin sstables on disk. Additionally, ScyllaDB has a reader concurrency control mechanism that limits the number of concurrently active sstable readers. Each reader has to obtain a permit in order to start reading. Cached readers will hold on to their permits, possibly preventing new readers from being created.
To keep resource consumption under control, several eviction strategies are implemented:
- Time-based cache eviction: To avoid abandoned queriers sitting in the cache indefinitely, each cache entry has a time-to-live. When this expires, it is evicted from the cache. Queriers can be abandoned due to the client abandoning the query or the coordinator switching to another replica (for example, a transient network partition).
- Memory-based cache eviction: The memory consumption of cache entries is kept under a threshold by evicting older entries when the insertion of a new one would cause it to exceed a threshold. This threshold is currently configured as 4% of the shard’s memory.
- Permit-based cache eviction: When available permits run out, older cache entries are evicted to free up permits for creating new readers.
Diagnostics
To help observe the effectiveness of stateful queries, as well as aid in finding any problems, a number of counters are added:
querier_cache_lookupscounts the total number of querier cache lookups. Not all read requests will result in a querier lookup. For example, the first page of a query will not do a lookup as there was no previous page from which to reuse the querier. The second, and all subsequent pages, however, should attempt to reuse the querier from the previous page.querier_cache_missescounts the subset of (1) where the reads have missed the querier cache (failed to find a saved querier).querier_cache_dropscounts the subset of (1) where a saved querier was found but it failed the validation so it had to be dropped.querier_cache_time_based_evictionscounts the cached entries that were evicted due to their time-to-live expiring.querier_cache_resource_based_evictionscounts the cached entries that were evicted due to a shortage of reader permits.querier_cache_memory_based_evictionscounts the cached entries that were evicted due to reaching the cache’s memory limits.querier_cache_querier_populationis the current number of querier entries in the cache.
Note:
- All counters are per shard.
- The count of cache hits can be derived from these counters as (1) – (2).
- A cache drop (3) also implies a cache hit (see above). This means that the number of actually reused queriers is: (1) – (2) – (3)
Performance
We’ve finally arrived at the part of this blog post you’ve all been waiting for! Since the primary goal of stateful queries is to improve efficiency and throughput, we made this the focus of our benchmarking tests. To gauge the throughput gains, we populated a cluster of 3 nodes with a dataset consisting entirely of large partitions, then exercised it with read-from-disk and read-from-cache workloads to find out how it fares. The nodes were n1-standard-4 (4 vCPUs, 15GB memory) GCE nodes using local SSD disks. The dataset was composed of large partitions, each having 10k rows and each row being 10KB in size. This should exercise paging well as each partition will require about 100 pages to transfer.
Read-from-disk
Let’s first look at the read-from-disk scenario. This is the more interesting one as this is the scenario where stateless queries were hurting the most. And stateful queries don’t disappoint. After measuring the throughput on a cluster running at disk speed, the version with stateful queries performed almost 2.5X (+246%) better than the one without. This is a massive improvement, indeed.
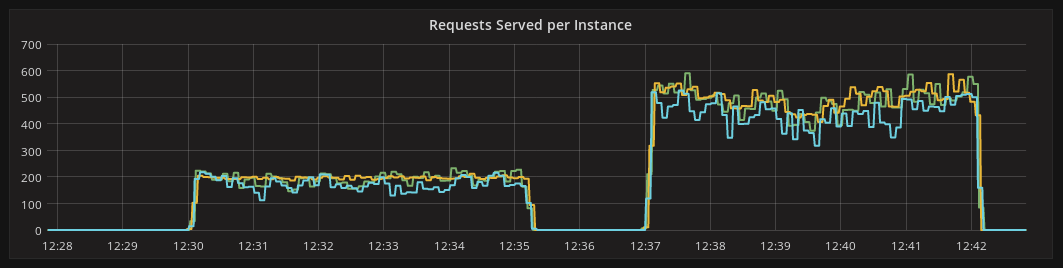
Figure 2: OPS of stateless queries (before) and stateful queries (after).
Read-from-cache
Workloads that are served from cache didn’t suffer from stateless queries as much as those served from disk. This is because cache readers are significantly cheaper to create than disk readers. Still, we were curious and wanted to also catch any potential regressions. For the read-from-cache scenario, we measured the throughput of the cluster while driving it at network speed. To our surprise, the throughput was slightly worse for the stateful queries version. After some investigation, this turned out to be caused by an extra hop introduced by sticky replicas. For clusters whose performance is limited by network bandwidth — like our test cluster — this introduces additional network traffic and thus reduces throughput. To eliminate the disturbance introduced by the additional network hop, we employed a modified Java driver that would send each page request to the same coordinator throughout the duration of an entire query (on top of selecting a coordinator that is also a replica). This ensures that no additional hop is required to stick to the same set of replicas through the query, as opposed to the current status-quo of selecting new coordinators for each page in a round-robin manner. After eliminating the extra hop, throughput improved slightly.
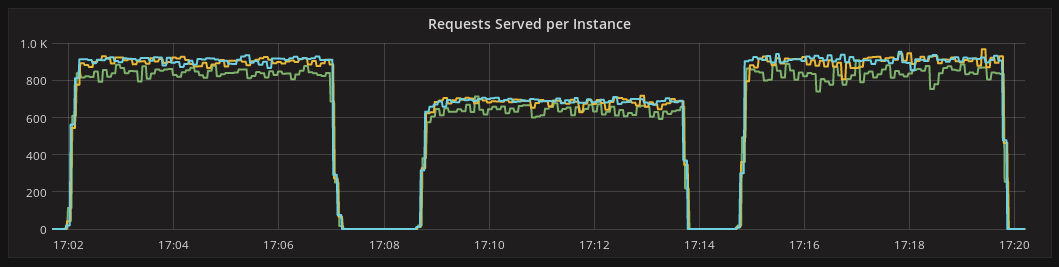
Figure 3: OPS of stateless queries (before), stateful queries (after 1) and stateful queries with sticky coordinator driver fix (after 2)
Summary
With stateful queries, the effort of preparing to serve a query is not thrown away after each page. Not having to do the significant effort of preparing the query from scratch on each page greatly improves the efficiency and thus the throughput of paged queries, especially those reading large partitions. In the case of read-from-disk queries, this throughput improvement was measured to be as much 2.5X compared to the previous stateless queries.
Next Steps