
Update: See our latest ScyllaDB vs Cassandra benchmarks
Benchmarking is no easy task, especially when comparing databases with different “engines” under the hood. You want your benchmark to be fair, to run each database on its optimal setup and hardware, and to keep the comparison as apples-to-apples as possible. (For more on this topic, see our webinar on the “Do’s and Don’ts of Benchmarking Databases.”) We kept this in mind when conducting this ScyllaDB versus Cassandra benchmark, which compares ScyllaDB and Cassandra on AWS EC2, using cassandra-stress as the load generator.
Most benchmarks compare different software stacks on the same hardware and try to max out the throughput. However, that is often the wrong approach. A better way is to think about the comparison from the user’s perspective. That is, start by considering the volume, throughput, and latency a database user needs in order to meet his or her business needs. The goal here is to gauge the resources each database needs to meet established requirements and to see how ScyllaDB and Cassandra handle the challenge.
ScyllaDB and its underlying Seastar infrastructure fully leverage powerful modern hardware. With ScyllaDB’s linear scale-up capabilities, the more cores and RAM the better, so we chose AWS EC2’s strongest instance available, i3.metal, for our ScyllaDB cluster. Cassandra, on the other hand, is limited in its ability to scale up due to its reliance on the JVM. Its threads and locks are too heavy and slow down as the number of cores grows, and with no NUMA awareness, performance will suffer. As a result, using the i3.metal instance would not yield optimal results for Cassandra (read more about Cassandra’s sweet spot here). To make a fair comparison with Apache Cassandra, we created a 40-node Cassandra cluster on i3.4xlarge instances. This recreates a use case we saw for of one of our Fortune-50 accounts.
We defined a workload of 38.85 billion partitions, replicated 3 times, 50:50 read/write ratio, a latency of up to 10 msec for the 99th percentile, and throughput requirements of 300k, 200k, and 100k IOPS.
We used our load generator, cassandra-stress, to populate each database with approximately 11TB (38.85B partitions), using the default cassandra-stress schema and RF=3 (see Appendix-A for the schema and cassandra-stress commands used in this benchmark). Once population and compaction completed, we restarted the ScyllaDB /Cassandra service on all nodes, making sure the actual tests started with a cold cache and after all compactions were finished.
We tested the latency for various throughputs to have a more comprehensive comparison. We used a Gaussian distribution (38.85B partitions, Median: 19.425B and Standard Deviation: 6.475B) in all latency tests to achieve as much disk access as possible instead of reading from RAM. Each of the tests ran for 90 minutes to make sure we were in a steady state.
Conclusions and Summary
- Compared to the 40-node Cassandra cluster, the ScyllaDB 4-node cluster provided:
- 10X reduction in administration overhead. This means ALL operations such as upgrade, logging, monitoring and so forth will take a fraction of the effort.
- 2.5X reduction in AWS EC2 costs. In fact, had we been more strict with Cassandra, we would have increased its cluster size to meet the required latency.
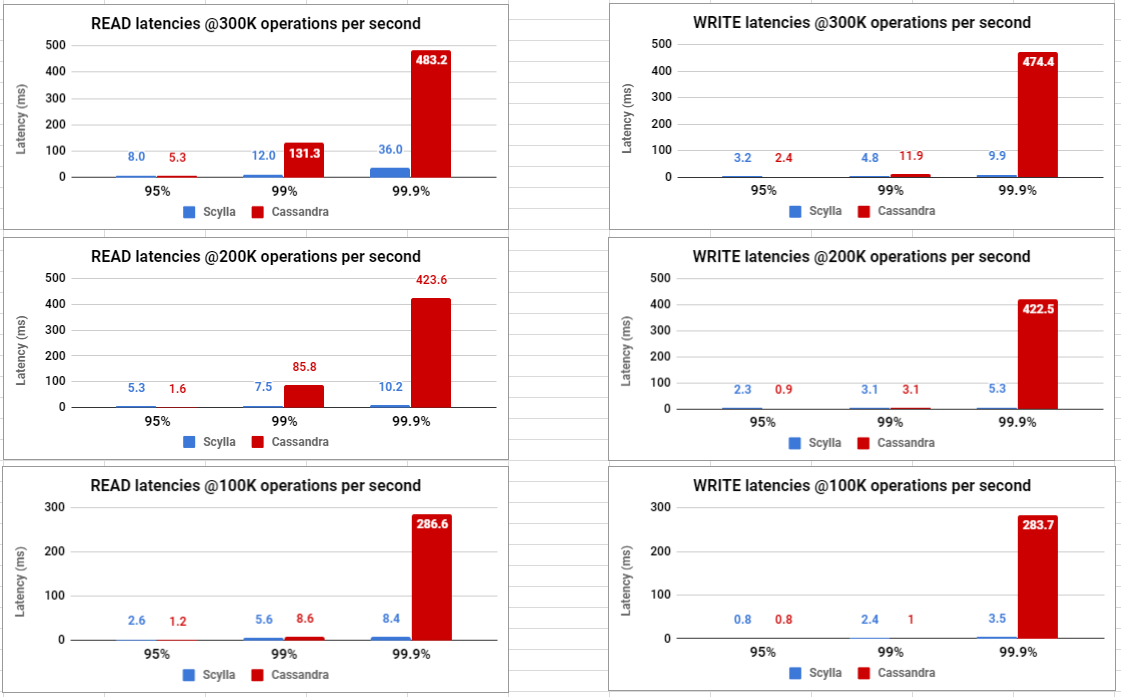
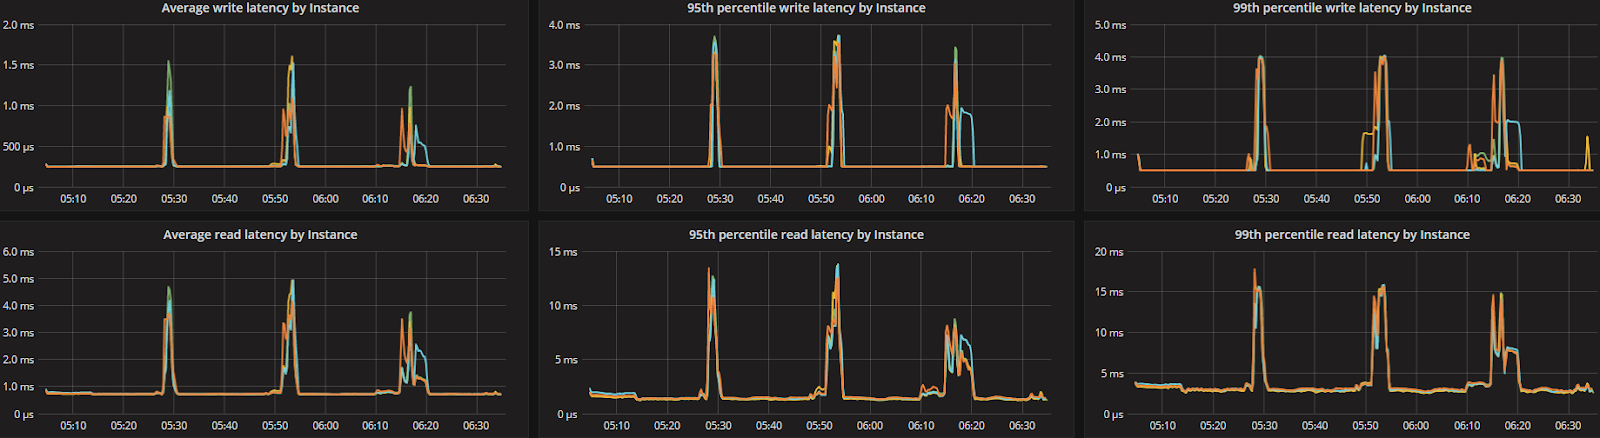
- ScyllaDB was able to meet the SLA of 99% latency < 10ms in all tested workloads (with the one exception of 12ms in the read workload under 300K OPS).
- Cassandra was able to meet the SLA of 99% latency < 10ms only for the 100K OPS workload.
- ScyllaDB demonstrated superior 99.9% latency in ALL cases, in some cases showing an improvement of up to 45X.
- ScyllaDB also demonstrated better 99% latency in all cases but one. In the one case where Cassandra was better (write @100K OPS) both clusters demonstrated very low single-digit latency.
- Cassandra demonstrated better 95% latency in most cases. This is an area for improvement for ScyllaDB. Read more about this in the monitoring section below.
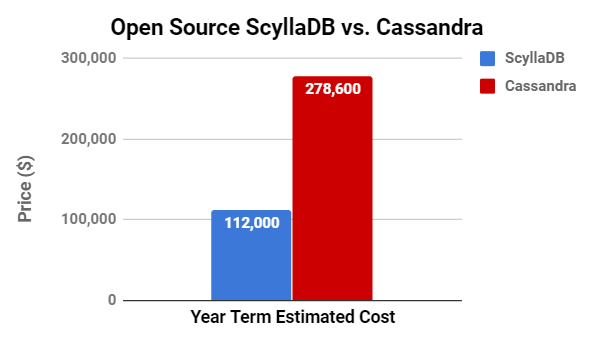
Comparison of AWS Server Costs
| ScyllaDB 2.2 | Cassandra 3.11 |
Year term Estimated cost: ~$112K
|
Year term Estimated cost: ~$278.6K
|
Setup and Configuration
| ScyllaDB Cluster | Cassandra Cluster | |
| EC2 Instance type | i3.Metal (72 vCPU | 512 GiB RAM) | i3.4xlarge (16 vCPU | 122 GiB RAM) |
| Storage (ephemeral disks) | 8 NVMe drives, each 1900GB | 2 NVMe drives, each 1900GB |
| Network | 25Gbps | Up to 10Gbps |
| Cluster size | 4-node cluster on single DC | 40-node cluster on single DC |
| Total CPU and RAM | CPU count: 288 | RAM size: 2TB | CPU count: 640 | RAM size: ~4.76TB |
| DB SW version | ScyllaDB 2.2 | Cassandra 3.11.2 (OpenJDK build 1.8.0_171-b10) |
| ScyllaDB Loaders | Cassandra Loaders | |
| Population | 4 x m4.2xlarge (8 vCPU | 32 GiB RAM) 8 c-s clients, 2 per instance |
16 x m4.2xlarge (8 vCPU | 32 GiB RAM) 16 c-s clients, 1 per instance |
| Latency tests | 7 x i3.8xlarge (up to 10Gb network) 14 c-s clients, 2 per instance |
8 x i3.8xlarge (up to 10Gb network) 16 c-s clients, 2 per instance |
Cassandra Optimizations
It’s no secret that Cassandra’s out-of-the-box performance leaves much to be desired. Cassandra requires quite a bit of tuning to get good results. Based on recommendations from Datastax and Amy Tobey’s guide to Cassandra tuning, we applied the following optimizations to the Cassandra cluster.
Originally we applied the changes listed below to only the cassandra.yaml and the jvm options files — that yielded poor performance results. Despite multiple attempts using various amounts of cassandra-stress clients and threads per client, we could not get more than 30K operations per second throughput. After applying the IO tuning setting, Cassandra started performing much better.
| cassandra.yaml | buffer_pool_use_heap_if_exhausted: truedisk_optimization_strategy: ssdrow_cache_size_in_mb: 10240concurrent_compactors: 16compaction_throughput_mb_per_sec: 960 |
| jvm.options | -Xms48G-Xmx48G-XX:+UseG1GC-XX:G1RSetUpdatingPauseTimePercent=5-XX:MaxGCPauseMillis=500-XX:InitiatingHeapOccupancyPercent=70-XX:ParallelGCThreads=16-XX:PrintFLSStatistics=1-Xloggc:/var/log/cassandra/gc.log#-XX:+CMSClassUnloadingEnabled#-XX:+UseParNewGC#-XX:+UseConcMarkSweepGC#-XX:+CMSParallelRemarkEnabled#-XX:SurvivorRatio=8#-XX:MaxTenuringThreshold=1#-XX:CMSInitiatingOccupancyFraction=75#-XX:+UseCMSInitiatingOccupancyOnly#-XX:CMSWaitDuration=10000#-XX:+CMSParallelInitialMarkEnabled#-XX:+CMSEdenChunksRecordAlways |
| IO tuning | echo 1 > /sys/block/md0/queue/nomergesecho 8 > /sys/block/md0/queue/read_ahead_kbecho deadline > /sys/block/md0/queue/scheduler |
ScyllaDB Optimizations
There is no need to optimize the ScyllaDB configuration. ScyllaDB automatically configures the kernel, the OS, and itself to dynamically adjust to the best setup.
Dataset Used and Disk Space Utilization
Because we wanted the latency tests to be based primarily on disk access, we populated each database with a large dataset of ~11TB consisting of 38.85B partitions using the default cassandra-stress schema, where each partition size was ~310 bytes. A replication factor of 3 was used. Each Cassandra node holds a data set that is 5.5 times bigger than its RAM, whereas each ScyllaDB node holds 16.25-times the data size of RAM. Note that the Cassandra 3.x file format consumes less disk space. The September/October release of ScyllaDB will include full compatibility with Cassandra’s 3.x format, bringing further improvements to volume and performance.
| ScyllaDB | Cassandra | |
| Total used storage | ~32.5 TB | ~27 TB |
nodetool status server load (Avg.) |
~8.12 TB / node | ~690.9 GB / node |
| /dev/md0 (Avg.) | ~8.18 TB / node | ~692 GB / node |
| Data size / RAM ratio | ~16.25 : 1 | ~5½ : 1 |
Performance Results (Graphs)
Performance Results (Data)
The following table summarizes the results for each of the latency tests conducted.

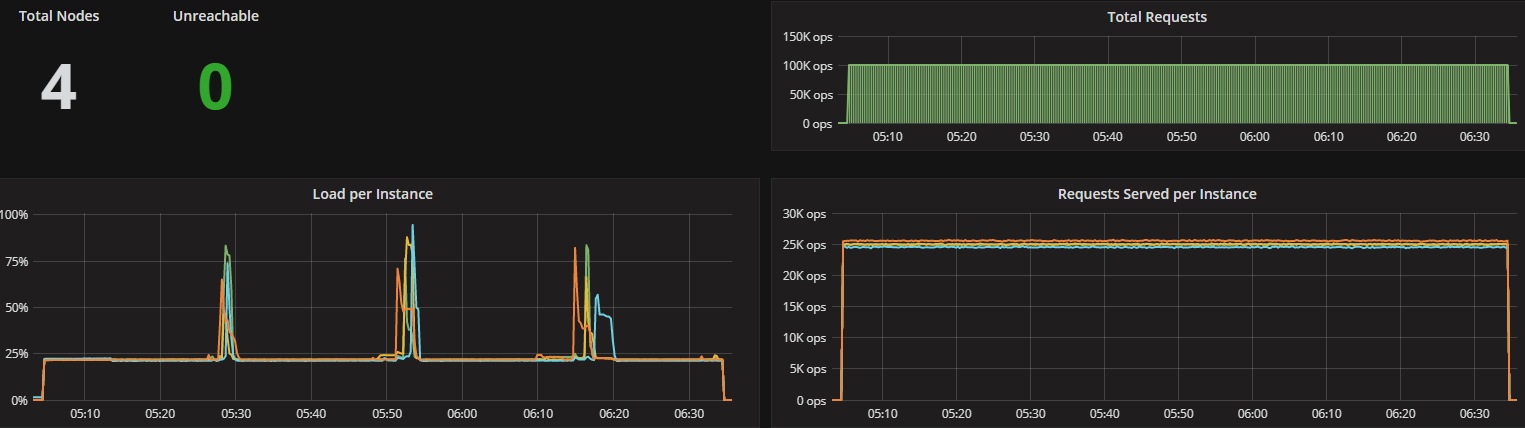
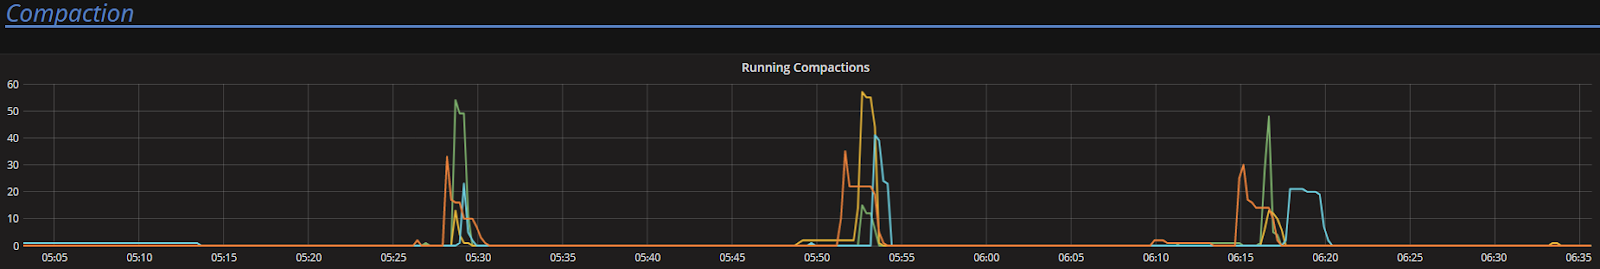
ScyllaDB Monitoring Screenshots
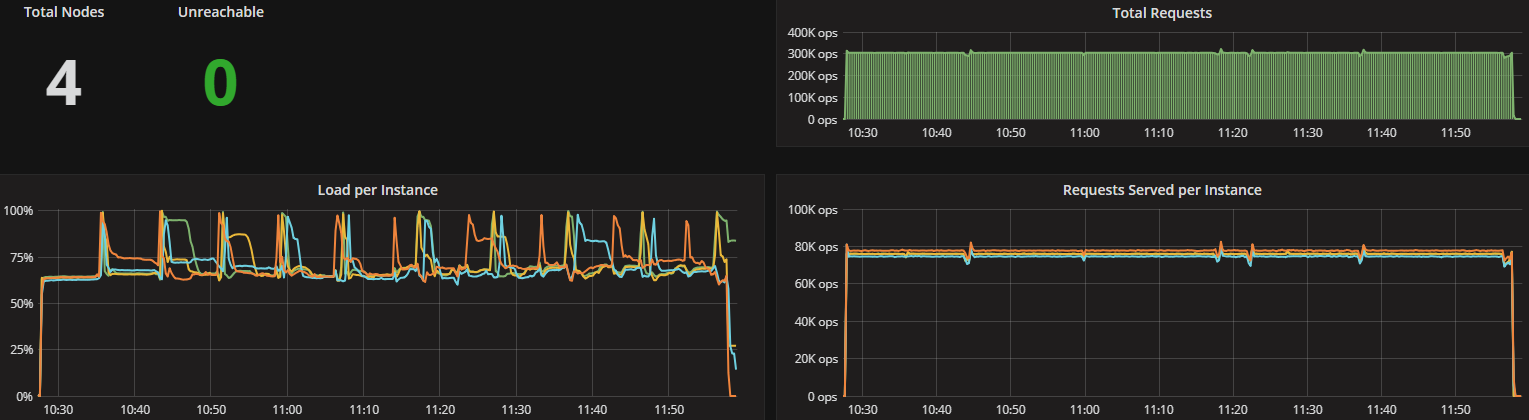
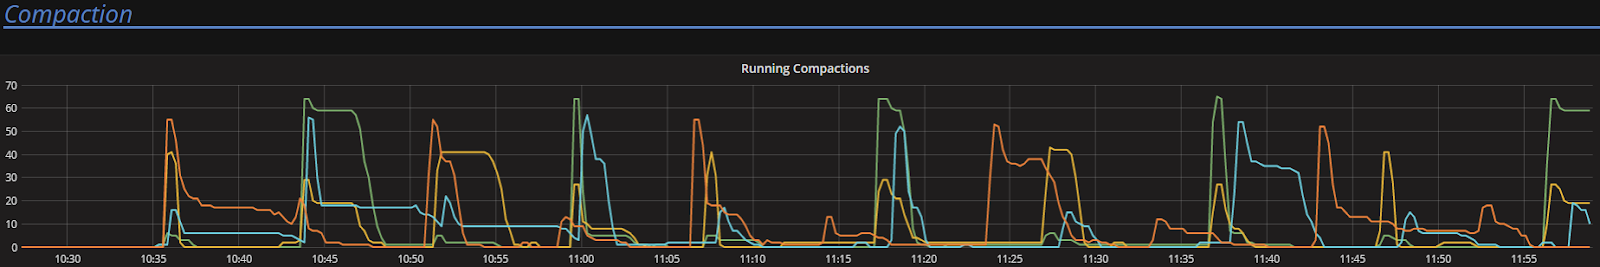
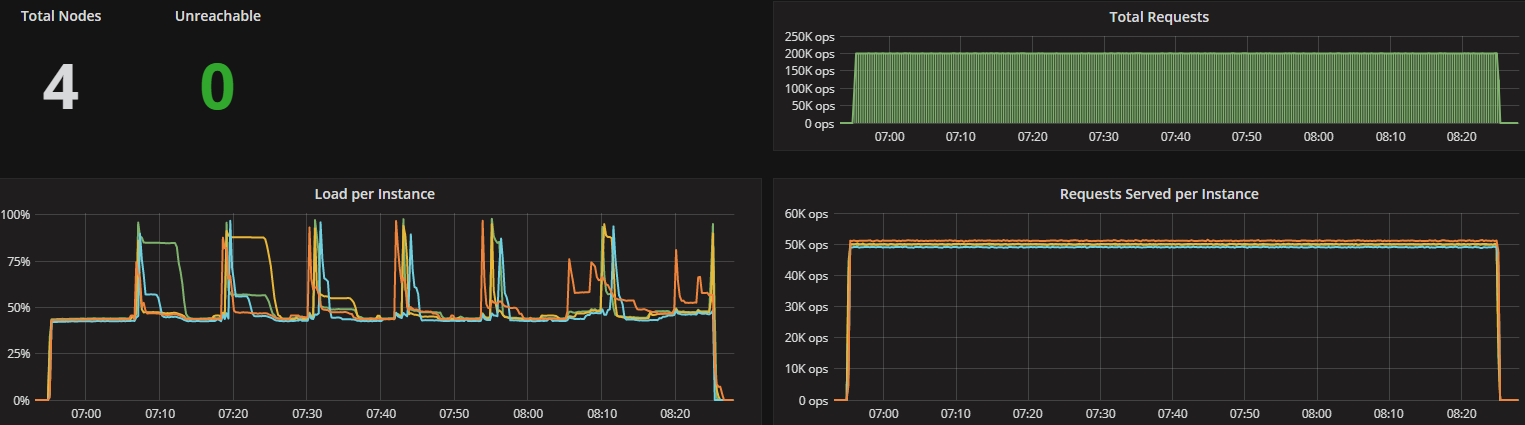
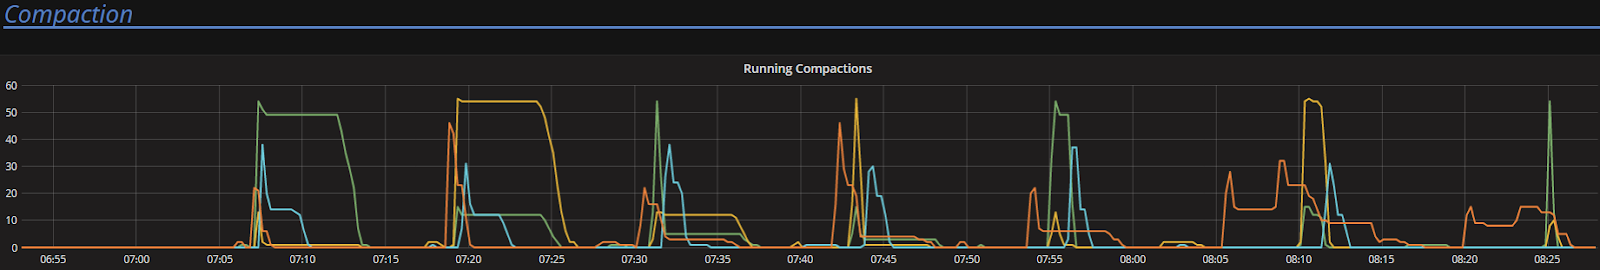
ScyllaDB version 2.2 introduces several new capabilities, including the Compaction Controller for the Size Tiered Compaction Strategy (STCS). This new controller provides ScyllaDB with an understanding of just how much CPU shares it can allocate for compactions. In all the tested workloads (300K Ops, 200K Ops, and 100K Ops) the incoming traffic load on the CPU-reactor was on average 70%, 50%, and 25% respectively. The compaction controller understands if there are enough unused/free CPU shares to be allocated for compactions. This enables ScyllaDB to complete the compactions in a fast and aggressive manner while ensuring that the foreground load is maintained and the throughput is unaffected. The spikes you see in the CPU-reactor graph in each of the workloads correspond exactly to compaction jobs execution, as can be seen, the in the compaction graph.
When the workload is bigger (300K OPS), SSTables are created faster and more frequent compactions are needed, which is why we see more frequent CPU-reactor spikes to 100%. When the workload is smaller (100K OPS), SSTables are created more slowly and compactions are needed less frequently, resulting in very few CPU-reactor spikes during that run.
Latency test (300K Ops): Mixed 50% WR/RD workload (CL=Q)
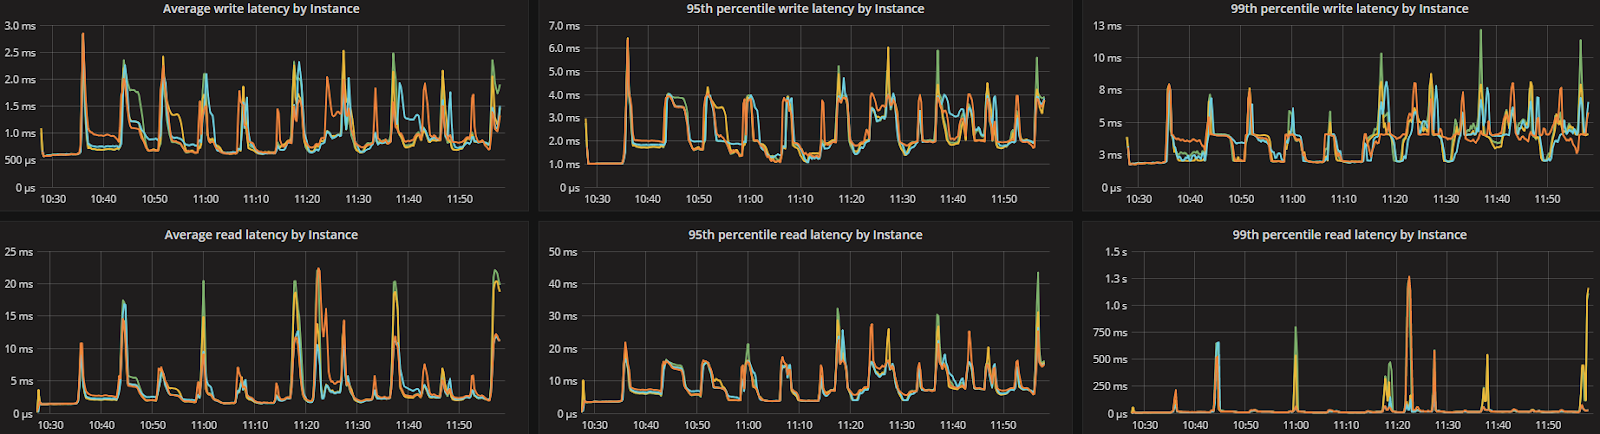
Latency test (200K OPS): Mixed 50% WR/RD workload (CL=Q)
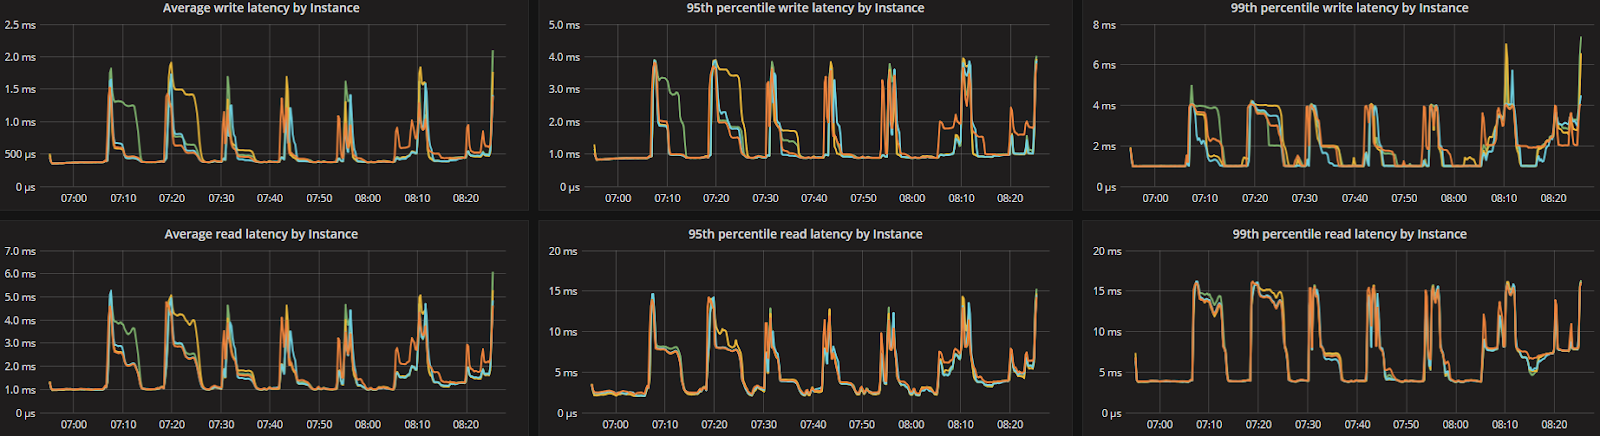
Latency test (100K OPS): Mixed 50% WR/RD workload (CL=Q)
Future Work
ScyllaDB’s compaction controller code is new, as is the CPU scheduler. Looking at graphs we see that it’s possible to smooth compaction automatically and reduce the latency to 1/3 the size and thus push more throughput while still meeting the SLA of this use case (10ms for 99%).
Appendix-A
ScyllaDB Schema (RF=3)
Cassandra Schema (RF=3)
C-S commands – ScyllaDB
- Population (~11TB | 38.85B partitions | CL=ONE) x 8 clients
nohup cassandra-stress write no-warmup n=4856250000 cl=one -mode native cql3 -node [IPs] -rate threads=200 -log file=[log_file] -pop seq=1..4856250000 &
- Latency tests: Mixed 50% WR/RD workload (CL=Q) x 14 clients
7 clients Xnohup taskset -c 1-15 cassandra-stress mixed ratio\(write=1,read=1\) no-warmup duration=90m cl=quorum -pop dist=gaussian\(1..38850000000,19425000000,6475000000\) -mode native cql3 -node [IPs] -log file=[log_file] -rate threads=200 limit=7142/s | 14285/s | 21650/s &(300K | 200K | 100K Ops)
7 clients Xnohup taskset -c 17-31 cassandra-stress mixed ratio\(write=1,read=1\) no-warmup duration=90m cl=quorum -pop dist=gaussian\(1..38850000000,19425000000,6475000000\) -mode native cql3 -node [IPs] -log file=[log_file] -rate threads=200 limit=21650/s | 14285/s | 7142/s &(300K | 200K | 100K Ops)
C-S commands – Cassandra
- Population (~11TB | 38.85B partitions | CL=ONE) x 16 clients
nohup cassandra-stress write n=2428125000 cl=one -mode native cql3 -node [IPs] -rate threads=200 -log file=[log file] -pop seq=0..2428125000 &
- Latency test: Mixed 50% WR/RD workload (CL=Q) x 16 clients
nohup cassandra-stress mixed ratio\(write=1,read=1\) no-warmup duration=90m cl=quorum -pop dist=gaussian\(1..38850000000,19425000000,6475000000\) -mode native cql3 -node [IPs] -log file=[log_file] -rate threads=200 limit=19000/s | 12500/s | 6250/s &(300K | 200K | 100K Ops)