
About ScyllaDB
ScyllaDB is an innovative data base that delivers the functionality of Apache Cassandra with the speed of a fast key/value store.
Raw speed isn’t just a nice benchmark or a low cloud bill. ScyllaDB’s order of magnitude improvement in performance opens a wide range of possibilities. Instead of designing a complex data model to achieve adequate performance, use a straightforward data model, eliminate complexity, and finish your NoSQL project in less time with fewer bugs.
Performance improvements enable not just a reduction in resources, but also an innovation in architecture and DevOps systems. ScyllaDB combines the simple and familiar Cassandra architecture with new power to build a data model that fits the application, not just tweak the model to fit the server.
Using Oracle Bare Metal Cloud Services
Oracle Bare Metal Cloud Services (BMCS) provides a state-of-the-art platform for modern applications. ScyllaDB utilizes systems in the most efficient way, and takes advantage of the ample amount of CPU, memory and high performance storage. Using BMCS, DevOps teams deploying ScyllaDB can make sure their applications perform at maximum throughput and lowest latency due to the fact that ScyllaDB is able to utilize every byte of RAM in the server, fast NVMe storage, and unlimited CPU power from BMCS servers.
Deploying ScyllaDB on Oracle Bare Metal Cloud Services
The following are the steps required to install ScyllaDB.
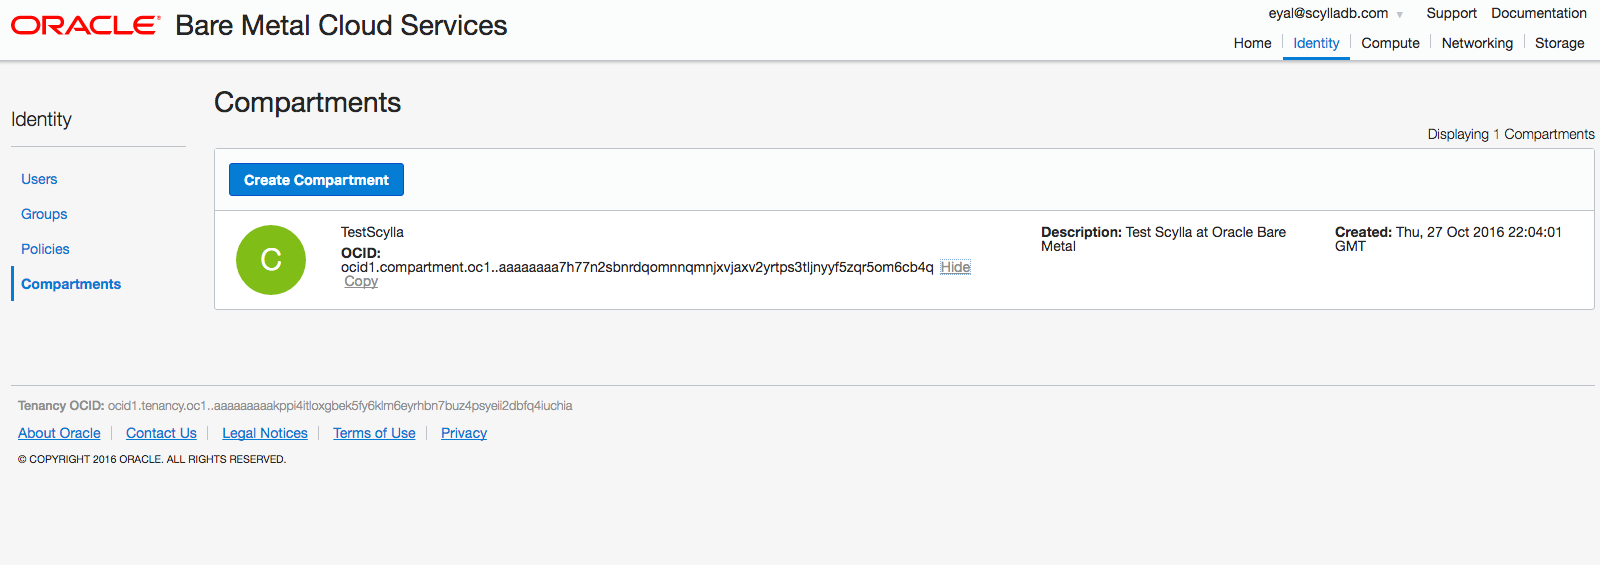
After logging into your account, construct a compartment in which ScyllaDB servers will be residing.
Networking Considerations
Define a security port list to enable the needed communication between the servers.
ScyllaDB requires the following ports to sustain communication between ScyllaDB servers and ScyllaDB clients:
| Protocol | Port | Type |
| CQL (native_transport_port) | 9042 | TCP |
| Inter-node communication (RPC) | 7000 | TCP |
| SSL inter-node communication (RPC) | 7001 | TCP |
| JMX management | 7199 | TCP |
| ScyllaDB REST API | 10000 | TCP |
| ScyllaDB Prometheus API | 9180 | TCP |
| node_exporter (Optional) | 9100 | TCP |
Users may define different ports for communication by updating the scylla.yaml file.
Create instances to deploy ScyllaDB servers on and start the instances.
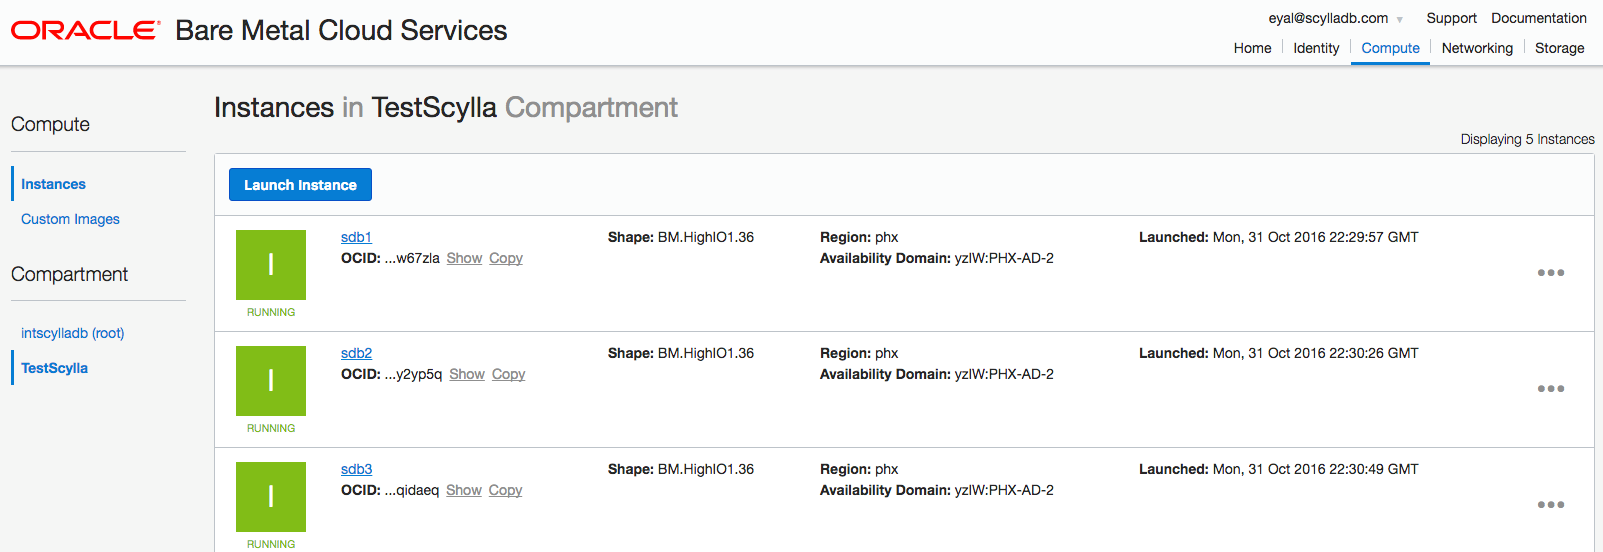
You can chose different instances; the following testing used the highio flavor, with 4xNVMe drives, 36 CPUs and 512GB of DRAM for the ScyllaDB servers.
Use the Oracle Enterprise Linux 7.2 image.
$ sudo yum install wget
$ sudo rpm -i
$ sudo yum install lz4-r131-1.el7.x86_64.rpm
$ sudo yum install cryptopp-5.6.2-10.el7.x86_64.rpm
$ sudo yum install thrift-0.9.1-13.el7.x86_64.rpm
$ sudo yum install jsoncpp-0.10.5-2.el7.x86_64.rpm
$ sudo yum install yaml-cpp-0.5.1-6.el7.x86_64.rpm
$ sudo yum install collectd-5.6.0-1.el7.x86_64.rpmFor the NVMe drives in the servers create a RAID 0
sudo mdadm --create /dev/md0 --level 0 --raid-devices 4 /dev/nvme0n1 /dev/nvme1n1 /dev/nvme2n1 /dev/nvme3n1Format the drive to xfs
$ sudo mkfs.xfs -f /dev/md0Mount the RAID drive to /var/lib/scylla and update /etc/fstab accordingly.
Import the ScyllaDB repo from ScyllaDB repository
Install ScyllaDB with
$ yum install scyllaFor each of the nodes, update the scylla.yaml file, located at /etc/scylla/scylla.yaml to include the correct cluster name, seed nodes, listen address and rpc_address. For example:
For a 3 node cluster with internal IP addresses:
10.0.1.25 ,10.0.1.26 ,10.0.1.27
We named the server:
cluster_name: 'OracleBMCluster'We defined servers 10.0.1.25 and 10.0.1.27 as our seed nodes, the following line in the scylla.yaml file represents this selection:
- seeds: "10.0.1.25,10.0.1.27"Update the listen_address for each server with its internal IP address:
listen_address: <Server’s IP Address>
For example for server 10.0.1.25 the line will look as the following:
listen_address: 10.0.1.25Do the same for the rpc_address parameters, for example:
rpc_address: 10.0.1.25Once all servers are updated you can start your cluster. First start the seed nodes and gradually add your non-seed nodes. It is good practice not to have all nodes as seed nodes.
Use the nodetool command to make sure all nodes are up for example:
$ nodetool status
Datacenter: datacenter1
=======================
Status=Up/Down
|/ State=Normal/Leaving/Joining/Moving
--  Address    Load       Tokens  Owns    Host ID                               Rack
UN  10.0.1.25  1.93 TB    256     ?       fb3080b7-1a34-4cfc-952d-8acf372c6cb8  rack1
UN  10.0.1.26   1.88 TB    256     ?       9764b841-7f4a-428a-a79b-3333a36d1a92  rack1
UN  10.0.1.27   1.89 TB    256     ?       48854582-d665-48f3-8cf3-30546b39183a  rack1
You now have a working cluster!
Benchmarking ScyllaDB
To benchmark the cluster capabilities there is a need for additional servers to create the load on the cluster. In our testing we used the Standard1.36 instances as client machines, and created 10 client instances to load the 3 ScyllaDB servers.
Using the Cassandra-stress default workload we created over 7 billion records in the cluster.
cassandra-stress write n=700000000 cl=QUORUM -mode native cql3 -schema keyspace="keys" "replication(factor=3)" -pop seq=1..700000000 -rate threads=700 -node 10.0.1.25,10.0.1.26,10.0.1.27The above command was used on one loader. On the following loaders we placed the continue sequence of the workload; for example on loader number 2 the command looks as the following:
cassandra-stress write n=700000000 cl=QUORUM -mode native cql3 -schema keyspace="keys" "replication(factor=3)" -pop seq=700000001..1400000000 -rate threads=700 -node 10.0.1.25,10.0.1.26,10.0.1.27And on the tenth loader the command is:
cassandra-stress write n=700000000 cl=QUORUM -mode native cql3 -schema keyspace="keys" "replication(factor=3)" -pop seq=6300000001..7000000000 -rate threads=700 -node 10.0.1.25,10.0.1.26,10.0.1.27
The load on the disks is described below. ~1GByte of data is written every second to the disks:

For the read test, we used 20 loading processes. The need for multiple processes is to create enough stress on the ScyllaDB cluster. The read load is described in next stress command:
cassandra-stress read duration=240m cl=QUORUM -mode native cql3 -schema keyspace="keys" -pop dist=gaussian\(1..7000000000,3500000000,1100000000\) -rate threads=1500 -node 10.0.1.25,10.0.1.26,10.0.1.27Each execution creates read of one record from the cluster, where the key to read is chosen randomly, with a normal distribution, mean at 3.5Billion and standard deviation of 1.1Billion.
The distribution will try to make sure some data is served from the disks.
As more and more data is served from memory, the transactions served per second rate increases. (Servers are cold cached before starting the test.)

Looking on the cache statistics we see the hit rate increases with time.

And the disk activity follows accordingly:

In the steady-state conditions the read rate from the disk are stable at the rate of exchanging the needed records.

And the rate of read is ~1.5M transactions per second. Mostly, as expected, served from the now warm cache of the servers:

The following are the statistics for the key space we used for our testing.
[opc@sdb1b ~]$ nodetool cfstats keys
Keyspace: keys
Read Count: 1030330667
Read Latency: 0.7613545127207205 ms.
Write Count: 76008792
Write Latency: 0.0111936784329593 ms.
Pending Flushes: 0
Table: standard1
SSTable count: 910
SSTables in each level: [910/4]
Space used (live): 2375954073392
Space used (total): 2375954073392
Space used by snapshots (total): 0
Off heap memory used (total): 4838006876
SSTable Compression Ratio: 0.0
Number of keys (estimate): 7752554189
Memtable cell count: 3579358
Memtable data size: 3546912869
Memtable off heap memory used: 3821535232
Memtable switch count: 71
Local read count: 1030330667
Local read latency: 0.761 ms
Local write count: 760087929
Local write latency: 0.011 ms
Pending flushes: 0
Bloom filter false positives: 6456236
Bloom filter false ratio: 316.98300
Bloom filter space used: 695707376
Bloom filter off heap memory used: 804782932
Index summary off heap memory used: 211688712
Compression metadata off heap memory used: 0
Compacted partition minimum bytes: 259
Compacted partition maximum bytes: 310
Compacted partition mean bytes: 310
Average live cells per slice (last five minutes): 0.0
Maximum live cells per slice (last five minutes): 0.0
Average tombstones per slice (last five minutes): 0.0
Maximum tombstones per slice (last five minutes): 0.0
[opc@sdb1b ~]$ nodetool cfhistograms keys standard1
keys/standard1 histograms
Percentile SSTables Write Latency Read Latency Partition Size Cell Count
(micros) (micros) (bytes)
50% 2.00 10.00 29.00 310 5
75% 3.00 12.00 42.00 310 5
95% 3.00 20.00 2299.00 310 5
98% 3.00 29.00 4768.00 310 5
99% 3.00 35.00 14237.00 310 5
Min 0.00 2.00 7.00 259 5
Max 4.00 2759.00 2816159.00 310 5
Looking on the client side statistics for the read portion we see the following read latencies:
Results:
op rate : 281037 [READ:281037]
partition rate : 281037 [READ:281037]
row rate : 281037 [READ:281037]
latency mean : 5.3 [READ:5.3]
latency median : 3.2 [READ:3.2]
latency 95th percentile : 7.5 [READ:7.5]
latency 99th percentile : 10.3 [READ:10.3]
latency 99.9th percentile : 34.7 [READ:34.7]
latency max : 2507.4 [READ:2507.4]
Total partitions : 337235157 [READ:337235157]
Total errors : 0 [READ:0]
total gc count : 0
total gc mb : 0
total gc time (s) : 0
avg gc time(ms) : NaN
stdev gc time(ms) : 0
Cost
Based on Oracle Bare Metal Cloud Services Pricing, reviewed on 1/16/2017, 2pm PST. Deploying ScyllaDB on 3 HighIO flavor servers will cost the user $12.96 an hour, or $9,460.8 per month.
The above cost is for the infrastructure only, and does not include any software licenses (ScyllaDB or others), network activity (if charged) and client servers cost.
Conclusion
Using Oracle Bare Metal Cloud Services provides excellent performance results using ScyllaDB, Customer can expect to serve a very high rate of write and read transactions with efficient usage of infrastructure, while minimizing the need to configure auxiliary system and software.