
ScyllaDBTop is a simple diagnostic tool that enables you to log on to a machine running ScyllaDB, and view its current state, including many helpful metrics. ScyllaDBTop is a small project, just a single text-based program with no dependencies other than packages present in the standard Linux distribution. It makes it possible to easily monitor your ScyllaDB node without having to set up multiple Docker containers for monitoring servers.
ScyllaDB reports these metrics to collectd, a data gathering service, and ScyllaDBTop then connects to collectd and presents its metrics to the user. Because ScyllaDBTop is a general-purpose collectd viewer, you can even use it to view non-scylla related metrics from collectd.
ScyllaDBTop is a complementary tool, not a replacement for a complete monitoring and charting solution such as ScyllaDB Monitoring or Grafana. Both can work together, using collectd as a common server and proxy.

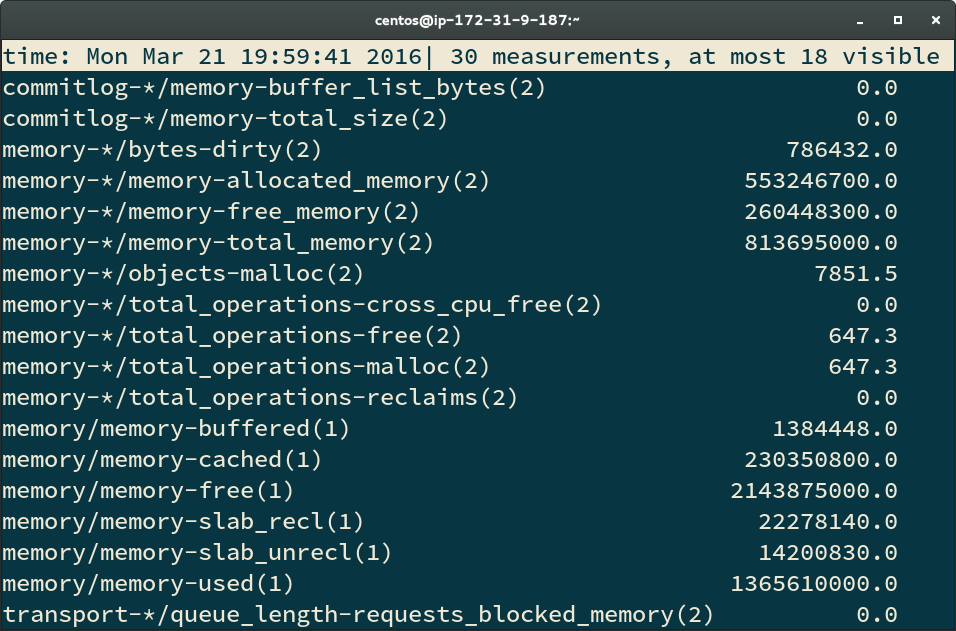
This screenshot shows scyllatop monitoring memory-related metrics. See the article for the command line used.
Configuring collectd
First, you need a running collectd service. This collectd service must be configured to use the collectd unixsock plugin. In collectd’s configuration file (on Fedora: /etc/collectd.conf) uncomment the LoadPlugin line for unixsock so that it reads:
LoadPlugin unixsock
Later in the file you will find a commented-out configuration for this plugin. Uncomment it so that it looks something like this
<Plugin unixsock>
    SocketFile "/var/run/collectd-unixsock"
    SocketGroup "wheel"
    SocketPerms "0660"
    DeleteSocket false
</Plugin>
Pay attention to the socket group and permissions. Use a group that will let you have access to it when you run ScyllaDBTop. After this, restart collectd with
sudo systemctl restart collectd.service
to use the new configuration. Collectd is already set up for you in the ScyllaDB RPM, which is pre-installed on the ScyllaDB AMI on Amazon EC2. The configuration is in the file /etc/collectd.d/scylla.conf.
More helpful collectd configuration
Collectd has other plugins that you can enable to watch other important metrics such as network errors and disk I/O. A single collectd process can monitor all levels of the system, and supply data to scyllatop and to more complicated visualization tools.
Ethstat
The ethstat plugin collects information directly from the device driver for your network interface. Add the following configuration, filling in the name of your network interface in the Interface line.
 <Plugin "ethstat">
   Interface "eth0"
   Map "rx_csum_offload_errors" "if_rx_errors" "checksum_offload"
   Map "multicast" "if_multicast"
 </Plugin>
Disk
The disk plugin will let you track the data read from and written to a block device, the number of read and write operations issued, and the time requireed to complete. As with the ethstat plugin, you need to supply the device name in the configuration file.
More monitoring
You can also add the network and write_riemann plugins to connect the same connectd instance to other monitoring tools.
LoadPlugin network
LoadPlugin write_riemann

Interval 1

<Plugin "network">
    Listen "0.0.0.0" "25826"
</Plugin>
<Plugin "write_riemann">
 <Node "node1">
   Host "127.0.0.1"
   Port "5555"
   Protocol UDP
   StoreRates true
   TTLFactor 20
   AlwaysAppendDS false
 </Node>
</Plugin>
With those enabled, you can add much more monitoring functionality. For more info on monitoring ScyllaDB, see Monitoring ScyllaDB with collectd, riemann-dash, and Tessera.
Running ScyllaDBTop
If you don’t specify which items to display, scyllatop queries collectd, and displays all metrics available from collectd. (ScyllaDBTop doesn’t really know anything about scylla, it’s just a collectd client. You can run it for any collectd server for any application.)
To show a subset of commands, you can use a glob pattern (like ls and other shell commands use). The screenshot above was taken with
scyllatop ‘*memory*’
When using glob patterns, make sure to quote them, as show above – otherwise the shell might expand them into file names, which is probably not what you wanted.
ScyllaDBTop is typically used in a simple case for monitoring a single node. It must run locally, on the same host as collectd. Typically all three of these will run on the same host:
- scylla
- collectd
- scyllatop
More complex monitoring options for ScyllaDB can include aggregating collectd or JMX data from multiple hosts.
Available metrics
Many metrics are available, and you can run scyllatop --list to list everything. Among the areas covered are:
- CPU metrics such as system/user/idle time, and interrupt counts
- Network traffic: packets in, out, and dropped
- Memory used for cache
- Disk I/O
ScyllaDBTop is flexible – whatever you can pass to collectd, it will let you watch. The 0.19 release of ScyllaDB includes ScyllaDBTop. It’s part of the scylla-server package, and preinstalled on the ScyllaDB AMI. If you have questions about ScyllaDBTop, please join us on the scylladb-users mailing list.
Follow @ScyllaDB on Twitter or subscribe to this site’s RSS feed to keep up with future releases.