You can visualize ScyllaDB performance with Tessera and riemann-dash, thanks to collectd support. ScyllaDB can be configured to send data using the collectd protocol, once per second, which makes it easy to keep an eye on the performance of a whole cluster.
In order to simplify the chain of tools needed to get all the visualization working, we have packaged collectd, along with everything else needed, in Docker containers. Getting everything working correctly can be complicated. Tessera depends on the Graphite real-time graphing system, which is also included.
Preparation and install
The monitoring containers will need several ports on the host. Riemann uses two ports, one for the riemann-dash web UI and one for the riemann WebSockets server, and the other services will each need a port.
4567: riemann-dash web UI
5556: riemann server
8080: Graphite server
8081: Tessera web UI
25826: UDP port for communication from ScyllaDB to collectd
Once you have checked that you have the ports available and the firewall open, you’re ready to start.
Clone the scylla-monitoring Git repository scylladb/scylla-monitoring:
git clone [email protected]:scylladb/scylla-monitoring.git
cd scylla-monitoring
and run ./start-all-local.sh. The first run will pull the images from Docker Hub, so may take a while.
In this example, we’ll use 127.0.0.1 for everything. You can also use the other scripts to run on a server with a public IP address, or an Amazon EC2 instance.
Run docker ps and you should see three running containers.
scylladb/scylla-monitoring:riemann-dash
scylladb/scylla-monitoring:tessera
scylladb/scylla-monitoring:metrics-server
The riemann-dash container runs riemann-dash on port 4567, the tessera container runs Tessera on port 8081, and the metrics-server container runs both collectd and riemann.
Protip: If log data is not showing up, it may be as the result of a known Docker bug that can interfere with UDP traffic reaching a container. The workaround is to run conntrack -F to flush the netfilter connection tracking table.
Sending data to collectd from ScyllaDB
To tell ScyllaDB to send collectd statistics to the running collectd server, run it with the command line options:
scylla --collectd 1 \
--collectd-hostname "scylla-test" \
--collectd-address 127.0.0.1:25826
This assumes that your collectd server is on localhost.
You can now point your browser at 127.0.0.1:8081 and select a Tessera dashboard, or visit 127.0.0.1:4567 to use Riemann.
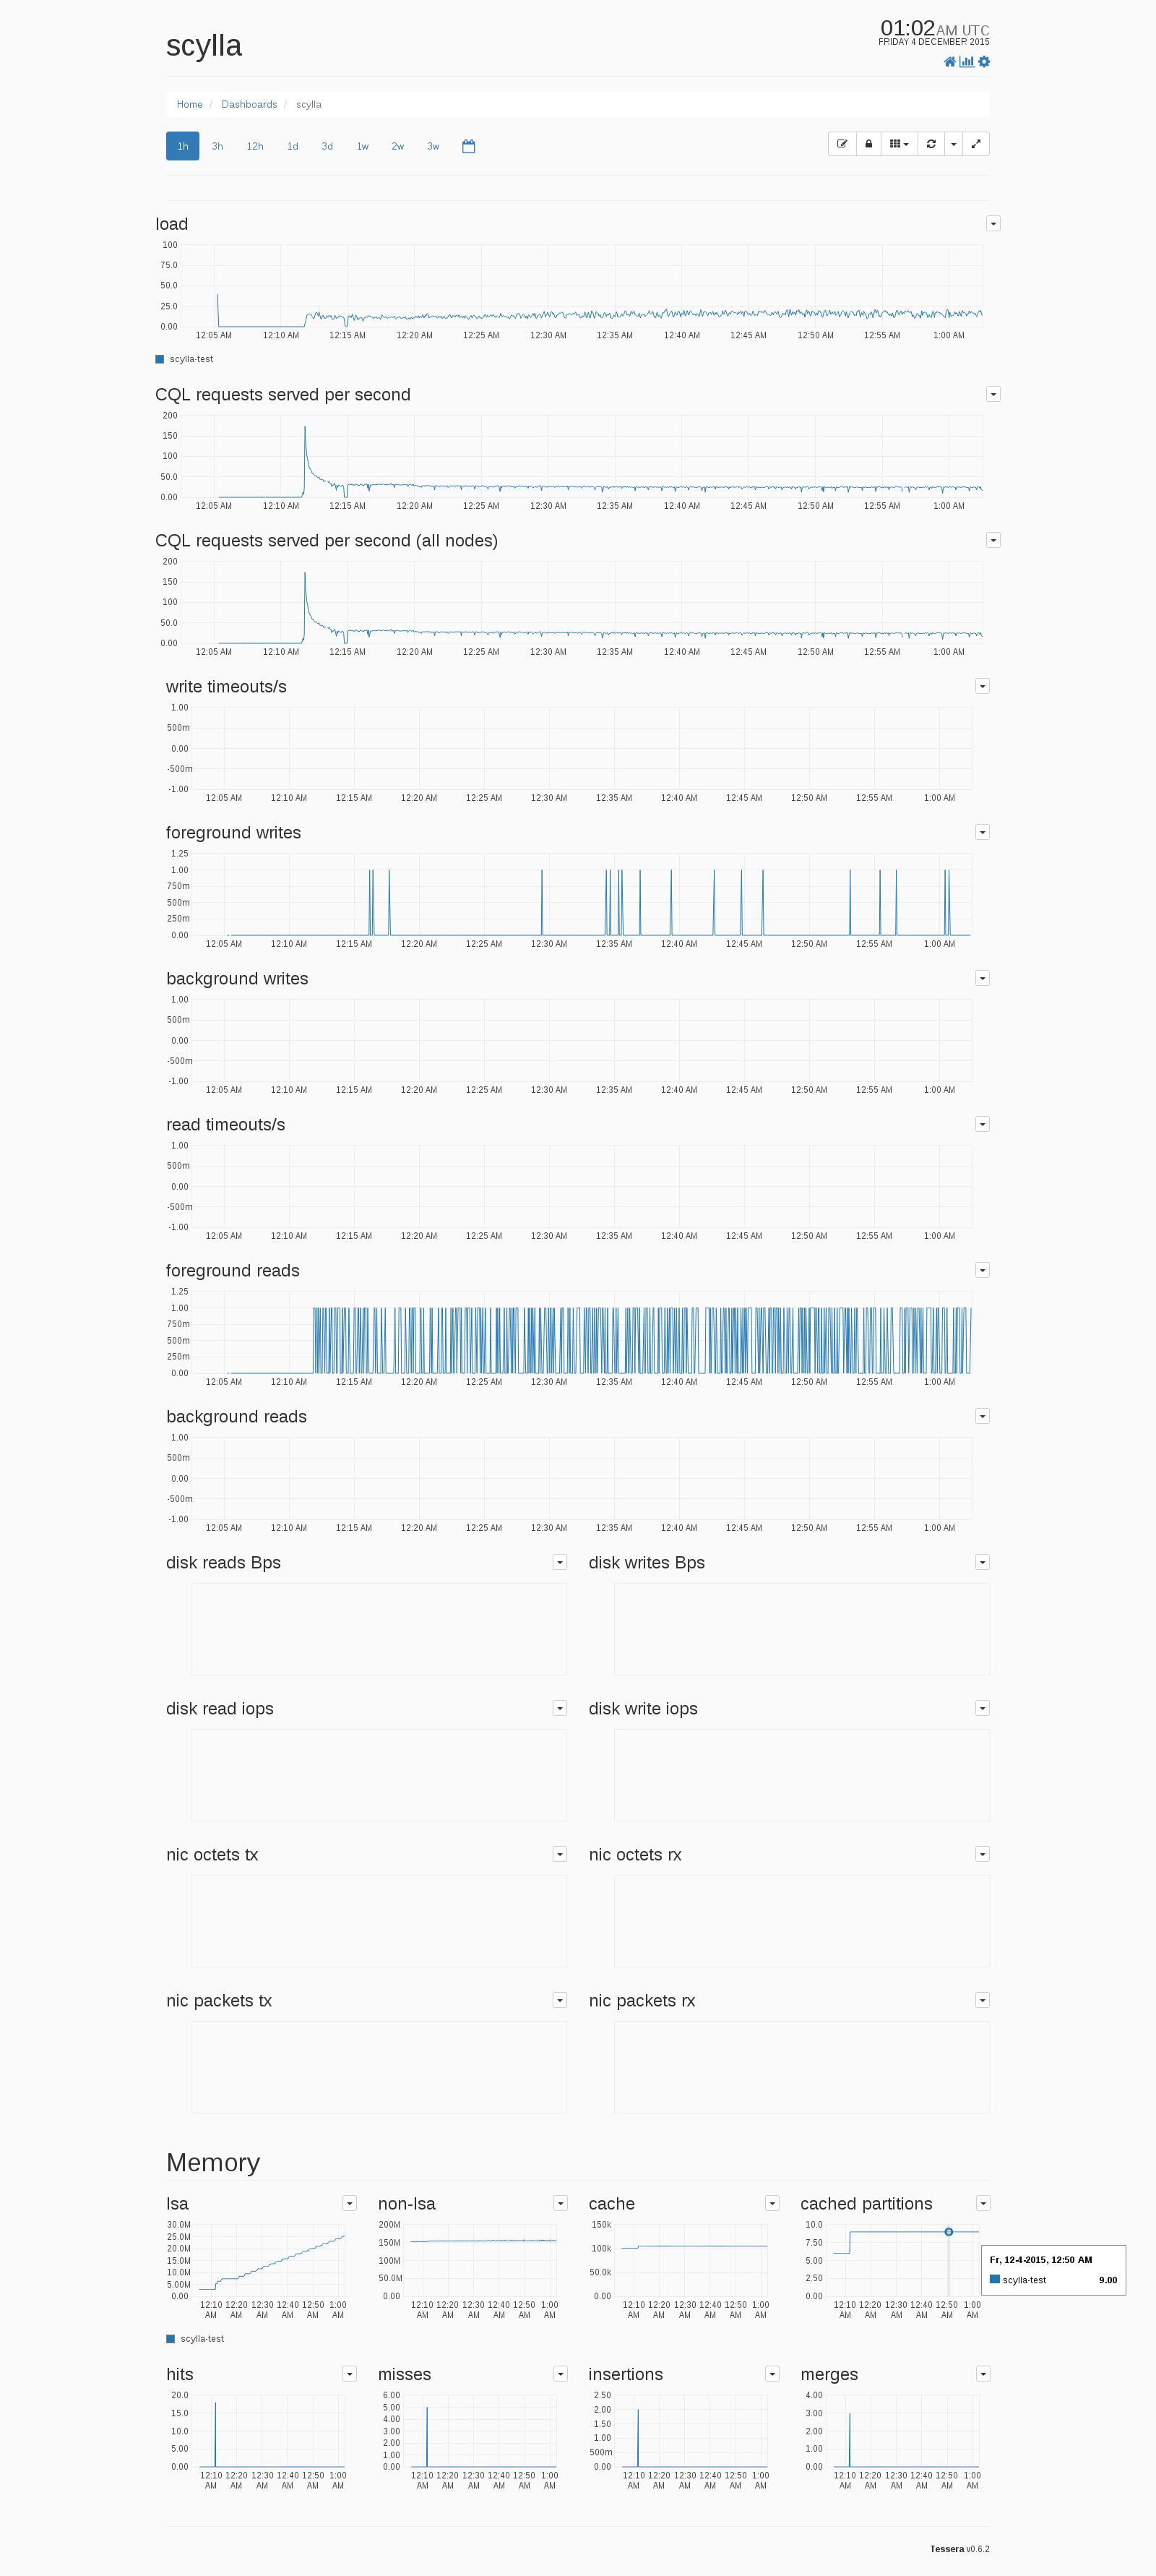
The ScyllaDB dashboard in Tessera shows all system measurements in one place. (This low-traffic dashboard is a local development server.)
Running on Amazon AWS
Make sure that you have the security group for your EC2 instance set to one that has the needed ports open, then install and start the monitoring tools.
(The first three steps below are for Amazon Linux. Shell commands may be a little different on other distributions.)
# install prerequisites and enable and start Docker
sudo yum install docker git
sudo chkconfig --add docker
sudo service docker start

# Retrieve monitoring tool containers and start monitoring
git clone https://github.com/scylladb/scylla-monitoring.git
cd scylla-monitoring
./start-all-ec2.sh
The start-all-ec2.sh script uses Amazon instance metadata to determine your monitoring system’s public IP address.
Pre-built AWS AMI
The Docker containers are installed for you on a pre-built AWS AMI. It’s ami-c7fcbbad on us-east-1 (Virginia).
To use, ssh in and run:
cd scylla-monitoring
nohup ./start-all-ec2.sh &
Configuring the ScyllaDB AMI for monitoring
If you’re using the ScyllaDB AMI, edit the file /etc/sysconfig/scylla-server to add the collectd command-line arguments.
# additional arguments
SCYLLA_ARGS="--collectd 1 --collectd-hostname "scylla-test" --collectd-address 192.168.1.1:25826"
then run
sudo systemctl restart scylla-server.service
to restart ScyllaDB with the new configuration.
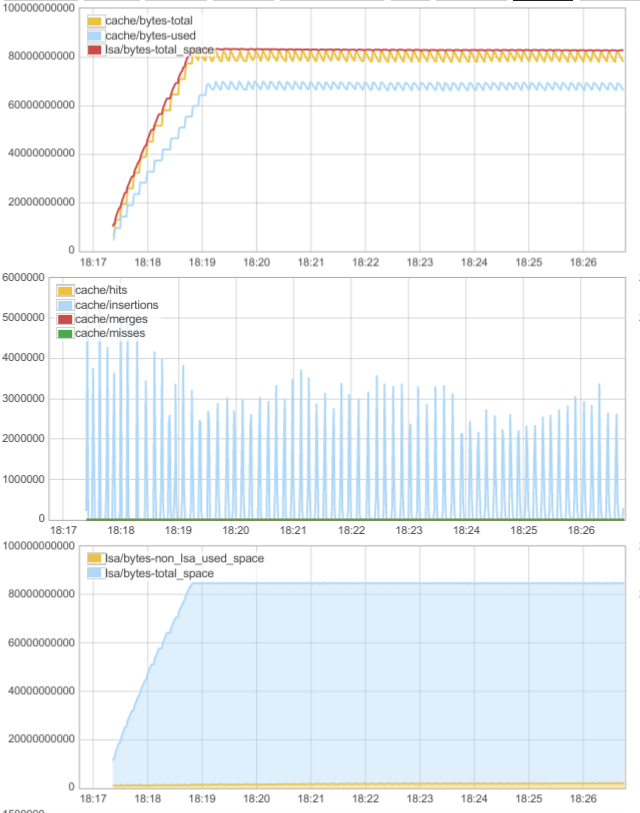
Riemann graphs, like the ones in Tessera, are customizable. This graph shows the ScyllaDB cache: memory used, insertions, hits, and misses.
Helpful scripts for working with ScyllaDB on Amazon
The cassandra-test-and-deploy utilities, like most tools for Apache Cassandra, also work with ScyllaDB. The easy way to create a full cluster with monitoring is to first start the monitoring covered here, then clone cassandra-test-and-deploy and run the ec2-setup-scylla.sh script.
Set $MONITOR to the monitoring server’s IP address.
./ec2-setup-scylla.sh -e "cluster_nodes=3" -e "collectd_server=$MONITOR"
The cassandra-test-and-deploy tools use Ansible and boto to manage EC2 instances and ScyllaDB nodes. Watch this blog for more on speeding up your ScyllaDB evaluation using the tools.
(If you need to share screen captures of large web pages, the Full Page Screen Capture extension for Google Chrome will capture an entire page, with no scrolling or stitching together images.)
Next steps
Each Dockerfile inside the scylla-monitoring repository has the relevant commands for running the monitoring service. Once you have it working, you can run the containers on a dedicated monitoring server, or set up your own infrastructure—just set the --collectd-address option to your server’s IP address. You can and should use a single collectd server for the entire ScyllaDB cluster.
More info is available in the scylla-monitoring repository.
For more discussion of ScyllaDB’s collectd support and other operations and administration info, subscribe to the scylladb-users: mailing list, or follow @ScyllaDB on Twitter.