
DynamoDB Latency FAQs
What is DynamoDB Latency?
DynamoDB is a NoSQL database fully managed by Amazon Web Services (AWS). DynamoDB tables can often respond to user requests with single digit millisecond latency across workloads.
However, as with any database, DynamoDB latency can vary depending on the use case and surrounding factors.
What is the DynamoDB Latency Range?
The DynamoDB latency range varies based on dataset size, query complexity, provisioned throughput, and network conditions. AWS service level agreements (SLAs) also include performance thresholds for DynamoDB latency under normal operating conditions—although these other conditions may impact whether the terms of SLAs can be met.
DynamoDB low latency is achievable in the single-digit to tens of milliseconds for many workloads. However, conducting regular performance testing remains essential. Additionally, AWS regularly releases updates that improve performance and reduce DynamoDB high latency.
How Does Throttling Impact DynamoDB Latency?
DynamoDB’s throttling significantly harms DynamoDB latencies. Workloads with a Zipfian distribution are especially prone to this. For example, see the results achieved in a recent benchmark:
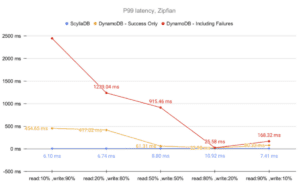
During that benchmark, it became apparent that throttling could cause the affected partition to become inaccessible for up to 2.5 seconds. That greatly magnifies the P99 tail latencies.
Types of AWS DynamoDB Latency
There are two main types of latency in Amazon DynamoDB:
Service-side latency is the time it takes for a server, database, or API to respond to a request. Its focus is on backend infrastructure in contrast to the focus on the end-to-end performance a user or client application experiences.
Client-side latency is the time it takes for a web browser, mobile app, or desktop application to respond. It includes time spent waiting for network communication, client-side processing time, and other delays.
Both types of latency are important metrics for assessing the responsiveness and efficiency of a system or application.
Users try to reduce latency in several different ways:
- Enable AWS DynamoDB latency metrics for troubleshooting client-side latency.
- Reduce connection timeout.
- Reduce latency and facilitate disaster recovery with global tables.
- Cache popular items with DynamoDB Accelerator DAX.
Troubleshooting, Monitoring, and Managing DynamoDB Latency
DynamoDB consistent read latency options include both eventually consistent reads and strongly consistent reads.
DynamoDB eventual consistency latency is the system default, which means the system’s data will eventually converge to a consistent state across all replicas within the system—although you might not immediately see the most recent write when you read from a table.
To opt for strong consistency for specific read operations, specify the “ConsistentRead” parameter in requests, and the system will ensure that you always read the most recent data. However, this option might also increase DynamoDB read latency and reduce throughput compared to eventual consistency settings.
DynamoDB replication latency is the delay between when write operations are performed on a table in one region and when the same data is synchronized to tables across other regions for purposes of high availability and disaster recovery.
DynamoDB write latency is the time it takes for the database to process an operation such as adding, modifying, or deleting an item.
Various factors can affect DynamoDB query latency, such as global secondary indexes (GSIs). These data structures allow queries with things other than the primary key. This offers increased query flexibility, but also can impact write performance and consume additional storage space.
Several tools and approaches can help monitor and manage DynamoDB latency, including:
- Amazon CloudWatch. This provides metrics such as ReadLatency and WriteLatency that monitor DynamoDB latency. Set alarms based on these metrics for notifications of latency exceeding predefined thresholds.
- AWS X-Ray. This traces requests as they travel through the DynamoDB application, identifying performance bottlenecks at a more granular level.
- AWS CloudTrail. Logs provide a history of AWS API calls and latency.
- DynamoDB Accelerator (DAX). In-memory caching of frequently accessed data can help reduce latency for read-heavy workloads.
- Application-level monitoring. Tools and frameworks like New Relic, Datadog, or Prometheus can track DynamoDB latency from the application code perspective.
- Implement custom metrics and logging. Track latency for specific DynamoDB operations or workflows for tailored insights into latency issues that are relevant to the application’s unique requirements.
- Auto scaling. Configure DynamoDB to automatically adjust provisioned capacity based on demand to maintain consistent performance and avoid latency spikes.
How Does ScyllaDB Latency Compare to DynamoDB Latency?
ScyllaDB achieved up to 4X better latency for realistic workloads, with costs that are 5X to 40X lower in a recent DynamoDB latency benchmark comparison.
For example, here are some ScyllaDB vs DynamoDB latency comparison results.
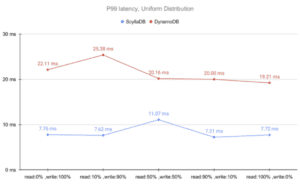
For a Uniform distribution:
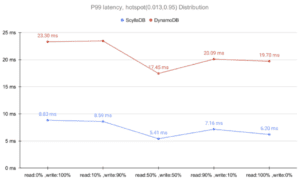
For a Hotspot distribution:
For a Zipfian distribution:
See the complete ScyllaDB vs DynamoDB latency and cost benchmark report.
Learn more about how ScyllaDB compares to DynamoDB.