
High concurrency is essential for impressive database performance. But if the clients end up overwhelming the database with requests at a pace that it can’t handle, throughput suffers, then latency rises as a side effect.
“ScyllaDB really loves concurrency…to a point.”
That was one of the key takeaways from the recent webinar, How Optimizely (Safely) Maximizes Database Concurrency, featuring Brian Taylor, Principal Software Engineer at Optimizely.
No database or system – digital or not – can tolerate unbounded concurrency. For the most part, high concurrency is essential for achieving impressive performance. But if the clients end up overwhelming the database with requests at a pace that it can’t handle, throughput suffers, then latency rises as a side effect.
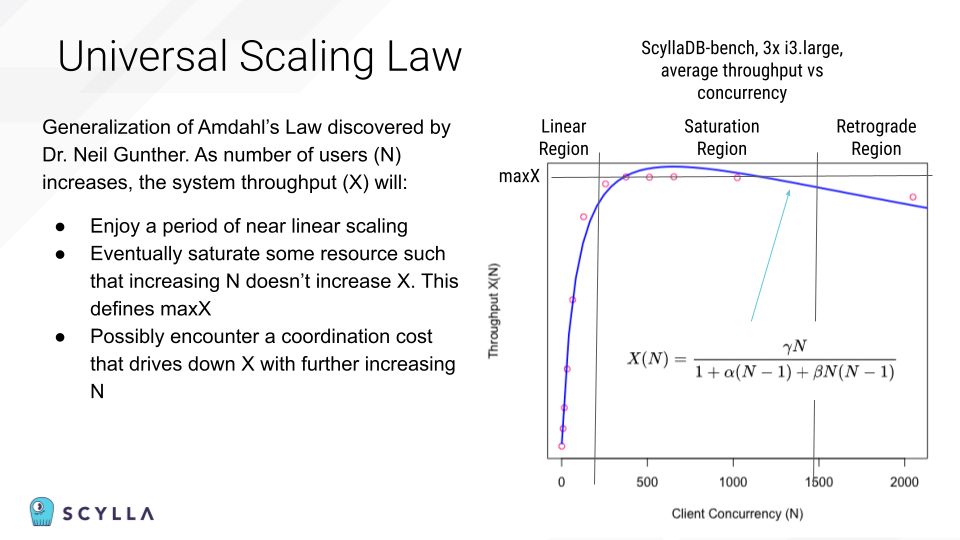
As Brian explained, knowing exactly how hard you can push your database is key for facing throughput challenges, like Black Friday surges, without a hitch. Identifying that precise tipping point begins with the Universal Scaling Law, which states that as the number of users (N) increases, the system throughput (X) will:
- Enjoy a period of near linear scaling
- Eventually saturate some resource such that increasing the number of users doesn’t increase the throughput
- Possibly encounter a coordination cost that drives down the throughput with further increasing number of users
Here’s how that USL applies to a database…
In the linear region, throughput is directly proportional to concurrency. The size of the cluster will determine how large the linear region is. You should engineer your system to take full advantage of the linear region.
In the saturation region, throughput is approximately constant, regardless of concurrency. At this point, assuming a well-tuned cluster and workload, you are writing to the system as fast as the durable storage can take it. Concurrency is no longer a mechanism to increase throughput and is now becoming a risk to stability. You should engineer your system to stay out of the saturation region.
In the retrograde region, increasing concurrency now decreases throughput. A system that enters this region is likely to get stuck here until demand declines. The harder you push, the less throughput you get and the more demand builds which makes you want to push harder. However, “pushing harder” consumes more client resources. This is a vicious cycle and you are now on “the road to hell.”
That’s just a very high level look at the first part of the talk. Watch the complete video to hear more about:
- How Brian determines the bounds of these regions for his specific database and workload
- How the database operates in each region and what it means for the team
- Ways you can find more concurrency to throw at ScyllaDB when you’re in that magical linear region
- His 3 top tips for getting the most out of ScyllaDB’s “awesome concurrency”
This talk stirred up some great discussion, so we wanted to share some of the highlights here.
What about adaptive database concurrency limits?
Q: Configuring fixed concurrency limits is not a new way to ensure one has a stable system. A situation which often happens is that the values you previously benchmarked through your performance testing could quickly become stale – due to data or coding changes and natural application autoscaling to meet newer real-world demands. For example, Netflix has a nice write-up around the topic where they implemented Adaptative Concurrency Limits in order to address this situation. Is this something that you already implement or have considered implementing at Optimizely, and do you have any tips for the audience?
A: Great question. So static concurrency limits are a hazard – you should know that in advance. A small subset of problems can work fine under static concurrency limits, but most can’t. Because most of our systems auto scale, most of our database clusters are shared by multiple things.
You need to recognize that the USL fit you made for your cluster is, unfortunately, also a snapshot in time. You got a snapshot of the USL on the day you measured it, or the days you measured it, but it’s going to change as you change your software, as hardware potentially degrades, as you add users to the cluster in the background that are soaking up some of that performance, as backups that you didn’t measure during your peak performance testing kick in and do their thing. The real safe concurrency limit is always dynamic.
The way I’ve tackled that is actually based on a genius suggestion from a former manager who loved digging into foundational tech. He suggested applying the TCP congestion control algorithm. That is the algorithm that operates way down on the network stack, deciding how big a chunk of data to send at once. It chooses the size and sends a chunk. Then if that chunk size fails, it chooses a smaller size and sends a chunk. If that succeeds, it scales up the chunk size. So you have this dynamic tuning that finds the chunk size that yields the maximum throughput for whatever network “weather” you’re sitting on. Network conditions are dynamic just like database conditions. They’re solving the same problem.
I applied the TCP congestion control algorithm to choosing concurrency. So if things are going fine, and the weather at Scylla land is good, then I scale up concurrency, do a little more. If the weather is getting kind of choppy, things are slowing down, I scale it down. So that’s the way that I dynamically manage concurrency. It works very well in this autoscaling, multiple clients sort of real world scenario.
What’s the impact of payload size on concurrency?
Q: What is the impact of payload record size? Correct me if I’m wrong, but I think that the larger your payload gets, the less concurrency you have to apply to your system, right?
A: Exactly. Remember, the fundamental limiter is the SSD. So bigger payloads means more throughput hitting the SSD per request. That’s a first order effect. My recommendation would be to base your testing on your average payload size if your workload is fairly smooth. If things are significantly variable over time (e.g. that average swings around dynamically throughout the day) then I would tune to the maximum payload size. The most pessimistic (aka safe) tuning would be to find the maximum payload size that your system allows, then fit the USL under those test conditions.
How do you address workloads that are spiky by nature?
Q: No system supports unlimited concurrency. Otherwise, no matter how fast your database is, you’ll eventually end up reaching the retrograde region. Do you have any recommendations for workloads that are unbound and/or spiky by nature?
A: Yeah, in my career, all workloads are spiky so you always get to solve this problem. You need to think about what happens when the wheels fall off. When work bunches up, what are you going to do? You have two choices. You can queue and wait or you can load shed. You need to make that choice consistently for your system. Your chosen scale chooses a throughput you can handle within SLA. Your SLA tells you how often you’re allowed to violate your latency target so make sure the reality you’ve observed violates your design throughput well less than the limit your SLA requires. And then when reality drives you outside that window, you either queue and wait and blow up your latency or you load shed and effectively force the user to implement the queue themselves. Load shedding is not magic. It’s just choosing to force the user to implement the queue.
Note: ScyllaDB supports configuring concurrency limiters per shard or throughput limits per partition. [Learn more – Retaining Goodput with Query Rate Limiting]
How can limiting concurrency help you achieve your desired throughput?
Q: One of the situations that we see fairly often happening is when your concurrency goes too high, and then you reach the retrograde region and just see your throughput going down. Latency goes up, your throughput goes down, you start seeing timeouts, errors, etc, and so on. And then the general feedback that we’re going to provide is that you have to fix your concurrency. People don’t understand how reducing their concurrency can actually help them to achieve their desired throughput. Could you elaborate a bit on that?
A: Well, first I’ll tell a story. The basis for this talk was a system that encountered high partition cardinality. This led to lots of concurrent requests to ScyllaDB. From my perspective, it looked like ScyllaDB’s performance just tanked, even though the problem was really on our side. It was a frustrating day. Another law of nature is that your bad day happens at the worst possible time. In my case, huge cardinality happened on Black Friday (because obviously there’s a lot going on that day…). The thing to know is that when you’re thinking about throughput, your primary knob is concurrency. So if you have a throughput problem, go back to your primary knob. You’re observing your concurrency right? (I wasn’t, but I am now.)
How to run open-loop testing with Rust and ScyllaDB?
Ok, this wasn’t part of the Q & A – but Brian developed a great tool, and we wanted to highlight it. We’ll let Brian explain:
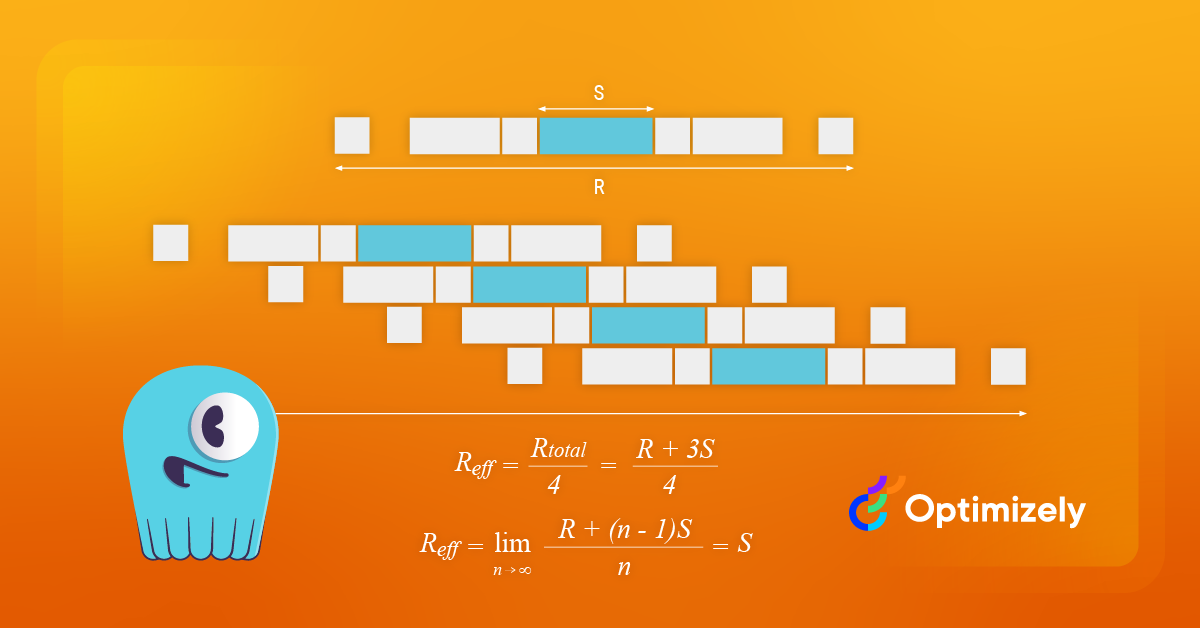
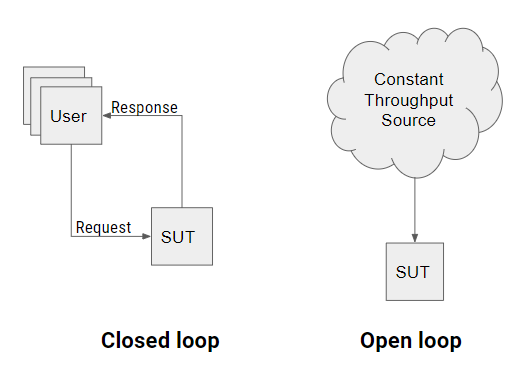
With classic closed loop load testing, simulated users have up to one request in flight at any time. Users must receive the response to their request before issuing the next request. This is great for fitting the USL because we’re effectively choosing X when we choose users. But, in my opinion, it’s not directly useful for modern capacity testing.
Modern open loop load testing does not model users or think times. Instead, it models the load as a constant throughput load source. This is a match for capacity planning for internet connected systems where we typically know requests per second but don’t really know or care how many users are behind that load. Concurrency is theoretically unbounded in an open-loop test: This is the property that lets us open our eyes to how the saturation and retrograde regions will look when our system encounters them in real life.
As I was developing this talk, unfortunately, I couldn’t find an open loop load tester for ScyllaDB – so I wrote one. scylla-bench: constant cate (CRrate) simulates a constant rate load and delivers it to ScyllaDB with variable concurrency. The name is also a bad Rust pun.
It’s an open-loop ScyllaDB load testing tool developed in the creation of this talk. It is intended to complement the ScyllaDB-provided closed-loop testing tool, scylla-bench. It overcomes coordinated omission using the technique advocated in my P99 CONF talk.