How we implemented ScyllaDB’s per-partition rate limit feature and the impact on “goodput”
Distributed database clusters operate best when the data is spread across a large number of small partitions, and reads/writes are spread uniformly across all shards and nodes. But misbehaving client applications (e.g., triggered by bugs, malicious actors, or unpredictable events sending something “viral”) could suddenly upset a previously healthy balance, causing one partition to receive a disproportionate number of requests. In turn, this usually overloads the owning shards, creating a scenario called a “hot partition” and causing the total cluster latency to worsen.
To prevent this, ScyllaDB’s per-partition rate limit feature allows users to limit the rate of accepted requests on a per-partition basis. When a partition exceeds the configured limit of operations of a given type (reads/writes) per second, the cluster will then start responding with errors to some of the operations for that partition. That way, the rate of accepted requests is statistically kept at the configured limit. Since rejected operations use fewer resources, this alleviates the “hot partition” situation.
This article details why and how we implemented this per-partition rate limiting and measures the impact on “goodput”: the amount of useful data being transferred between clients and servers.
Background: The “Hot Partition” Problem
To better understand the problem we were addressing, let’s first take a quick look at ScyllaDB’s architecture. ScyllaDB is a distributed database. A single cluster is composed of multiple nodes, and each node is responsible for storing and handling a subset of the total data set. Furthermore, each node is divided into shards. A single shard is basically a CPU core with a chunk of RAM assigned to it. Each of a node’s shards handles a subset of the data the node is responsible for. Client applications that use our drivers open a separate connection to each shard in the cluster. When the client application wants to read or write some data, the driver determines which shard owns this data and sends the request directly to that shard on its dedicated connection. This way, the CPU cores rarely have to communicate with each other, minimizing the cross-core synchronization cost. All of this enables ScyllaDB to scale vertically as well as horizontally.
The most granular unit of partitioning is called a partition. A partition in a table is a set of all rows that share the same partition key. For each partition, a set of replica nodes is chosen. Each of the replicas is responsible for storing a copy of the partition. While read and write requests can be handled by non-replica nodes as well, the coordinator needs to contact the replicas in order to execute the operation. Replicas are equal in importance and not all have to be available in order to handle the operation (the number required depends on the consistency level that the user set).
This data partitioning scheme works well when the data and load are evenly distributed across all partitions in the cluster. However, a problem can occur when one partition suddenly starts receiving a disproportionate amount of traffic compared to other partitions. Because ScyllaDB assigns only a part of its computing resources to each partition, the shards on replicas responsible for that partition can easily become overloaded. The architecture doesn’t really allow other shards or nodes to “come to the rescue,” therefore even a powerful cluster will struggle to serve requests to that partition. We call this situation a “hot partition” problem.
Moreover, the negative effects aren’t restricted to a single partition. Each shard is responsible for handling many partitions. If one of those partitions becomes hot, then any partitions that share at least a single replica shard with that overloaded partition will be impacted as well.
It’s the Schema’s Fault (Maybe?)
Sometimes, hot partitions occur because the cluster’s schema isn’t a great fit for your data. You need to be aware of how your data is distributed and how it is accessed and used, then model it appropriately so that it fits ScyllaDB’s strengths and avoids its weaknesses. That responsibility lies with you as the system designer; ScyllaDB won’t automatically re-partition the data for you.
It makes sense to optimize your data layout for the common case. However, the uncommon case often occurs because end-users don’t always behave as expected. It’s essential that unanticipated user behavior cannot bring the whole system to a grinding halt.
What’s more, something inside your system itself could also stir up problems. No matter how well you test your code, bugs are an inevitable reality. Lurking bugs might cause erratic system behavior, resulting in highly unbalanced workloads. As a result, it’s important to think about overload protection at the per-component level as well as at the system level.
What is “Goodput” and How Do You Maintain It?
My colleague Piotr Sarna explained goodput as follows in the book Database Performance at Scale:
“A healthy distributed database cluster is characterized by stable goodput, not throughput. Goodput is an interesting portmanteau of good + throughput, and it’s a measure of useful data being transferred between clients and servers over the network, as opposed to just any data. Goodput disregards errors and other churn-like redundant retries, and is used to judge how effective the communication actually is.
This distinction is important.
Imagine an extreme case of an overloaded node that keeps returning errors for each incoming request. Even though stable and sustainable throughput can be observed, this database brings no value to the end user.”
With hot partitions, requests arrive faster than the replica shards can process them. Those requests form a queue that keeps growing. As the queue grows, requests need to wait longer and longer, ultimately reaching a point where most requests fail because they time out before processing even begins. The system has good throughput because it accepts a lot of work, but poor goodput because most of the work will ultimately be wasted.
That problem can be mitigated by rejecting some of the requests when we have reason to believe that we won’t be able to process all of them. Requests should be rejected as early as possible and as cheaply as possible in order to leave the most computing resources for the remaining requests.
Enter Per-Partition Rate Limiting
In ScyllaDB 5.1 we implemented per-partition rate limiting which follows that idea. For a given table, users can specify a per-partition rate limit: one for reads, another for writes. If the cluster detects that the reads or writes for a given partition are starting to exceed that user-defined limit, the database will begin rejecting some of the requests in an attempt to keep the rate of unrejected requests below the limit.
For example, the limit could be set as follows:
ALTER TABLE ks.tbl
WITH per_partition_rate_limit = {
    'max_writes_per_second': 100,
    'max_reads_per_second': 200
};
We recommend that users set the limit high enough to avoid reads/writes being rejected during normal usage, but also low enough so that ScyllaDB will reject most of the reads/writes to a partition when it becomes hot. A simple guideline is to estimate the maximum expected reads/writes per second and apply a limit that is an order of magnitude higher.
Although this feature tries to accurately apply the defined limit, the actual rate of accepted requests may be higher due to the distributed nature of ScyllaDB. Keep in mind that this feature is not meant for enforcing strict limits (e.g. for API purposes). Rather, it was designed as an overload protection mechanism. The following sections will provide a bit more detail about why there’s sometimes a discrepancy.
How Per-Partition Rate Limiting Works
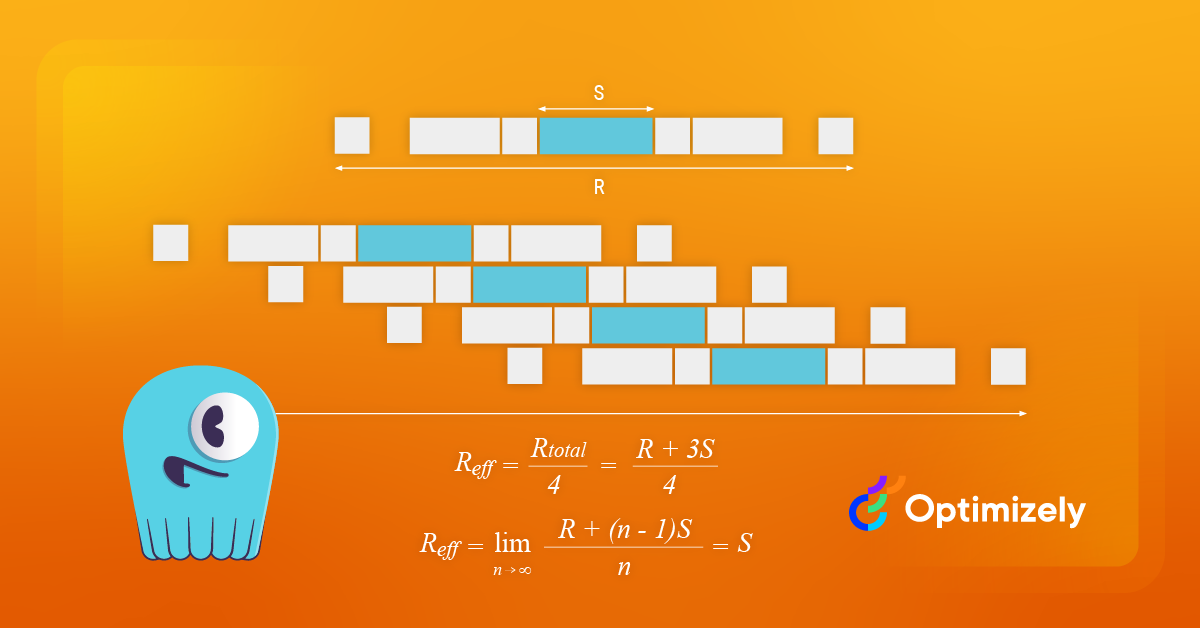
To determine how many requests to reject, ScyllaDB needs to estimate the request rate for each partition. Because partitions are replicated on multiple nodes and not all replicas are usually required to perform an operation, there is no obvious single place to track the rate. Instead, we perform measurements on each replica separately and use them to estimate the rate.
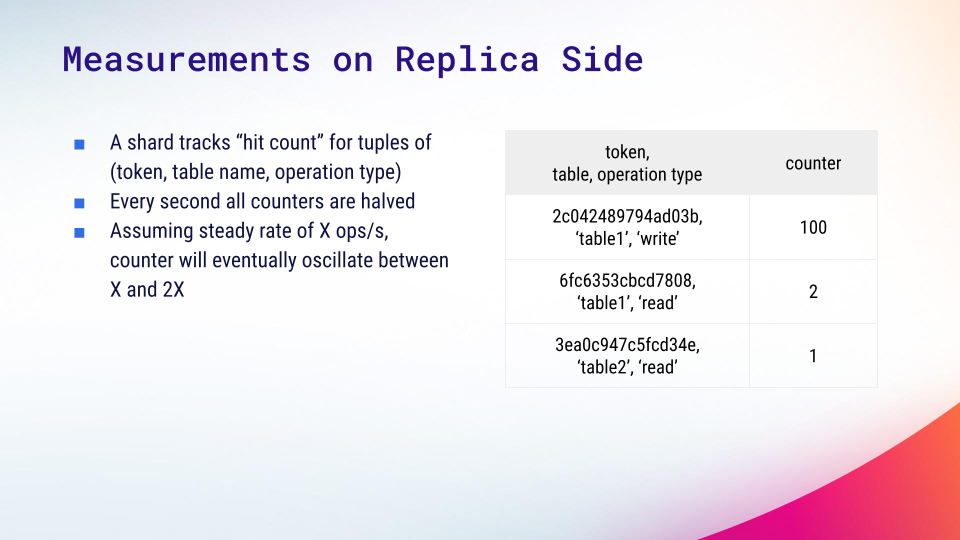
Let’s zoom in on a single replica and see what is actually being measured. Each shard keeps a map of integer counters indexed by token, table, and operation type. When a partition is accessed, the counter relevant to the operation is increased by one. On the other hand, every second we cut every counter in half, rounding towards zero. Due to this, it is a simple mathematical exercise to show that if a partition has a steady rate of requests, then the counter value will eventually oscillate between X and 2*X, where X is the rate in terms of requests per second.
We managed to implement the counter map as a hashmap that uses a fixed, statically allocated region of memory that is independent from the number of tables or the size of the data set. We employ several tricks to make it work without losing too much accuracy. You can review the implementation here.
Case 1: When the coordinator is a replica
Now, let’s see how these counters are used in the context of the whole operation. Let’s start with the case where the coordinator is also a replica. This is almost always the case when an application uses a properly configured shard-aware driver for ScyllaDB [learn more about shard-aware drivers].
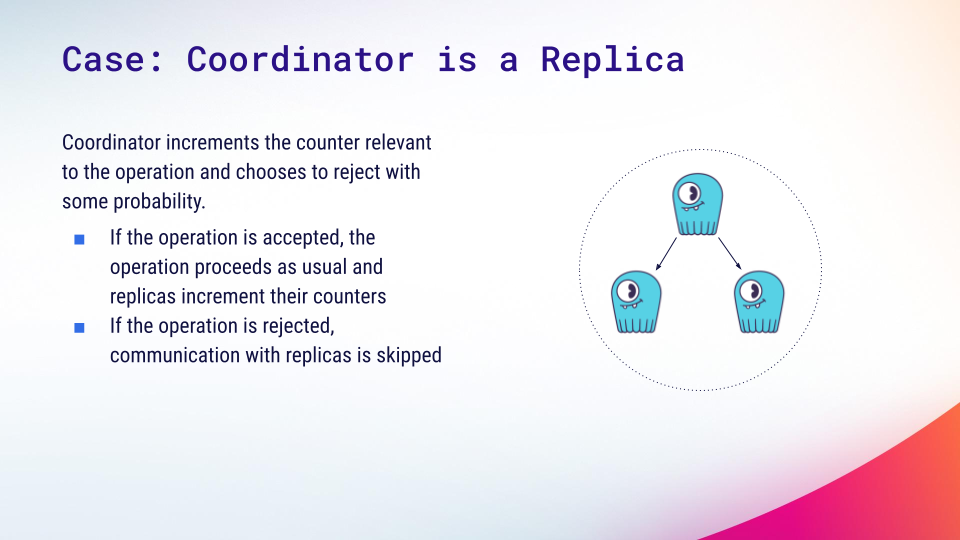
Because the coordinator is a replica, it has direct access to one of the counters for the partition relevant to the operation. We let the coordinator make a decision based only on that counter. If it decides to accept the operation, it then increments its counter and tells other replicas to do the same. If it decides to reject it, then the counter is only incremented locally and replicas are not contacted at all. Although skipping the replicas causes some undercounting, the discrepancy isn’t significant in practice – and it saves processing time and network resources.
Case 2: When the coordinator is not a replica
When the coordinator is not a replica, it doesn’t have direct access to any of the counters. We cannot let the coordinator ask a replica for a counter because it would introduce additional latency – and that’s unacceptable for a mechanism that is supposed to be low cost. Instead, the coordinator proceeds with sending the request to replicas and lets them decide whether to accept or reject the operation. Unfortunately, we cannot guarantee that all replicas will make the same decision. If they don’t , it’s not the end of the world, but some work will go to waste.
Here’s how we try to reduce the chance of that happening. First, cutting counters in half is scheduled to happen at the start of every second, according to the system clock. ScyllaDB depends on an accurate system clock, so cutting counters on each node should be synchronized relatively well. Assuming this and that nodes accept a similar, steady rate of replica work, the counter values should be close to each other most of the time.
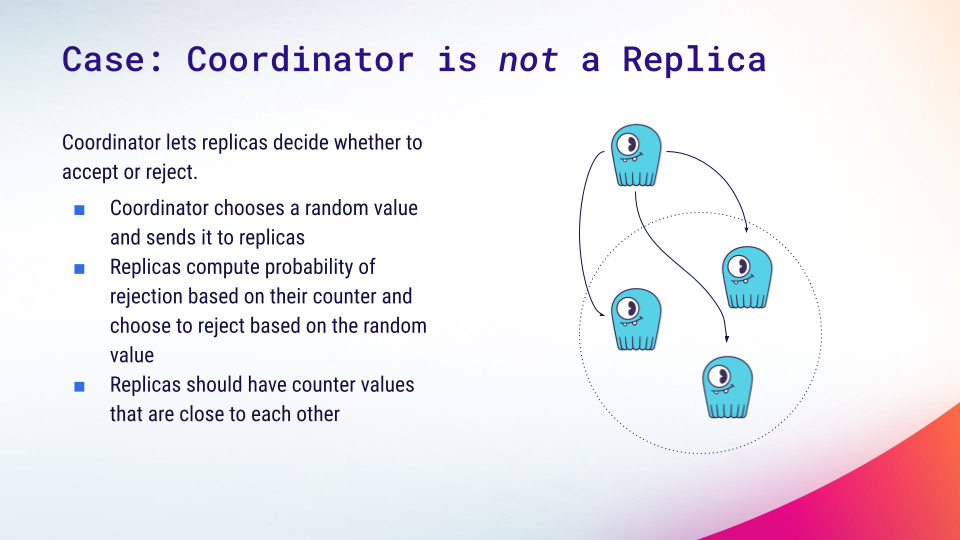
Second, the coordinator chooses a random number from range 0..1 and sends it along with a request. Each replica computes the probability of rejection (calculated based on the counter value) and rejects if the coordinator sends a number below it. Because counters are supposed to be close together, replicas will usually agree on the decision.
Read vs Write Accuracy
There is one important difference in measurement accuracy between reads and writes that is worth mentioning. When a write operation occurs, the coordinator asks all live replicas to perform the operation. The consistency level only affects the number of replicas the coordinator is supposed to wait for. All live replicas increment their counters for every write operation so our current calculations are not affected.
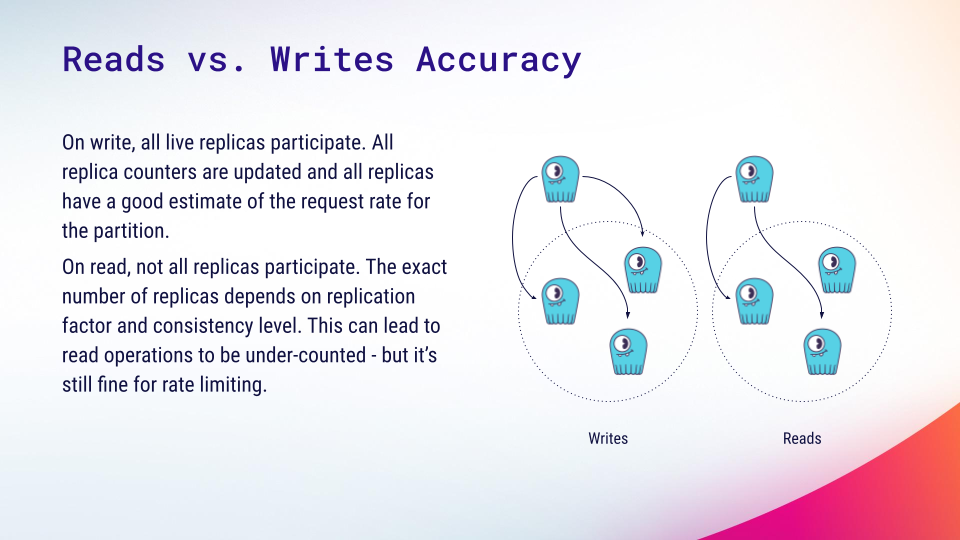
However, in the case of reads, the consistency level also affects the number of replicas contacted. It can lead to the shard counters being incremented fewer times than in the case of writes. For example, with replication factor 3 and a quorum consistency level, only 2 out of 3 replicas will be contacted for each read. The cluster will think that the real read rate is proportionally smaller, which can lead to a higher rate of requests being accepted than the user limit allows. We found this acceptable for an overload prevention solution where it’s more important to prevent the cluster performance from collapsing rather than enforcing some strict quota.
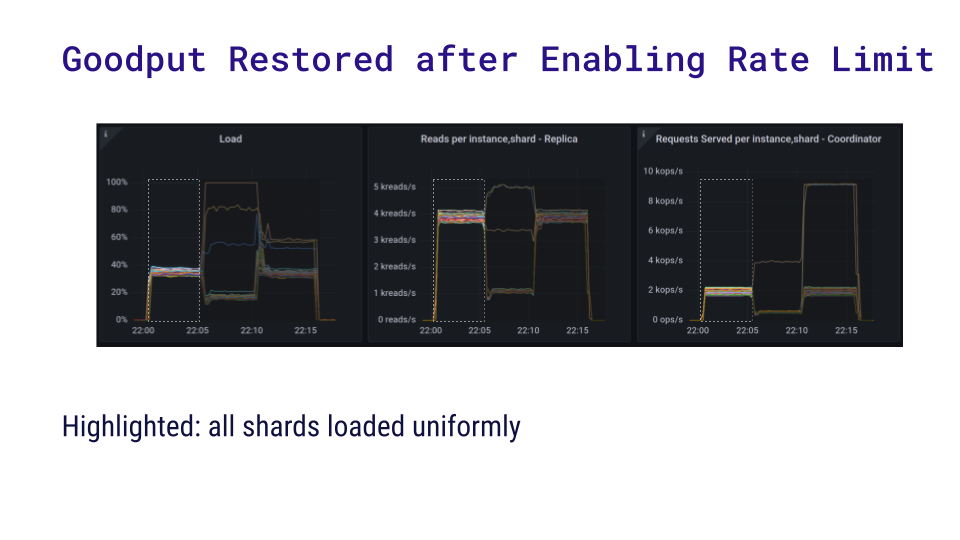
Results: Goodput Restored after Enabling Rate Limit
Here is a benchmark that demonstrates the usefulness of per-partition rate limiting. We set up a cluster on 3 i3.4xlarge AWS nodes with ScyllaDB 5.1.0-rc1. We pre-populated it with a small data set that fit in memory. First, we ran a uniform read workload of 80k reads per second from a c5.4xlarge instance – this represents the first section on the following charts. (Note that the charts show per-shard measurements.)
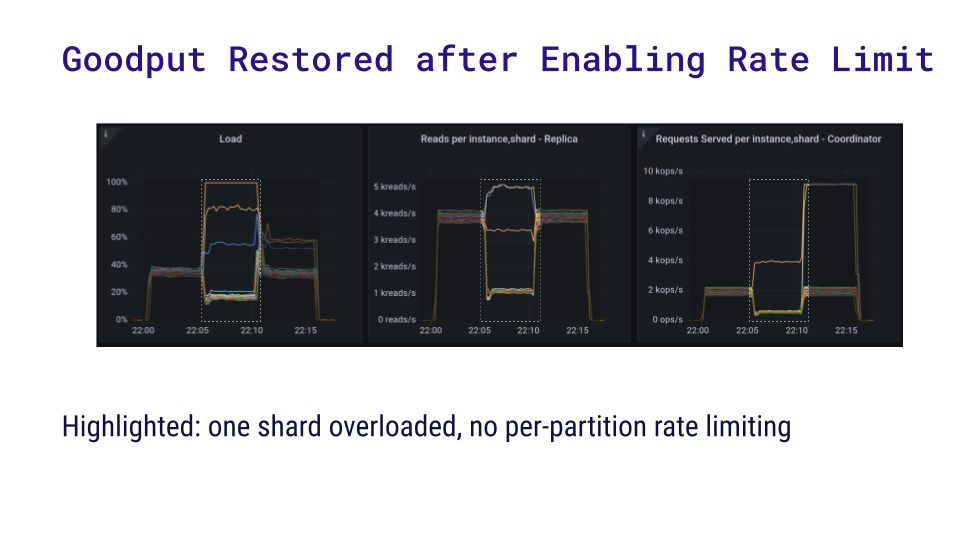
Next, we started another loader instance. Instead of reading uniformly, this loader performed heavy queries on a single partition only – 8 times as much concurrency and 10 times the data fetched for each read. As expected, three shards become overloaded. Because the benchmarking application uses fixed concurrency, it becomes bottlenecked on the overloaded shards and its read rate dropped from 80k to 26k requests per second.
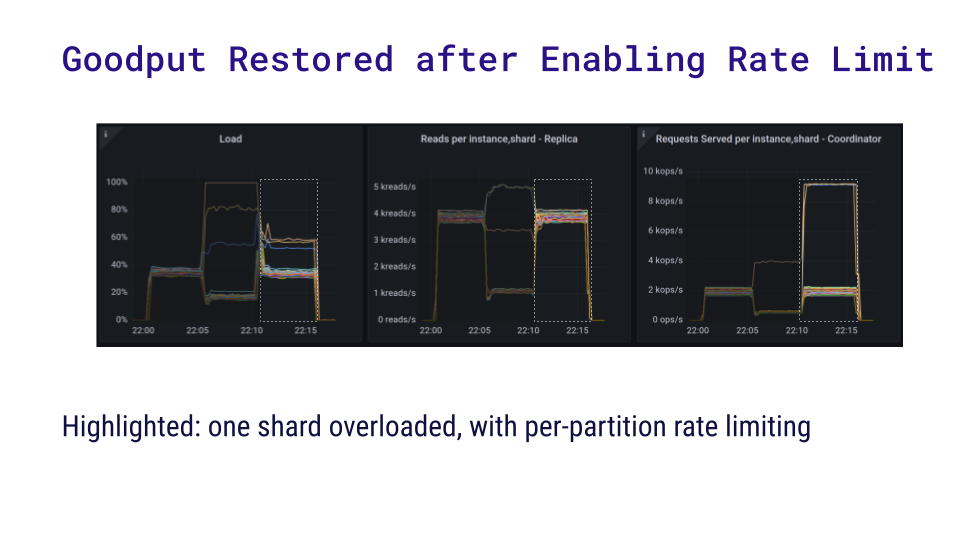
Finally, we applied a per-partition limit of 10 reads per second. Here the chart shows that the read rate recovered. Even though the shards that were previously overloaded now coordinate many more requests per second, nearly all of the problematic requests are rejected. This is much cheaper than trying to actually handle them, and it’s still within the capabilities of the shards.
Summary
The article explored ScyllaDB’s solution to the “hot partition” problem in distributed database clusters through per-partition rate limiting. This capability was designed to maintain stable performance under stress by rejecting excess requests to maintain stable goodput. The implementation works by estimating request rates for each partition and making decisions based on those estimates. And benchmarks confirmed how rate limiting restored goodput, even under stressful conditions, by rejecting problematic requests.
You can read the detailed design notes at
https://github.com/scylladb/scylladb/blob/master/docs/dev/per-partition-rate-limit.md
On another note, we encountered some very strange error reporting performance issues while working on per-partition query rate limiting. My follow-up blog “Better “Goodput” Performance through C++ Exception Handling” provides more details about what was going on — and shares how we addressed it through C++ exception handling