
Editor’s Note: P99 CONF 2022 is now a wrap! You can (re)watch all videos and access the decks now.
ACCESS ALL THE VIDEOS AND DECKS NOW
Day 1 of P99 CONF kicked off with “misery metrics” and ended with a look at P99 latency reduction as a Sisyphean task. In between, engineers spoke of their many hard-fought performance battles and lessons learned – across infrastructure engineering, programming languages, and even the art and science of measuring performance.
And thousands of engineers attending live had a great time digging into all this pain and suffering. After all, where else can you instantly connect with dozens of top engineers sharing the wisdom gained from years (sometimes decades) of wrestling with the toughest performance challenges on the planet? Only at P99 CONF.
Day 1 of P99 CONF featured over 30 engineering talks, incisive Q&A, and captivating conversations with (and even among) speakers in the lively Speakers Lounge. If you missed it, here’s the lowdown on what transpired.
Gil Tene: Misery Metrics & Consequences
 Gil’s now legendary “oh sh*t” talk has prompted many engineers to rethink their approach to measuring P99 and similar latencies. But after obsessing over how to improve performance measurement for over a decade and seeing how distributed systems are evolving, Gil’s own approach to the topic has also evolved.
From Dr. Strangelove, to The Matrix, to sacrificial goats, Gil took the audience on a journey that ranged from high latency peaks to a trough of measurement despair. He deconstructed what we’re really looking at with “all the pretty charts,” and, more importantly, what we’re missing. This talk will leave you wondering what’s really going on behind the charts you see across our event logos – and probably thinking quite a bit about the very idea of P99. At what seems to be the bottom of the trough of despair, Gil shows a rather terrifying example of how actions that improve performance on a chart can seriously undermine the end user experience. Misery indeed.
But Gil remains confident that it is in fact possible to overcome the shortcomings of our accepted performance measurement methodologies…just not in the way he originally believed we could. There’s hope in misery. A light at the end of the tunnel. Rainbows, even (perhaps because Gil was joining us from Hawaii). As it turns out, engineers can prevent misery by learning to love misery. And if that doesn’t yet make sense to you, it’s time to grab the red pill and watch his session.

Liz Rice: Using eBPF for High-Performance Networking in Cilium
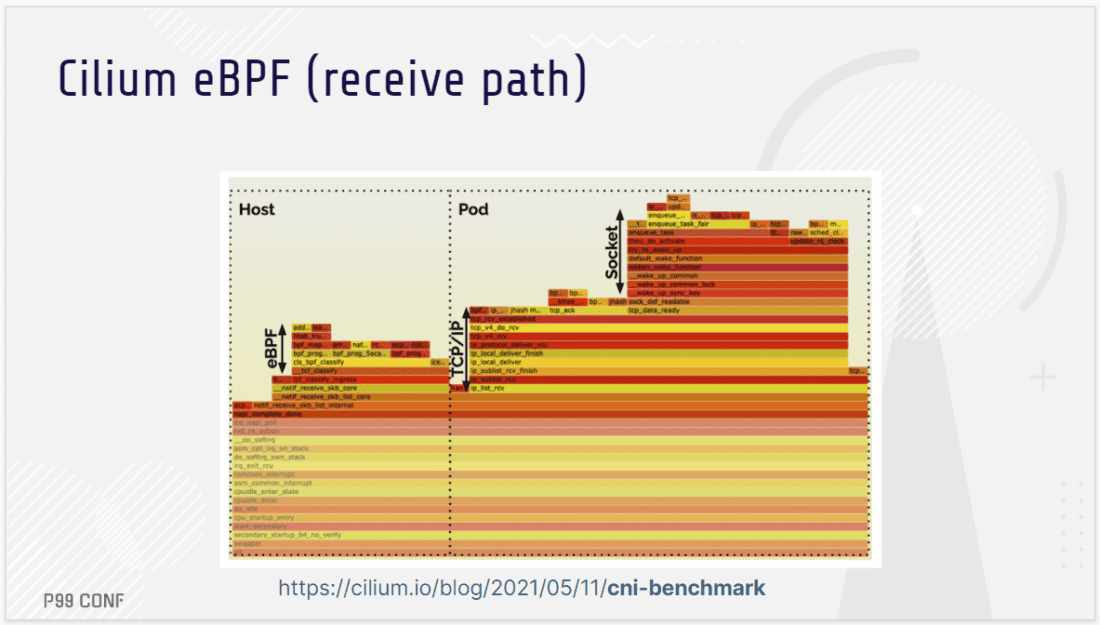
 Liz Rice walked attendees through how Cilium (part of the CNCF) improves throughput, frees up CPU usage, and makes Kubernetes networking more efficient by using eBPF to bypass parts of the network stack.
Using XDP (eXpress Data Path), Cilium can run eBPF programs on the network interface card – enabling you to take advantage of eBPF as soon as a network packet arrives. For example, as Liz demonstrates, you could use eBPF as a very fast and efficient way to identify and discard “packets of death.” Notably, such a mitigation can be loaded dynamically, without installing a kernel patch or rebooting machines. And that’s just one case of how you can use eBPF to dynamically change the behavior of networking in a system.
eBPF can also be used for manipulating packets; for example to change the source and destination addresses contained in the packets for load balancing. As a packet arrives, an eBPF XDP program can determine where to send it – on that host, or to a different machine – without the packet being processed by the kernel’s networking stack. This enables impressive performance gains (Exhibit A: read how Seznam.cz achieved over 2X better throughput and saved an “unbelievable amount of CPUs usage” by running an XDP-based load balancer vs IPVS one.)
Looking beyond XDP, eBPF programs can be attached to a variety of different points in the network stack – and this is especially helpful when working with the complex networking stack of Kubernetes. As Liz’s demos, flamegraphs, and benchmarks show, this yields yet more opportunities for throughput and CPU gains. Watch the video and see the performance impact for yourself.
Armin Ronacher: Overcoming Variable Payloads to Optimize for Performance
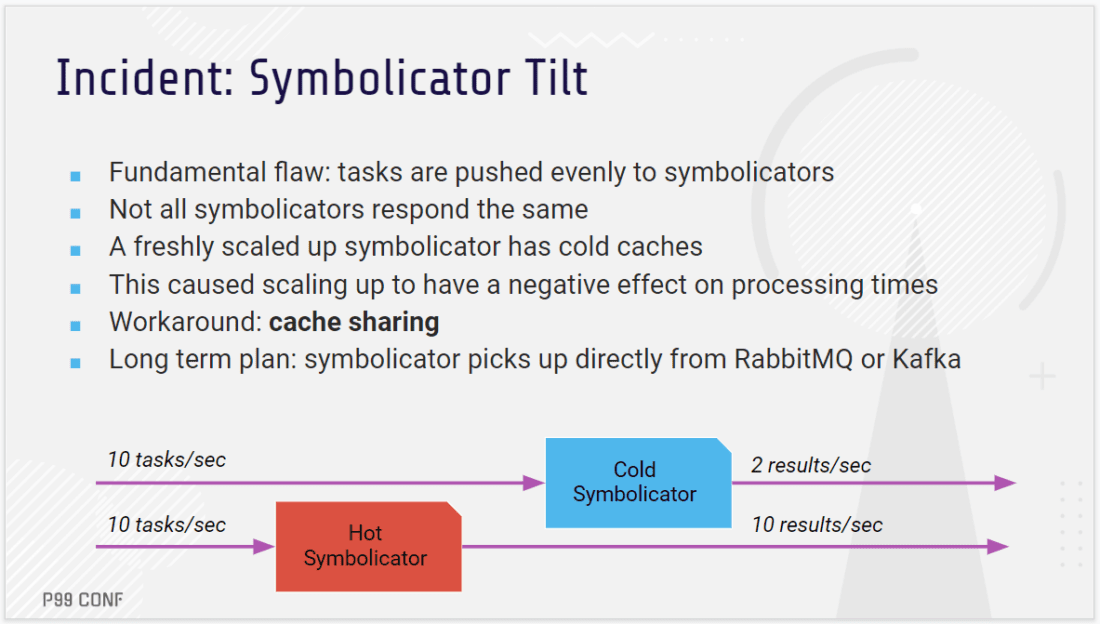
 Armin Ronacher shared his experiences architecting Sentry.io’s event processing pipeline, which is especially interesting (read: confoundingly non-trivial) given that payload sizes can have multiple orders of magnitude difference, the complexity of data impacts processing, and the variable volume of data streams is impossible to predict.
As an error-tracking and monitoring product, Sentry groups error and transaction events by commonality. This requires fast and complex processing as the events come in. Multiple layers of processing might be required to produce an error report that includes a stack trace, source code, tags, and an example screenshot. All this needs to be deduced, almost instantaneously, from a sea of session updates, transaction events, metrics, and many many reports.
This brings quite a few challenges. One is that users expect that reports come in as fast as possible, but an individual crash report can have a high variance of event processing times (from 1 ms to over 30 minutes). The delay depends on a number of factors that often aren’t immediately discernible. Another intricacy: what happens at the end of the pipeline can impact the beginning of it. Also, to ensure that the pipeline can be extended closer and closer to the user, there are two layers to the pipeline: the innermost ingestion system, plus a customer relay (an on-prem proxy) to perform actions like stripping out personal identifiable information (PII) before the data leaves their infrastructure. The data stems from many different sources, and any change to their pipeline – even a bug fix – can break a customer’s workflow.
Not surprisingly, addressing these complex challenges required a carefully crafted, multifaceted strategy. Watch the video to hear how they’ve approached it so far and how they plan to optimize it next.
Dor Laor: 8 Years of Battling P99 Latency
 CEO & Co-founder at ScyllaDBFor 8 years now ScyllaDB, led by Dor Laor, has been battling P99 latency while building an “all weather, all terrain, high throughput, low latency database.” Some might feel that this is a Sisyphean task, but for Dor and everyone at ScyllaDB, it’s a labor of love.
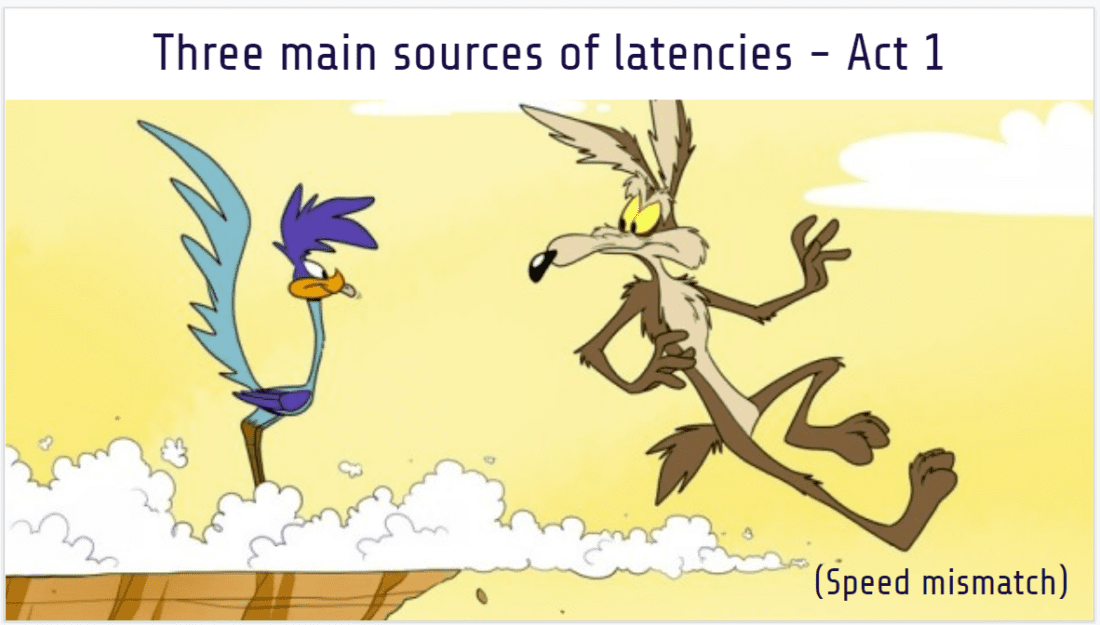
Dor began his keynote by outlining 3 main sources of latency. The first is speed mismatch, most commonly between disk speed and CPU/memory speed. If this mismatch occurs – and the system is not engineered to handle that mismatch – you hit a wall and the P99 latencies are markedly higher than the mean and median latencies. If you’re working on something like a file system or database, this translates to high P99 across the board. After drilling down into the various CPU and I/O differences that drive this speed mismatch, Dor outlines how ScyllaDB addresses it.
The second source of latency should be quite familiar to anyone with a teenager: lack of respect for limits. ScyllaDB, like many other systems, has CPU and I/O schedulers that schedule multiple tasks. Each task has a quota (ours is half a millisecond). By the time a task’s quota is up, it’s supposed to relieve the CPU for other tasks. But, if you get a self-centered task that doesn’t let others have their turn, P99 latency increases. At ScyllaDB, we combat this by having a block detector that alerts us to task quota violations, and even provides us details about what the task was doing at the moment it stalled. Some of the culprits we’ve found include large memory allocations, the memory allocator itself, the cache, the I/O system, and sometimes even in the Linux kernel.
The third core source of P99 latency is imperfect isolation. This is quite common in software. ScyllaDB takes a variety of steps to isolate the CPU and the I/O. For example, to isolate CPUs, we use a shard-per core architecture, which relieves us from locking. Moreover, within every CPU, there’s a scheduler that provides isolation between tasks and ensures that they respect limits. There’s also an I/O scheduler that loads the disk to its sweet spot: the point at which the disk throughput is maximized but I/O isn’t queued and latency is still good. This is done with a userspace I/O scheduler that prioritizes each task: giving tasks that require low latency priority over, say, heavyweight batch tasks such as compaction that are less critical.
But then Dor breaks it open: “What is the most notorious source of latencies? Everywhere. Pretty much everything must be perfect to have a low P99.” This includes culture, disaster recovery, OSes, architecture, disks, protocols, clients, and more. Watch the video for his take on the many impacts on P99 latency, and examples of how they can be addressed.
Track Sessions Across Core Low Latency Themes
The parallel track sessions addressed a broad spectrum of highly specialized topics. Here’s a look at some of the amazing track sessions from Day 1:
- Redpanda’s Alex Gallego showed how implicit limitations in asynchronous programming could be addressed by a 2-phase technique for resolving priority inversion.
- Percona’s Peter Zaitsev explored query optimizations such as parallel queries, asynchronous queries, and queueing complex work to get the most out of your database.
- Vercel’s Malte Ubl discussed the trade-offs of the new paradigm of rendering web pages in the edge, and looked into end-to-end architectures that make it shine.
- Square Engineering’s Omar Elgabry shared how they reduced DynamoDB latencies from >10s to ~500ms after employing three techniques: timeouts, backoff, and jitter.
- Lyft’s Pavlo Stavytsky revealed how they measure CPU load to improve app performance – what metrics they collect, plus how they retrieve and calculate them.
- theScore’s Jeff Utter detailed how and why theScore built Datadex, an aggregator leaf tailer system built for geographically distributed, low-latency queries and real time updates.
- Nobl9’s Alex Hidalgo explained why you may encounter problems if you only think about “nines” setting service reliability targets – and explored better numbers to use instead.
- ScyllaDB’s Pavel Emelyanov provided an inside look at how ScyllaDB implemented an IO scheduler optimized for peak performance on modern NVMe SSDs.
- Optimizely’s Brian Taylor covered how they applied lessons of Gil Tene’s “oh sh*t” talk to understand the surprising sources of latency found in their data pipeline.
- RedisLabs’ Felipe Oliveira shared how Redis developed an automated framework for performance regression testing, telemetry gathering, profiling, and data visualization upon code commit.
- Criteo’s Geoffrey Beausire explained how to measure latency in key-value infrastructure from both server and client sides, as well as blackbox monitoring.
- QuestDB’s Vlad Ilyushchenko described how they optimized their database performance using efficient zero garbage collection multithreaded query processing.
- Oracle’s Ron Pressler looked at how Java virtual threads allow higher throughput for the
thread-per-request style by drastically increasing the request capacity of the server. - Microsoft’s Daniele Salvatore Albano presented cachegrand, a SIMD-accelerated hashtable without locks or busy-wait loops using fibers, io_uring, and much more.
WATCH THESE SESSIONS ON DEMAND
Day 2 of All Things Performance
P99 CONF Day 2 continues the conversation on many of the topics covered in Day 1 (Rust, event driven architectures, low latency Linux, and observability) and also expands into new areas like WebAssembly, chaos engineering, and server-side optimization.
On the keynote front, look forward to a lineup of luminaries such as Bryan Cantrill, Charity Majors, and Avi Kivity. Here’s a little mashup tease from their talks.
Curious how this all plays out? Tune in on Thursday and prepare for some lively discussions.
Day 2 also includes over 30 track sessions, including highly anticipated talks like:
- AWS’ Marc Richards using an HTTP benchmark to compare performance of the Linux kernel networking stack with userspace networking doing kernel bypass via DPDK.
- Google’s Steve Rostedt’s insight on using tracing to analyze when the overhead from a Linux host running KVM is higher than expected versus running on bare metal.
- Red Hat’s Bartłomiej Płotka explaining how to find and uncover efficiency problems effectively using the power of modern cloud-native observability and tooling.
- Uber’s Cristian Velazquez detailing how they reduced the cost of compute capacity by implementing a large-scale, semi-automated Go GC tuning mechanism.
- Akita’s Mark Gritter shedding light on why his team went against the current trends– sticking with Golang instead of rewriting their application in Rust.
And just in case you need one more incentive to join live: swag!