
As of ScyllaDB 1.4, ScyllaDB has native support for Prometheus. This post covers ScyllaDB metrics exporting, an overview of Prometheus and how to use the Prometheus API, the Prometheus-Grafana integration, and provides an answer to which came first: the chicken or the egg.
 ScyllaDB version 1.4 introduces a Prometheus API for system monitoring
Metrics Gathered by ScyllaDB
Like most systems, ScyllaDB gathers a variety of metrics, such as memory consumption, the number of objects in the cache, or total operations. The metrics are used in different ways, most notably in the nodetool utility’s output and in dashboard graphs.
Many general dashboard and management solutions use a standard protocol to collect metrics from a system.
Prometheus Server and Protocol
Prometheus, a Cloud Native Computing Foundation project, is a systems and service monitoring system. It collects metrics from configured targets at given intervals, evaluates rule expressions and displays the results, and can trigger alerts if a condition is observed to be true.
Prometheus can display graphs, perform mathematical computations over the selected metrics, can be used as a base for other platforms like Grafana for metric display, and has a set of protocols to get metrics from the servers.
Using the ScyllaDB Prometheus API
Before ScyllaDB version 1.4, the Prometheus integration was based on the collectd API. Collectd is still supported, but with ScyllaDB Prometheus native support, connecting directly is the preferred way.
There is little configuration involved (IP and port) with the ScyllaDB Prometheus API, and Prometheus is enabled by default. Both the Collectd and the Prometheus APIs use the same base infrastructure, so all the metrics that are available via the Collectd are available by Prometheus.
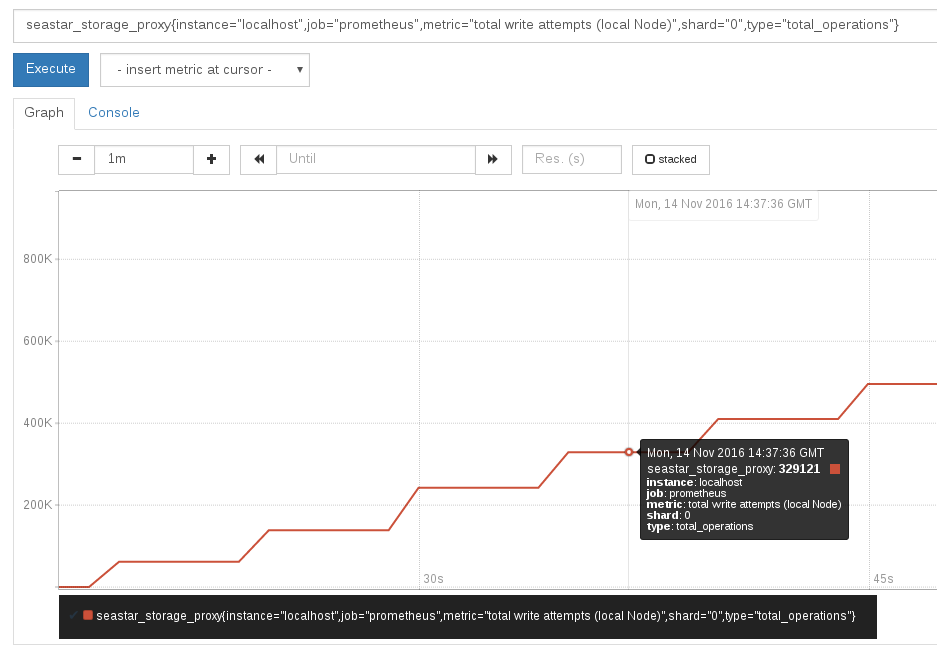
ScyllaDB uses port 9180 by default, so if you have a Prometheus server running, add the ScyllaDB server (ip:9180) to your targets list and you are ready to go.
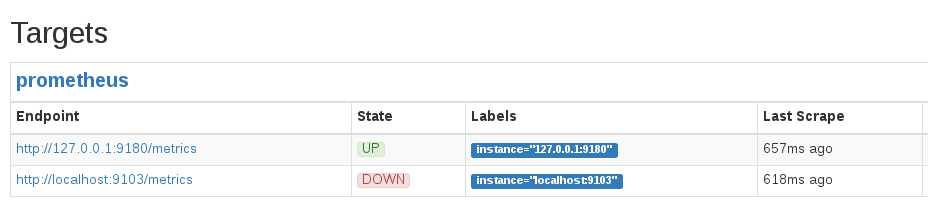
To verify that your Prometheus server is connected, check the status/Targets screen. In the screenshot below, you can see examples of two endpoints–one with ScyllaDB on port 9180 that is up, the second on port 9103 that is not available.
Using the Node Exporter
ScyllaDB exports its own metrics but it is also useful to get the machine metrics. To get the machine metrics, use the node_exporter, which is a utility that exports information about the current machine it runs on.
Starting with ScyllaDB version 1.4, scylla_setup script include a node_exporter installation step, that can install node_exporter and run it as a service.
If you are using Prometheus, we highly recommend using it.
You can always run the node_exporter_install installation script at a later time.
ScyllaDB Dashboards with Prometheus-Grafana
The ScyllaDB Grafana Monitoring dashboard project is a monitoring solution that uses Prometheus as the metrics database and Grafana for displaying the dashboards.
Prometheus and Grafana runs inside Docker-Containers. When setting up the dashboards, you will need to add the nodes to the prometheus.yaml configuration file.
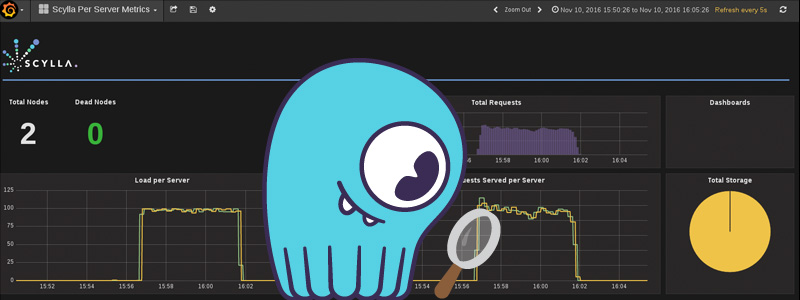
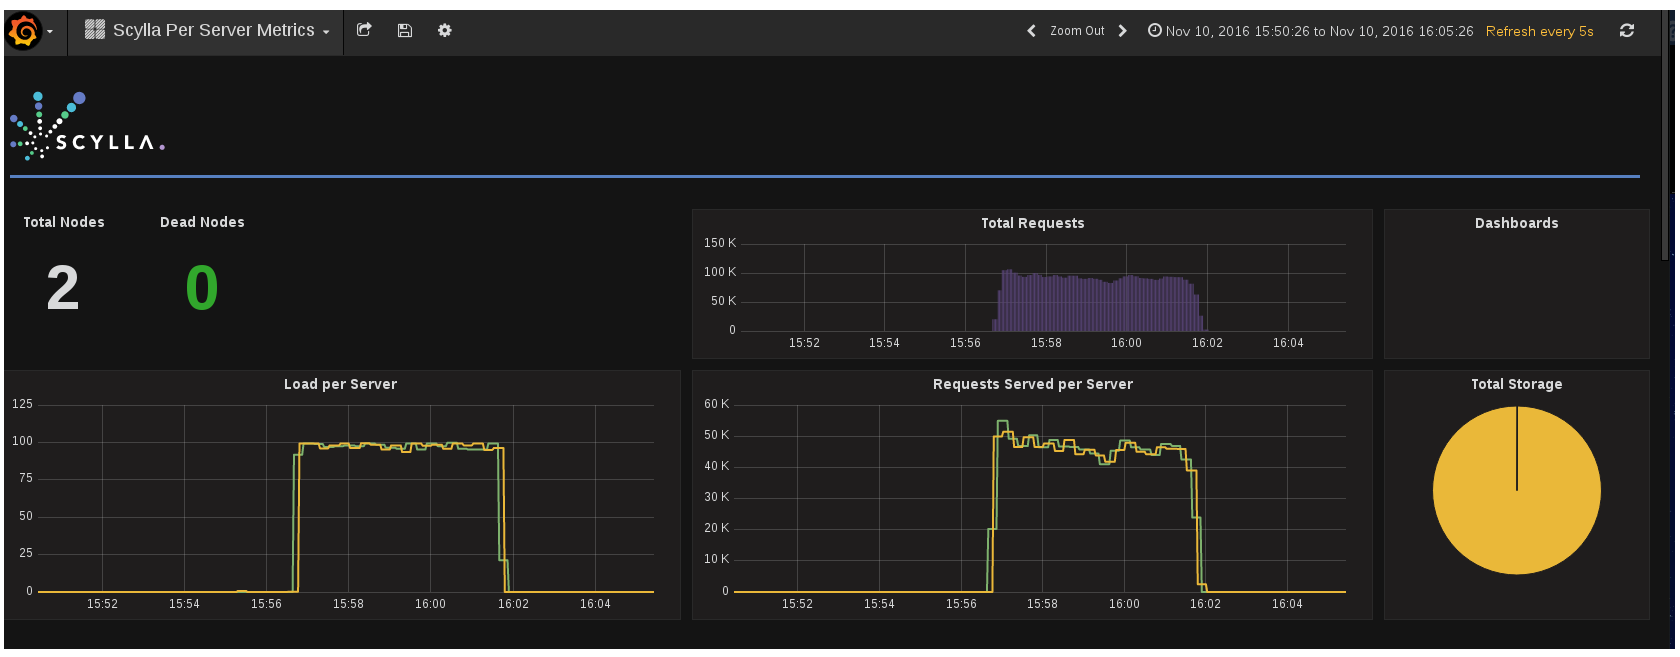
Here are some screenshots from ScyllaDB dashboards.
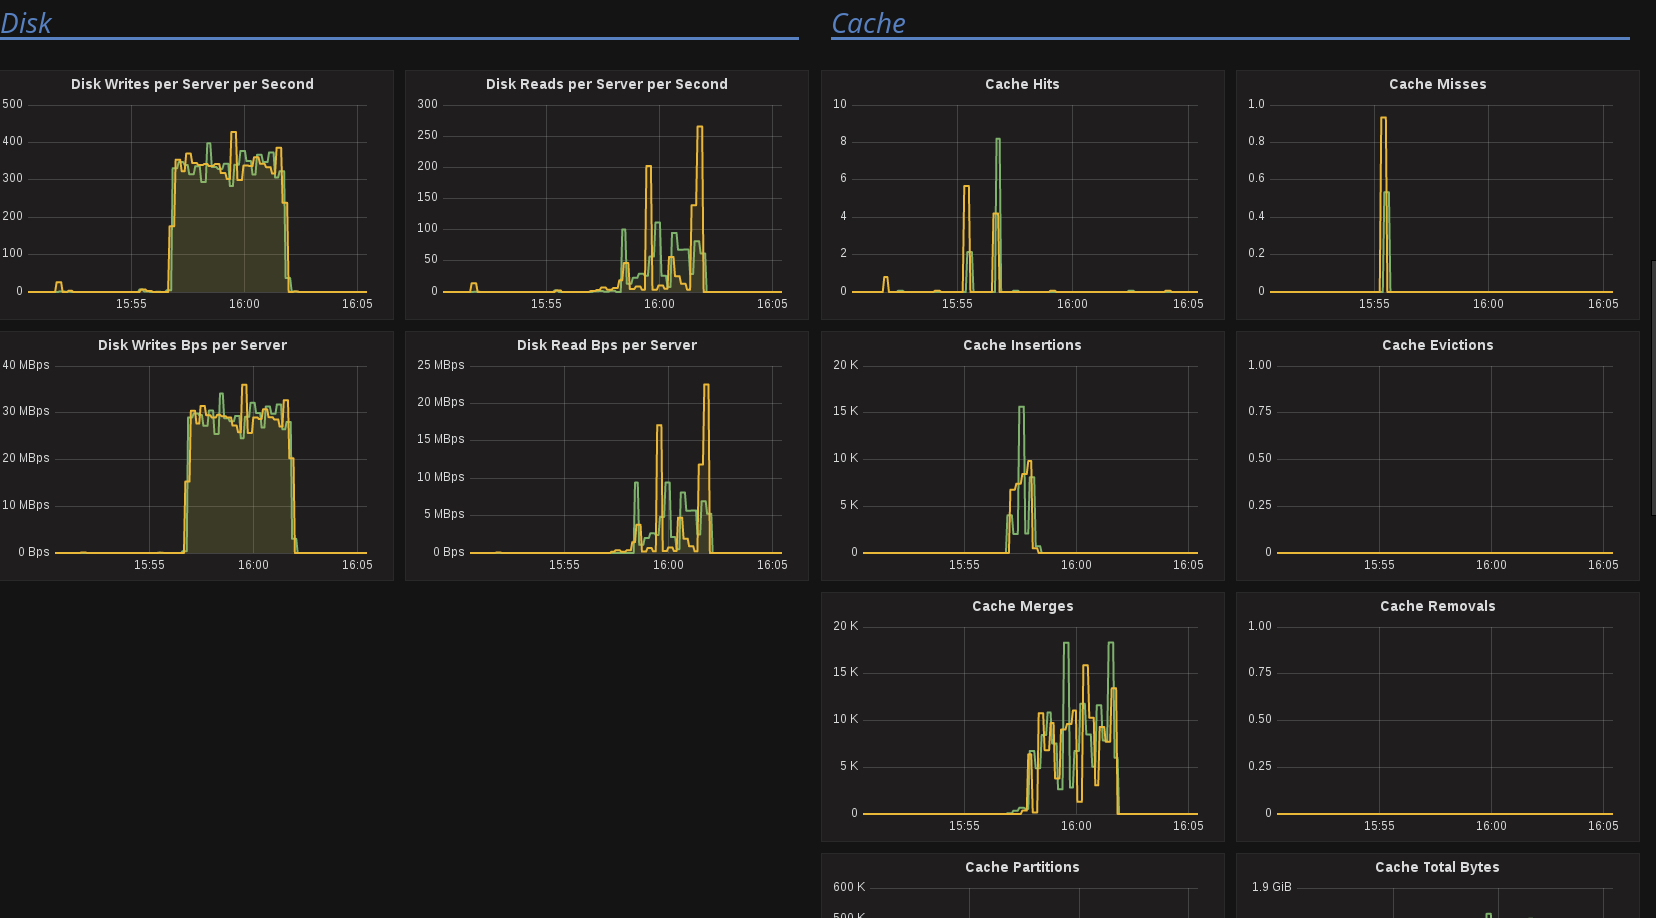 Disk And Cache
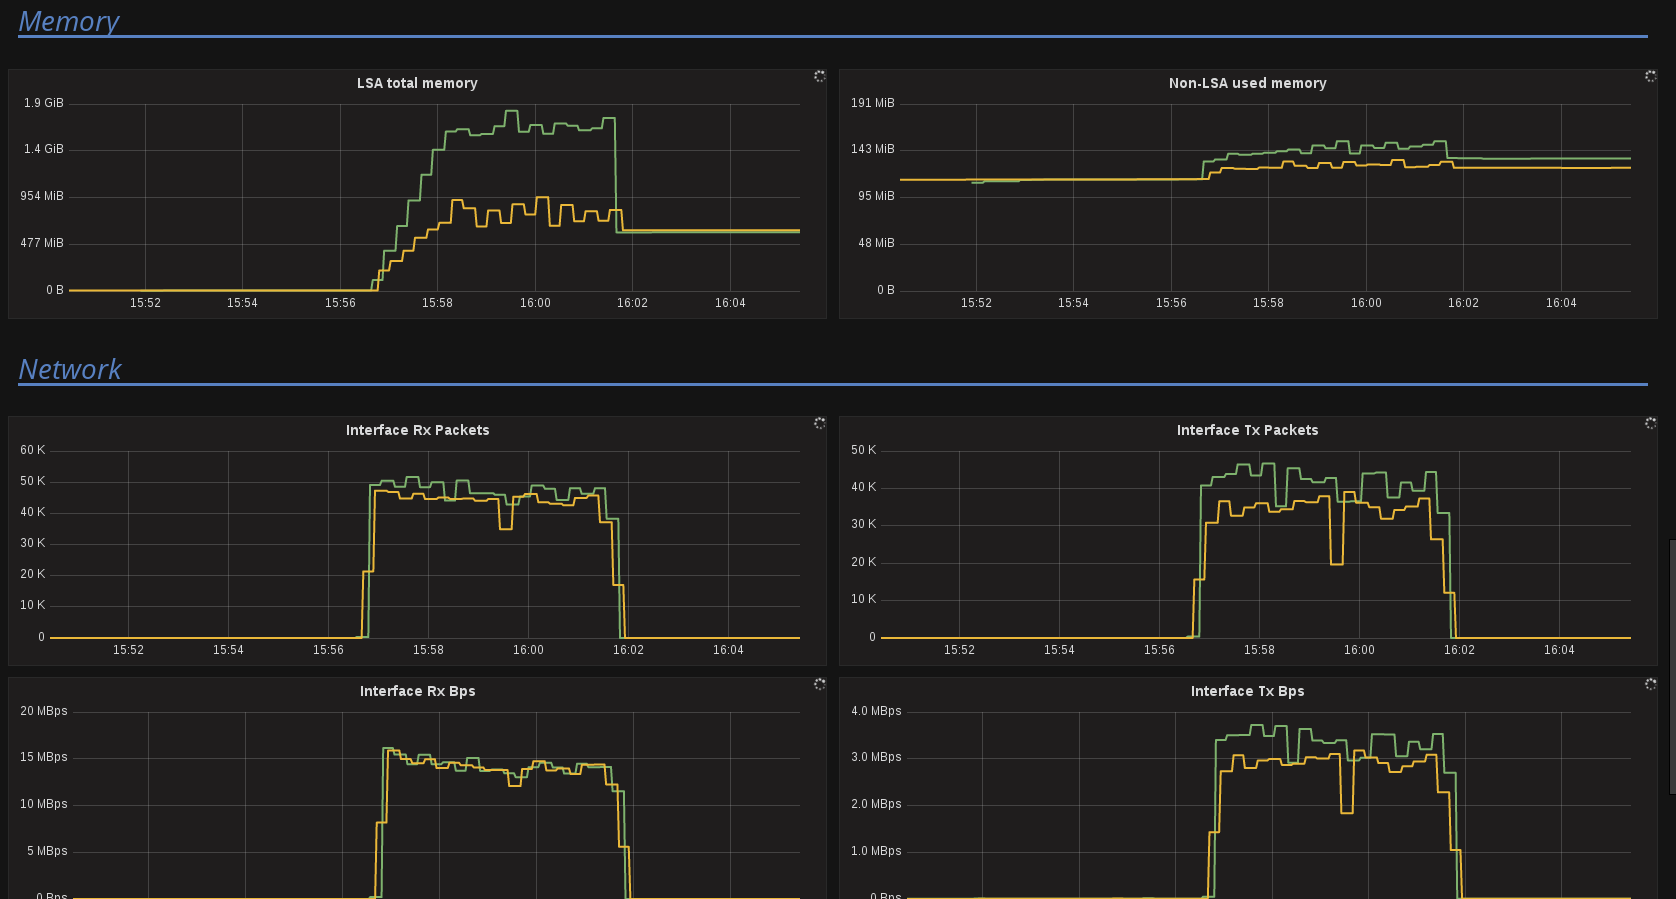 Memory And Network
What’s Ahead for the ScyllaDB Prometheus API?
Look for two enhancements in the coming releases:
- Histogram support. Internally ScyllaDB holds multiple histograms that check for latencies and rates. We will use Prometheus histogram support to export those metrics.
- Metrics description. To help figure out what’s what in the metrics, we are adding more descriptions to the metrics.
And finally, it’s the egg, sorry; that’s how evolution works.