
What is Workload Conditioning?
What is the best request rate I should throw at my cluster? What disk bandwidth should I make available for compactions? How many reader or writer threads should I have? What are the best size for my memtables?
Everybody who has deployed a NoSQL solution has asked themselves these questions. At ScyllaDB, we don’t want to help you answer those questions — we want to get rid of the questions altogether.
The secret for eliminating these common problems is what we call “Workload Conditioning.” Workload Conditioning is the use of the various metrics that the database has to create control feedback loops that guarantee the system progresses at a good, stable pace.
Workload conditioning is not a feature. It is a fundamental part of our philosophy for how we build ScyllaDB—an umbrella term for a wide set of features that work in isolation or in tandem towards the goal of automatically tuning the system characteristics. As we progress, more and more features that fall within this umbrella will be added to foster our mission of easing the pain of managing large clusters.
This article is the first of a series of posts in which we will describe some of those features. Throughout this series, we will talk about how to pick the best size for a memtable, how to make sure that a replica that has just joined the cluster with a cold cache won’t slow us down, and much more.
When talking about those features we will focus on promoting understanding of what they do, why they matter for your deployment, and how to track their behavior in our monitoring system.
With the 1.5 release right around the corner, we’ll kick off the series by exploring one of the Workload Conditioning features that made into that release: the write request rate adjustment feature, and the two sub-features that comprise it.
Adjusting the request rate for writes
ScyllaDB adopts a write model that is widespread in the NoSQL world, in which writes are acknowledged as soon as they are committed to the relevant memory buffers. That means that the system can at first operate at much higher rates than they can realistically sustain, and at some point in the future they will slow down. We don’t see the full cost of the write when the write occurs but only at some point in the future. Because of that, it can be said that we operate on a delayed costs model.
Another source of delayed costs is the log-structured nature of the SSTables. Writing a new record is a cheap append-only operation, but at some point in the future, those tables will have to be compacted.
So what’s the big deal with delayed costs? Isn’t that what governments do all the time when we go into debt? While governments can print new money and raise taxes in the future to pay their debt, we are stuck with the physical resources we have. If we continuously push requests at a rate that is higher than what we can handle, at some point the backlog will be larger than life itself.
ScyllaDB’s approach is to detect the growing backlog early and start throttling requests based on the rate of growth. Users will see latency increasing slightly, rather than abruptly. At this point, users can choose the desired concurrency and pace based on the latency they are comfortable with, rather than looking at various internal aspects and counters of the system, while ScyllaDB automatically tunes the system and provides the best results for the workload.
Figure 1 shows this principle in action. Very early on ScyllaDB 1.5 is able to determine the best write rate and will uphold it, instead of keeping writing in memory speed until the bill comes in the future.
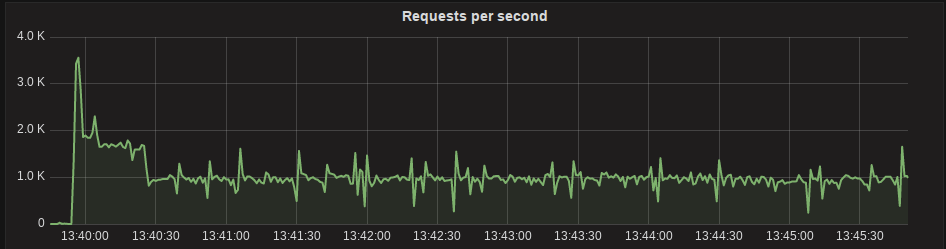
Figure 1: ScyllaDB 1.5 automatically determines the best write rate, and serves requests in a stable manner around that line.
How does it work under the hood ?
Let’s explore the fundamental principles that we use to achieve the write request rates. A write request in ScyllaDB has to be written into two memory buffers: one of them is the commitlog buffer that is periodically flushed down to the disk, and the other is the memtable. As more write requests come in, the memory used by the commitlog will start growing. For the memtables, it may or may not grow, depending on whether the requests are updating existing in-memory entries or creating new ones. This arrangement is shown in Figure 2
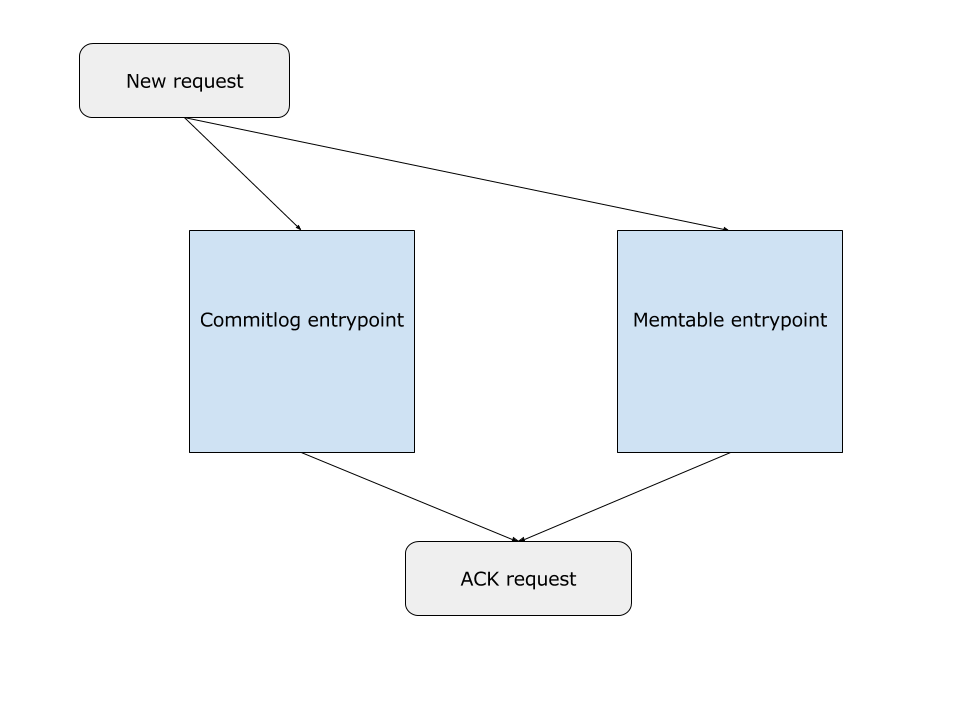
Figure 2: A new request comes in, and has to be written both in commitlog and memtables buffer areas. After that, it can be ACKed.
ScyllaDB automatically sets a limit to the amount of space those buffers use. Here’s where it gets interesting. In ScyllaDB, we bypass all the Operating System buffering system (known as the page cache) and write directly to the disk using Direct I/O, so we are in the perfect position to know exactly at which rate each buffer is being flushed to the actual storage. And in conjunction with our Disk Userspace I/O Scheduler we can adjust the priorities those requests receive if we believe one of them should move faster.
Once we know the exact rate at which the requests are being flushed to the actual disk—and not to the Operating System page cache—the rest is easy. All we have to do is match the inbound rate to the outbound rate. If the buffers are at their limits and we have just finished writing 4kB worth of data, we are now ready to accept 4kB worth of new requests. The main differences from the baseline model can be seen in Figure 3.
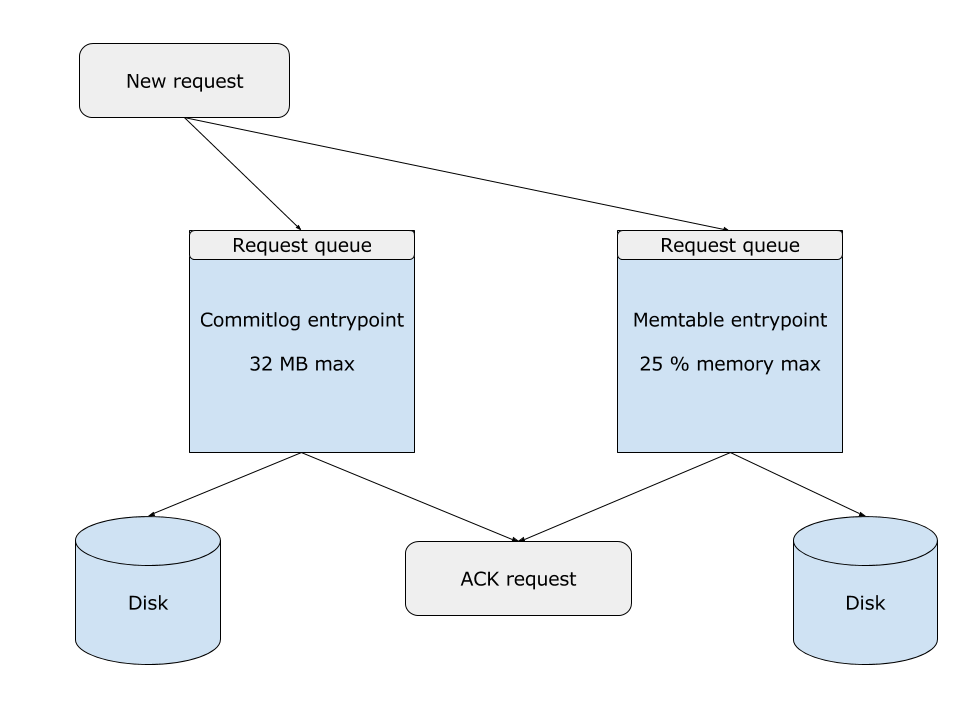
Figure 3: changes made to automatically match the request rate to the disk rate. The buffers are capped at a maximum, and requests wait in a queue. For every byte the disk writes, we allow one byte
Write request rate adjustment in practice.
Starting with the 1.4 release, ScyllaDB ships with native prometheus support. The 1.5 release adds some new counters that can be used to gain insight into what is going on with those mechanisms:
- seastar_commitlog{type=”total_operations”, metric=”requests_blocked_memory”}: total number of times we have blocked in the commitlog entry point. A common way of displaying this metric is taking its first derivative, yielding requests blocked per second.
- seastar_commitlog{type=”queue_length”,metric=”pending_allocations”}: current number of requests blocked at the commitlog entry point at this moment.
- _seastar_memory{type=”bytes”,metric=”dirty”}`: total amount of non-flushed memory used by memtables.
- seastar_database{type=”queue_length”,metric=”requests_blocked_memory”}: current number of requests blocked at the memtable entry point at this moment.
- seastar_database{type=”total_operations”,metric=”requests_blocked_memory”}: total number of times we have blocked in the memtables entry point. A common way of displaying this metric is taking its first derivative, yielding requests blocked per second.
In Figure 4, we can see those counters in action and the way they correlate with the system throughput. The graphs in Figure 4 capture a run where we use 100 threads to write 128kB blob requests (single column) into an SSD that can do around 400 MB/s. We can see that the system starts at a higher rate, determined by its memory/CPU speed. But as the buffers fill the system is automatically brought to disk speed and a new write rate is automatically determined.
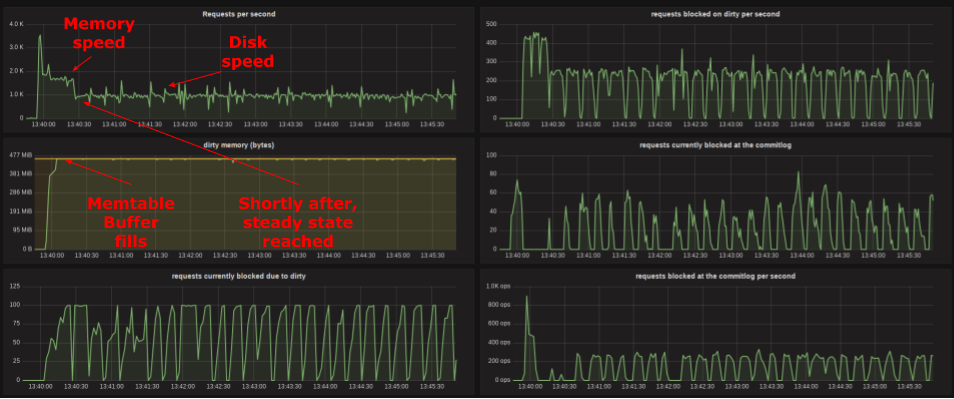
Figure 4: prometheus counters help in understanding the internal state of the system
What’s coming next?
Our work with Workload Conditioning never stops. The work described here will put the clients into the correct rate for their hardware by aligning the request acceptance rate with what the hardware can deliver. Things get a bit more complicated when one of the nodes in the cluster gets a bit slower than the others—not only do the external clients have to be throttled, but the other nodes should be throttled when sending requests to a slow replica as well. This work is already in progress and will feature in future versions of ScyllaDB.
Upcoming installments in this series will discuss other 1.5 features like automatic determination of memtable sizes–which allow us to eliminate a lot of parameters from the yaml file, and future work that allows the optimal selection of which replicas to serve reads from based on their cache hit ratio.
ScyllaDB 1.5 is just around the corner, and the features described here are new additions to the 1.5 release. You can already start relieving yourself from the duty of tuning your NoSQL today: you worry about your SLAs, we worry about how to get them! You can get started with ScyllaDB here