



We moved I/O off application cores to dedicated cores to give compute-heavy workloads more breathing room
Modern high-throughput systems often run on machines with many cores. At that scale, one practical problem becomes increasingly visible: CPU time spent on low-level I/O handling competes directly with CPU time needed for application-level work.
In this post, we explore how shifting more I/O related work away from cores focused on computations onto a dedicated subset of cores can improve the overall balance of the system. Specifically, we share how we approached Seastar‘s new asymmetric_io_uring backend: the design decisions behind it, what it aims to free up on application cores, and how it compares to linux-aio (Seastar’s existing backend).
Seastar’s Shared-Nothing Architecture
Seastar – the open source C++ framework that underpins high-performance distributed systems like ScyllaDB, Redpanda, and Ceph Crimson – is built from the ground up around a shared-nothing architecture.
To maximize multi-core performance, it usually spawns a single thread (referred to as a shard) per application core. Each shard runs its own cooperative scheduler (the reactor) managing lightweight tasks and fibers, and owns its memory and data structures. This eliminates the need for expensive cross-shard locking and atomic operations. Explicit message passing relies on inter-shard communication instead.
How the Symmetric reactor_backend_uring Works
In the existing symmetric io_uring backend, every shard initializes its own private io_uring instance. The reactor loop is structured to perform computations first and then invoke pollers to check for I/O events.
To optimize performance, this symmetric model implements a heuristic-based fast track for networking I/O. When a shard initiates a read or write on a network socket, the backend checks speculation flags. If the socket is speculated to be ready (i.e., we expect the operation to be non-blocking), the shard executes a synchronous system call directly on its own core (bypassing the io_uring submission path). If the speculation fails or the socket blocks, it falls back to the slow track (submitting the operation to io_uring).
This design forces application cores to divide their time between running high-level application logic and executing low-level synchronous I/O system calls, resulting in:
- Context switching overhead between user space and kernel space.
- Cache pollution on application cores due to kernel-level I/O processing.
- Higher latency variance and potential scheduler preemption.
What Are Networking Cores?
On systems optimized with Seastar’s tuning script (perftune.py), CPUs can be partitioned into application cores (where Seastar shards run) and networking cores (also known as IRQ cores). This is because modern servers often have more CPUs than hardware queues on network interface cards. The goal of this partitioning is to only allow a subset of cores to handle these queues – to eliminate a situation when multiple cores compete for a single queue.
Using the script, network interface card (NIC) hardware interrupts (IRQs) are routed exclusively to the networking cores. This ensures that application cores are not disturbed by high-priority hardware interrupts and SoftIRQ processing of incoming packets. This however causes the networking stack to run on multiple cores: the application cores (processing syscalls and outgoing packets) and the networking cores (processing interrupts and incoming packets). No application shards are spawned on these networking cores.
The Challenge: Offloading More I/O to Networking Cores
Since the system already contains dedicated networking cores that handle “some part of I/O” (NIC IRQs) and do not run any user-level application shards, we wondered: What if we give them more of the I/O workload?
By utilizing io_uring features like Submission Queue (SQ) polling and kernel worker thread affinity, we can offload the entire asynchronous I/O execution pipeline to these underutilized networking cores. The compute-bound application shards would simply place requests on their submission queues without making synchronous system calls, while kernel workers and polling threads pinned to the networking cores process the requests. This asymmetry promises to offload application cores, improving computation throughput and cache locality.
Additionally, we explore the usage of other features in order to improve performance. For example, we utilize kernel worker sharing. Furthermore, we investigate the possibility of utilizing buffer rings along with each request split into a linked chain of smaller requests.
Note: If you are not yet familiar with io_uring, see the explanation in the Appendix.
Designing the Architecture
Now that we know why we want an asymmetric backend, let’s talk about how such a backend works. At first, we looked at the big picture — the architecture of our solution.
Dividing Cores into Groups
Because application cores typically outnumber the available networking cores, we decided to organize application cores into groups. Each group is assigned to a dedicated networking core that handles all I/O operations for the shards in that group. Each group operates independently. Kernel workers and polling threads pinned to a group’s networking core only process I/O from shards within that group.
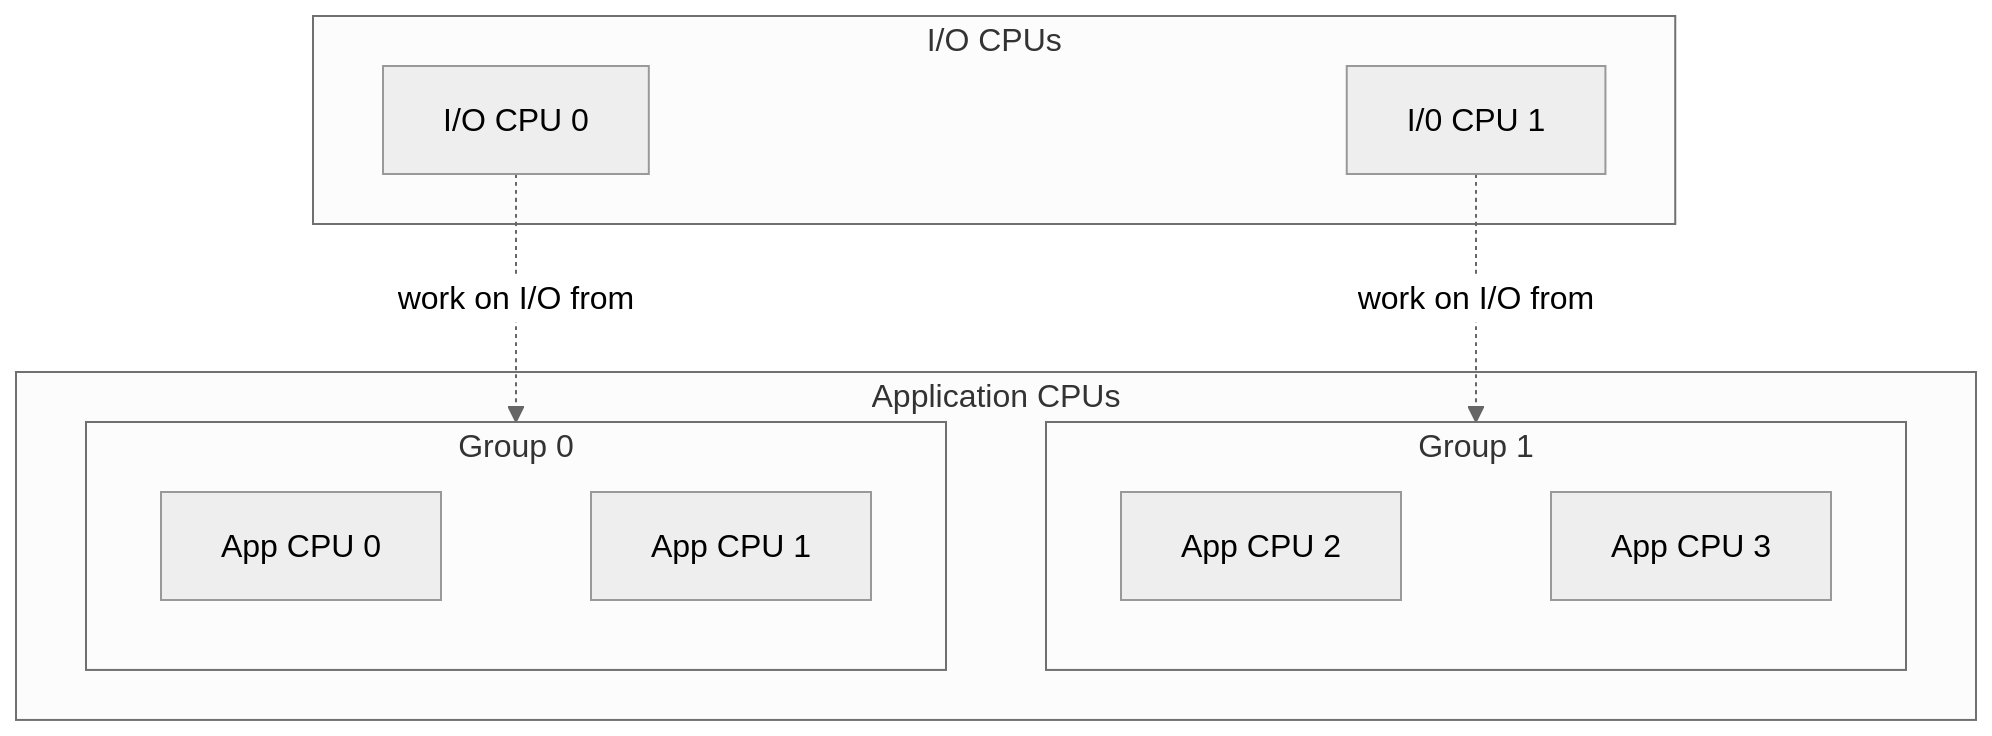
When designing this group-based architecture, we evaluated three potential approaches:
- Master/proxy shards via
smp::submit_to - Shared
io_uringinstance per group io_uringinstance per shard
Option 1: Master/Proxy Shards via smp::submit_to
This design designates one master shard per group with direct, exclusive access to a local io_uring instance. The remaining shards in the group act as proxy shards. When a proxy shard needs to execute a network I/O operation, it uses Seastar’s inter-shard message-passing functionality (smp::submit_to) to submit the request to the master shard. The master shard places the request onto its io_uring submission queue, reaps the completion events from the kernel, and resolves the appropriate future.
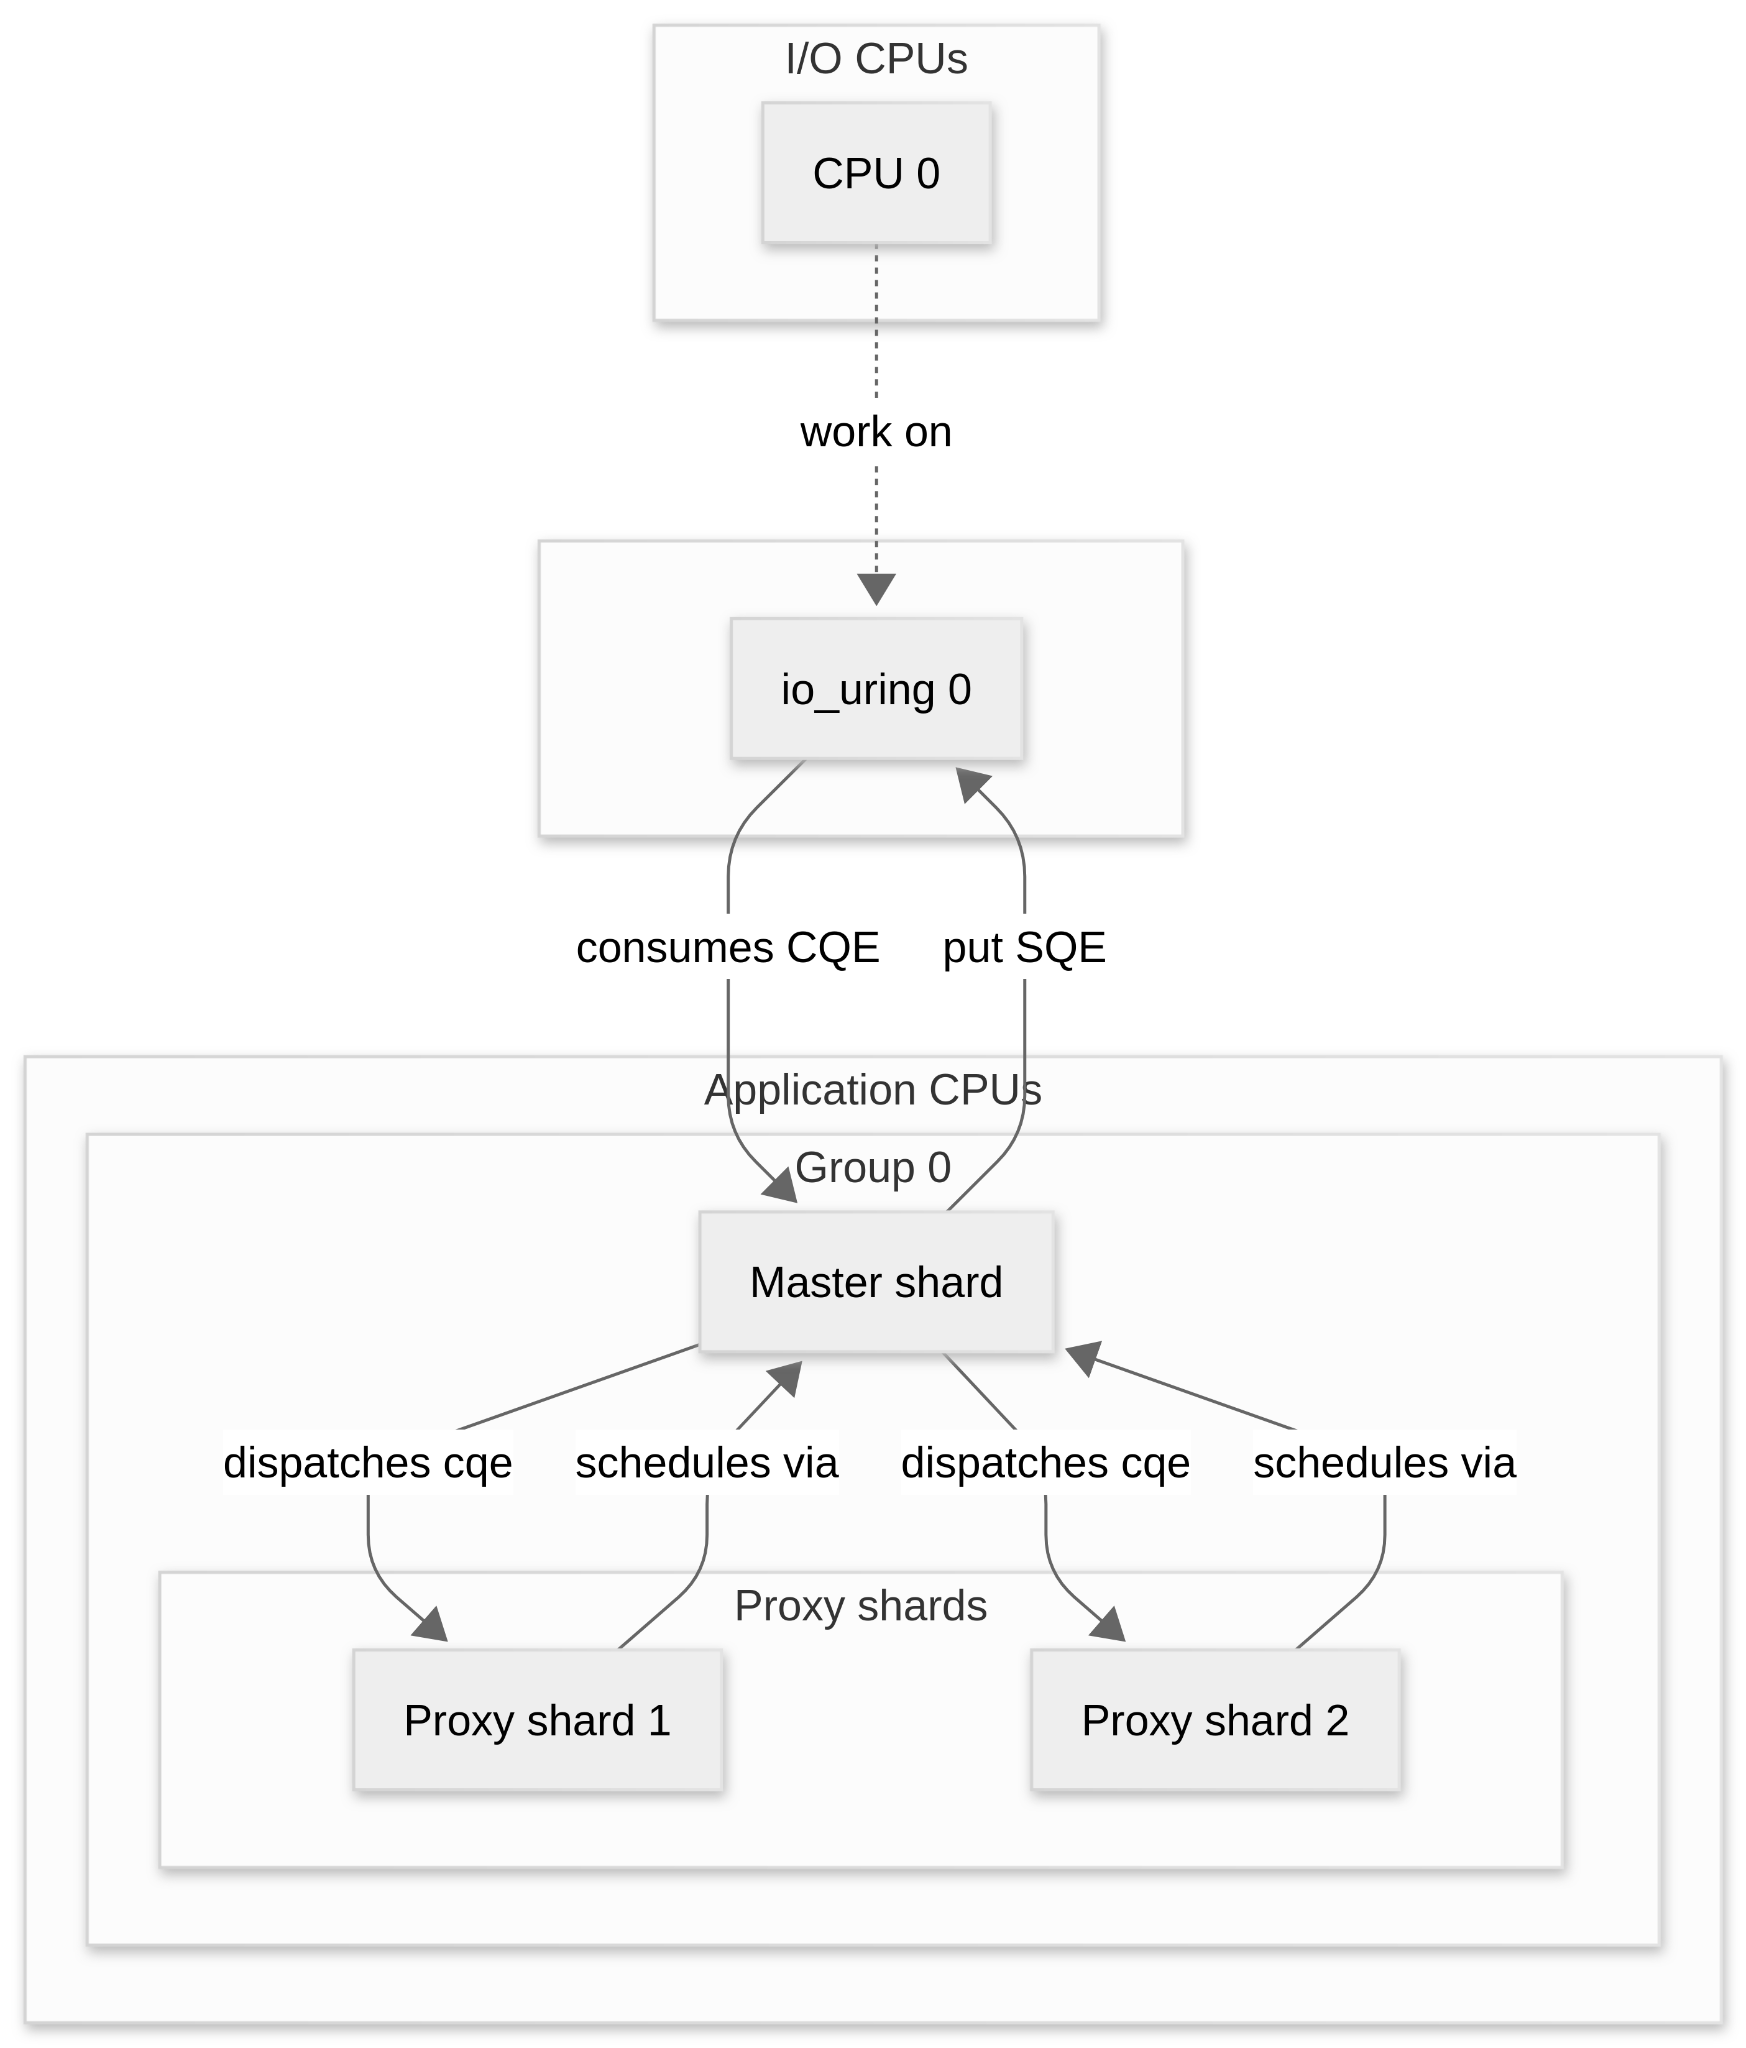
- Benefits: Straightforward implementation. Only one shard ever directly interacts with the
io_uringinstance. - Drawbacks: The performance cost of
smp::submit_tois unacceptable, as it relies on polling and can take up to several milliseconds to complete.
Option 2: Shared io_uring Instance per Group
The second alternative we evaluated was to share a single io_uring instance among all shards in a CPU group. Shards would concurrently submit requests to the same queue and reap completion events from the same completion queue.

- Benefits: Eliminates the inter-shard message-passing overhead of the master/proxy model. Potentially minimizes the number of syscalls, as SQEs from multiple shards can be submitted by a single syscall.
- Drawbacks: Because
liburingis not thread-safe, access to the shared instance requires synchronization. Introducing mutexes or other lock mechanisms would lead to high contention. That would end up violating Seastar’s shared-nothing philosophy and hurting performance. A lock-free mechanism was deemed technically unfeasible.
Option 3: io_uring Instance per Shard
To combine the performance of direct queue access with Seastar’s lock-free design, we chose a model where each shard maintains its own private io_uring instance. Each shard has exclusive access to its ring, avoiding any user-space synchronization or inter-shard message passing.
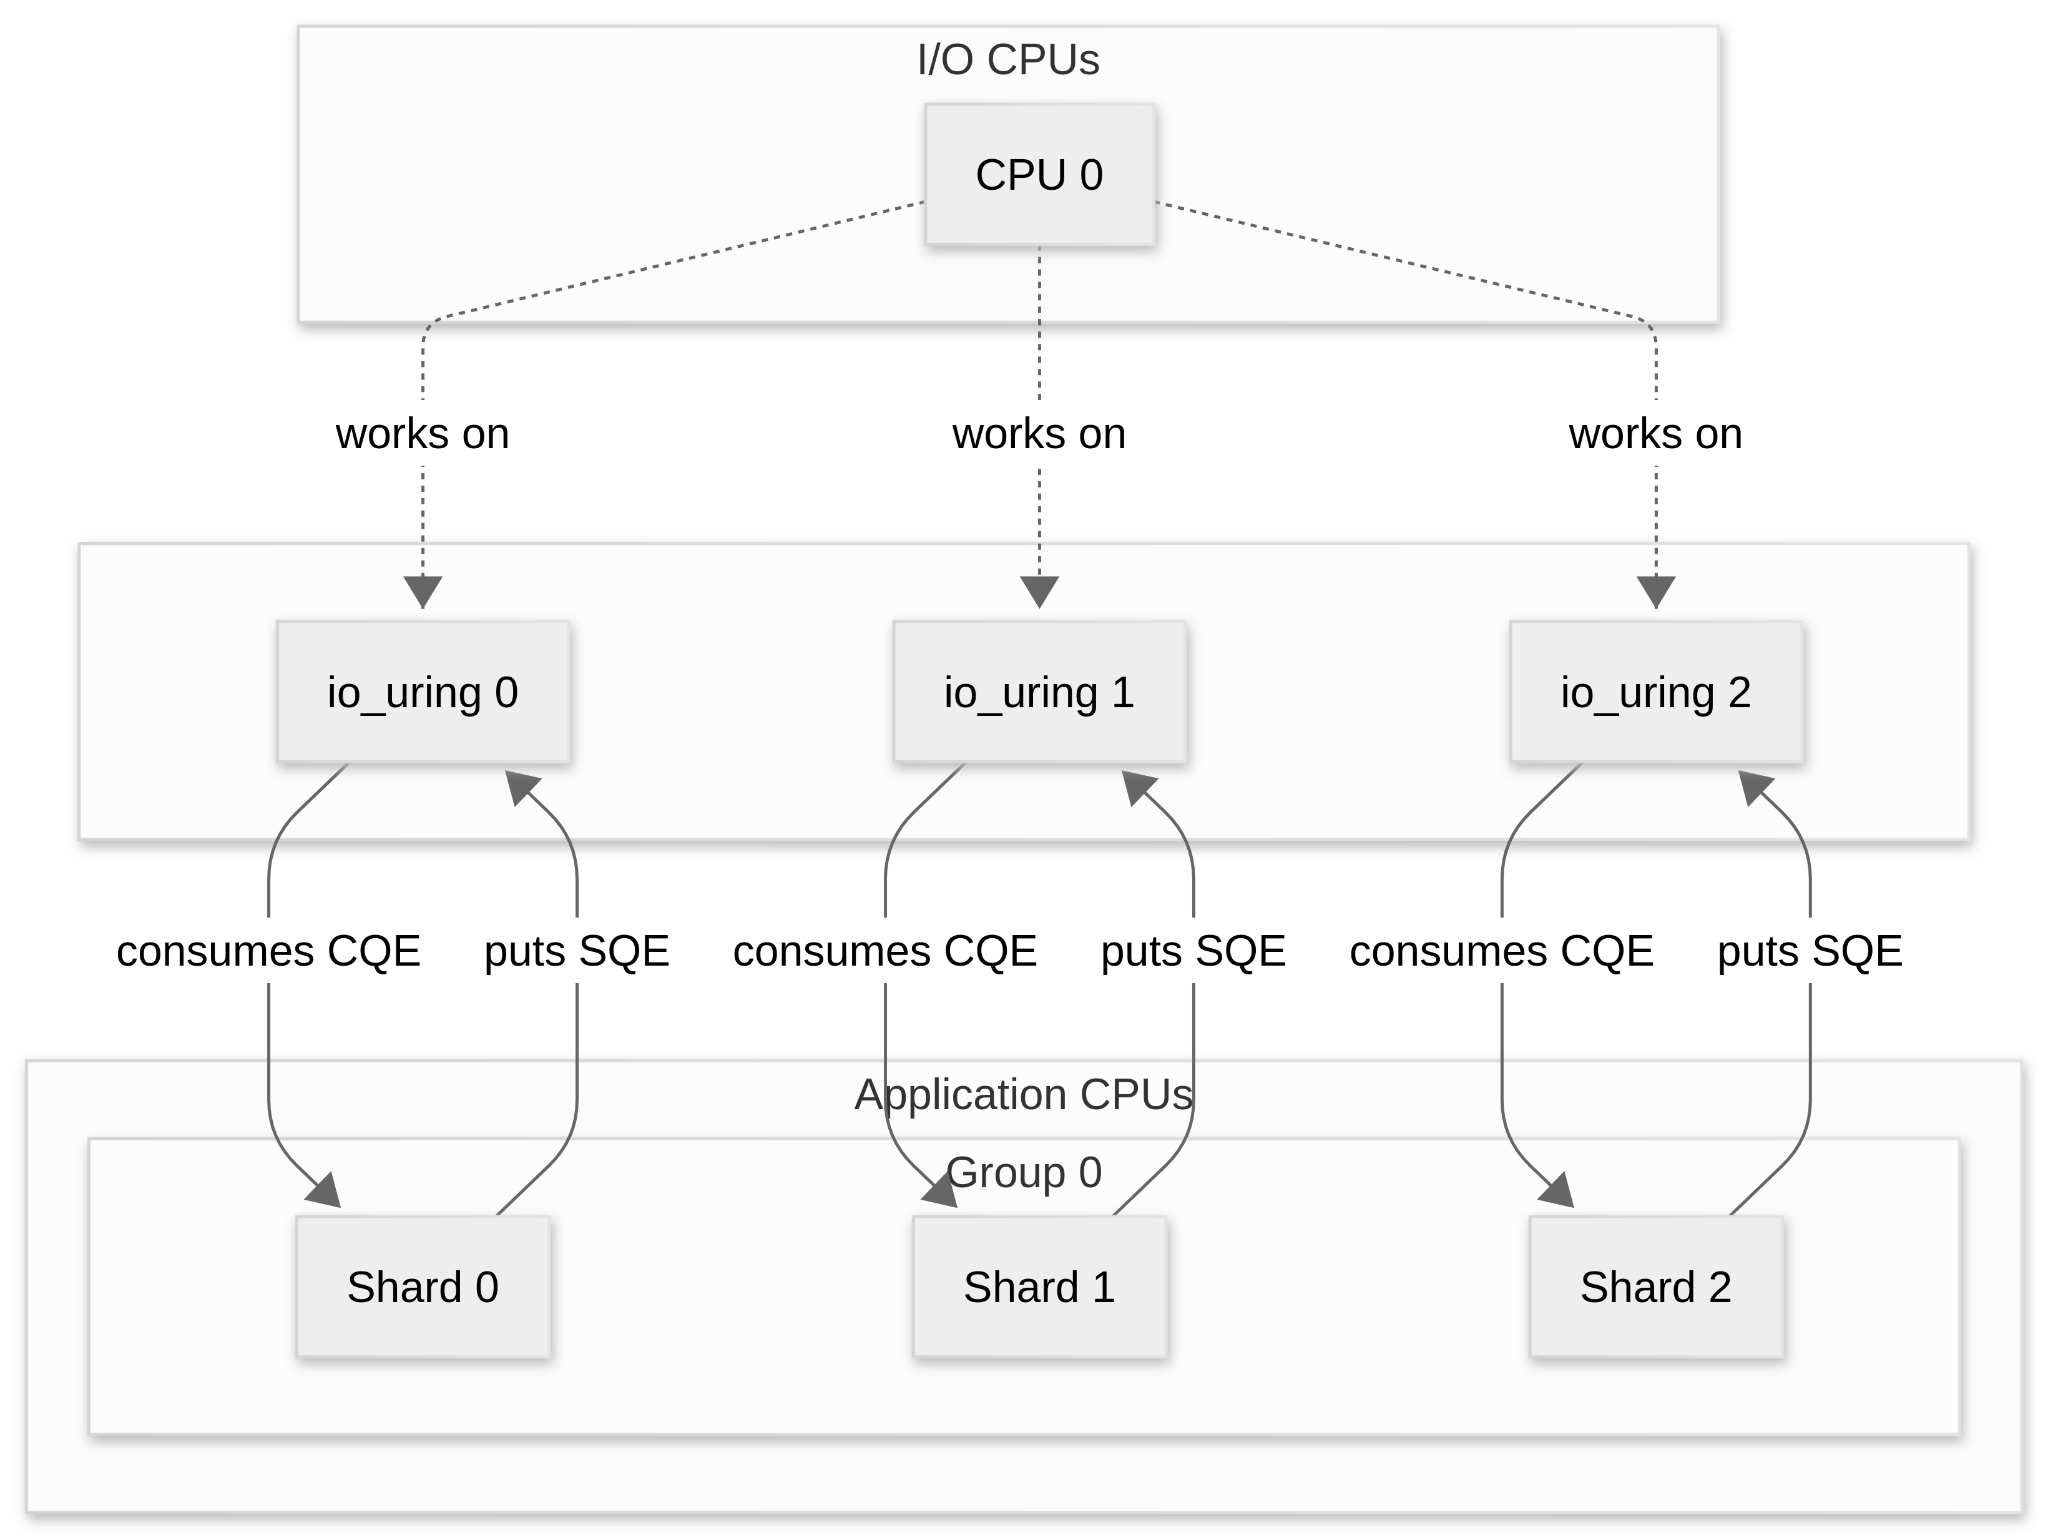
To prevent spawning a redundant pool of kernel worker threads for each shard – which would overload the networking cores and lead to CPU contention – we share worker pools:
- Shared Worker Pools: We initialize a master
io_uringinstance for each networking core and register its kernel worker thread affinity usingio_uring_register_iowq_aff. The remaining shards in the group initialize proxyio_uringinstances using theIORING_SETUP_ATTACH_WQflag, passing the file descriptor of the master instance. This makes the kernel attach the proxy rings to the master ring’s thread pool, sharing the same worker threads. - Shared Polling: By using the
IORING_SETUP_ATTACH_WQflag, we also share the kernel submission queue polling thread (SQPOLL) of the master ring with all attached proxy rings. A single kernel thread pinned to the networking core polls submissions for the entire group.
This approach successfully achieves asymmetric offloading while preserving Seastar’s shared-nothing design. It moves all sharing logic to the kernel level, where it can be handled efficiently.
Why the Fast-Track Had to Go
In Seastar’s existing symmetric io_uring backend, a fast track speculation path is used to optimize networking I/O. If a socket is expected to be ready (non-blocking), the shard bypasses io_uring entirely and executes a synchronous system call directly on its own core.
While this is effective in a symmetric model, it is counterproductive for our asymmetric architecture. If application shards continue executing synchronous I/O system calls directly, it defeats the purpose of offloading I/O to networking cores.
To guarantee that all low-level I/O is executed by the networking cores, we removed the fast-track speculation from our asymmetric backend. This ensures that all networking I/O operations are done exclusively through the io_uring submission queue.
Implementation
NUMA and SMT
Modern multi-core servers often utilize Non-Uniform Memory Access (NUMA) and Simultaneous Multithreading (SMT) architectures. In NUMA systems, memory is partitioned into nodes; accessing memory local to a node is significantly faster than traversing an interconnect to a remote node. In SMT systems (such as Intel’s Hyper-Threading), logical sibling cores share physical resources and low-level caches.
Because shards and their offloaded io_uring kernel threads must frequently exchange data through shared ring buffers, the physical topology of where threads are pinned may have an impact on cache coherence and memory latency. Our asymmetric backend addresses this by employing a topology-aware worker allocation algorithm.
The NUMA-Aware Allocation Algorithm
Topology Detection: The backend uses the Portable Hardware Locality (hwloc) library to discover the layout of NUMA nodes, physical cores, and SMT siblings. If hwloc is not available, the backend automatically falls back to a topology-agnostic greedy round-robin assignment.
Three-Pass Greedy Assignment: The backend maps the available worker cores (provided via --async-workers-cpuset) to the application shards using a three-pass greedy process:
- Pass 1 (SMT Siblings): First, it assigns worker cores to shards running on application cores that are direct SMT siblings of those worker cores. This maximizes cache sharing at the physical core level.
- Pass 2 (NUMA Locality): Next, it assigns worker cores to shards residing within the same NUMA node. To distribute load evenly, it greedily assigns each unassigned shard to the least loaded worker core (the one with the fewest shards assigned) in that NUMA node.
- Pass 3 (Cross-NUMA Node): Finally, for any shards that do not have any worker cores in their own NUMA node, it greedily assigns them to the least loaded worker core in other nodes.
Buffer Rings
Buffer rings are a newer alternative to the provided buffers mechanism of io_uring. They allow the user to pre-register a pool of buffers, which will be later used when completing operations. Utilizing buffer rings provided a possible avenue for improvement; consequently, we attempted to integrate them into our backend.
We considered the following approaches for adding buffer rings:
- fixed-size buffer ring
- splitting operations into smaller, linked chunks with
IOSQE_IO_LINK - splitting operations to cover multiple buffers with
IORING_RECVSEND_BUNDLE - differently sized buffer pools
While none of them were selected for our implementation, buffer rings remain a possible future improvement for the asymmetric backend.
Fixed-Size Buffer Ring
In this approach, operations prioritize using a pre-allocated buffer from a buffer ring, if possible.
The size of the buffer ring – as well as the size of the buffers in the buffer ring – are chosen with command line options.
We considered both variants with and without additional runtime allocations.
IOSQE_IO_LINK
In this approach, we allocate a single buffer ring with many 8kB buffers. Larger operations are split into a number of smaller 8kB buffers. The resulting operations are linked together with IOSQE_IO_LINK. All but the first SQE in the chain have MSG_DONTWAIT, which makes them fail if they cannot be instantly executed.
When using buffer rings, buffers from the pool are only assigned to an operation when necessary. As a result, smaller operations will only take as many 8kB buffers as needed.
At the same time, larger operations can still be handled. For example, a 128kB operation can be executed in a single reactor loop. It would be split into sixteen 8kB completions.
IORING_RECVSEND_BUNDLE
This approach is similar to the one utilizing IOSQE_IO_LINK. However, instead of linking multiple operations together, only one would be issued. The operations could utilize multiple buffers from the buffer rings. At the same time, this approach significantly reduces the overhead related to issuing multiple requests per operation and linking them.
Differently Sized Buffer Pools
This approach is similar to the first one. However, instead of maintaining one buffer ring with fixed size buffers, we maintain multiple, each one with buffers doubling in size. The buffer ring that an operation uses would be determined by how much the previous operation on the same descriptor filled the previously assigned buffer size. This reduces wasted buffer space by better adjusting to a given operation’s characteristics.
Summary of the Buffer Ring Options
All of the aforementioned approaches offer unique advantages and disadvantages. While each approach might be better than the others in some aspects, each also has some notable drawbacks. Below is a table with a summary of the most important differences.
| IOSQE_IO_LINK | IORING_RECVSEND_BUNDLE | Differently sized buffer pools | |
|---|---|---|---|
| Basic Idea | Submit 16 linked SQEs using IOSQE_IO_LINK and IOSQE_BUFFER_SELECT |
Submit a single SQE using IORING_RECVSEND_BUNDLE |
Have different buffer rings for sizes 8kB – 128kB and rotate between them |
| Submission Model | Multiple SQEs (linked chain per request) |
Single SQE per request |
Single SQE per request, picking the buffer from the appropriate pool |
| Kernel networking stack trips | Multiple kernel interactions (one per SQE) |
Potentially fewer kernel interactions, fewer roundtrips | One trip |
| Buffer Strategy | One large buffer ring with many 8kB buffers | One large buffer ring with many 8kB buffers | Multiple buffer pools (e.g., 8kB–128kB) |
| Returned Memory Layout | Multiple buffers | Multiple buffers | Contiguous buffer |
| Future Resolution | Resolved with the first buffer from the CQE, others cached |
Resolved with the first buffer from the CQE, others cached |
Directly returns appropriately sized buffer |
| Efficiency | Overhead from multiple SQEs vs lower memory waste |
Fewer kernel calls, better batching | Efficient if scaling tuned well. Risk of mismatch between workload and pool sizes |
| Control Over Read Size | Explicit (e.g., 16 × 8kB = 128kB) | Limited (no clear way to cap at 128kB) | Full control via buffer sizing logic |
| Complexity | High (linking, CQE management, caching) |
Medium (CQE management, caching) |
High (requires dynamic scaling logic and tuning) |
| Flexibility to workload | High (can scale number of SQEs dynamically) |
High (kernel handles batching) | Low (risk of running out of buffers for certain sizes) |
| Unanswered Questions | N/A | Limiting receive size | Pool sizing, dynamic vs static, buffer exhaustion handling |
| Overall Pros | Fine-grained control. Predictable max read size. Works well with buffer rings | Simpler model. Fewer networking stack calls. Potentially better kernel efficiency | Contiguous buffers. Full control over sizing |
| Overall Cons | Complex implementation. More kernel interactions. Cached buffers might never be read | Limited control over read size. Less predictable behavior. Cached buffers might never be read | Complex tuning. Fragmentation across pools. Risk of buffer exhaustion |
Implementation Issues
After careful consideration of how buffer rings would need to be integrated into Seastar, we decided that their use is outside the scope of this project. The way that Seastar handles buffer allocation is not compatible with a reactor-backend managed buffer pool for operations and would require larger architecture changes. For the project, it was more important to comprehensively test the performance and correctness of the solution than to possibly integrate buffer rings. However, buffer rings remain a possible future enhancement.
Benchmarking
When the backend was ready, we proceeded with benchmarks. We evaluated disk I/O and networking I/O separately, as their internal implementation differs.
Networking
Evaluations were run on the AWS EC2 c8gn.4xlarge instances, primarily for their
advanced networking capabilities. As specified by AWS, these 16-vCPU instances deliver up to 50 Gbps of network bandwidth.
We used rpc_tester for benchmarking purposes. The client side used thelinux-aio backend with 7/8 shards, where the server used either the linux-aio or asymmetric_io_uring backend with N shards and 1 networking core.
The client was stressing the server. 2000 fibers were run on each shard, each sending data in a loop in a request-response manner. In each fiber, it sent a fixed-sized message, waited for the response, and looped – all using RPC API.
The server was just handling the connections, while sometimes performing computations during request processing. This will be explained on the first use.
Spoiler: During our work with rpc_tester, we extended its capabilities by implementing an RPC streaming mechanism. Throughout this implementation process, we uncovered a subtle race condition within the framework. A detailed analysis of this bug is documented in Appendix B.

Server with 1 Shard
In this test, the server was running with a single shard. This was a really optimistic start for the benchmarks.
The results show that the asymmetric_io_uring backend outperforms the linux-aio one in terms of throughput by around 15%. Each bar is a result measured separately on a different client shard.
Throughput ([B/s]) for server with 1 shard
Additionally, the latencies look really promising. p50 latencies show a non-negligible improvement (lower is better). p0.5 latency ([usec]) for server with 1 shard
Server with 4 Shards
With the increasing number of shards, results become less favorable for the new backend.
Throughput ([B/s]) for server with 4 shards
Unfortunately, in this scenario the new asymmetric_io_uring backend seems unable to achieve as high throughput as linux-aio. Let’s find out why.
For our investigation, we used perf, which is a Linux tool for profiling. We re-ran the server side with the tool profiling, which gave us powerful insights. It turns out that the single networking core spends around 40-50% of its cycles on memory copying. This is the necessary buffer copying that the Linux kernel performs while handling I/O related operations.

Output from perf showing lots of memory copying on the network core
The networking core becoming the bottleneck was bad news. Previously, all the memory copying was distributed mostly among the application cores during syscalls for performing the operations. Now, the amount of data to be copied exhausts the sq_poll thread capabilities.
Let’s Add Artificial Processing
We learned that the backend is bound in the pure I/O workflows. However, applications like ScyllaDB – apart from doing I/O – perform computations or await different operations. To simulate this, the artificial processing was added to the request’s processing pipeline on the server side. When the server receives the message, it busy-loops for a set amount of time before responding.
Spoiler: If your workload does more than a few microseconds of compute per request alongside network I/O — and you’re running roughly multiple application cores per networking core — then strongly consider benchmarking this against your current setup.
We evaluated different compute times: 1, 2, … μs. At intervals of 1, 2, 4 μs, the asymmetric_io_uring backend consistently outperformed linux-aio. At a delay of 8 μs or higher, the performance delta converged within the standard error margin, reducing statistical variance between the two backends.
Under these simulated conditions, with the compute time 2 μs, the asymmetric_io_uring backend provides an advantage in terms of throughput and latencies.
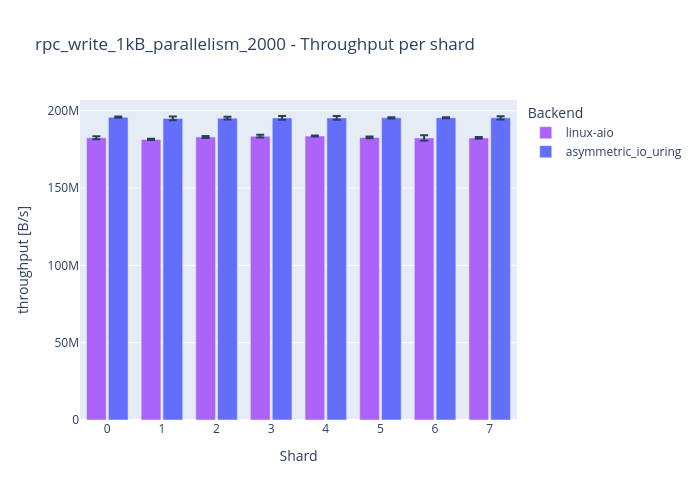 Throughput ([B/s]) for server with 4 shards and 2 usec of request processing time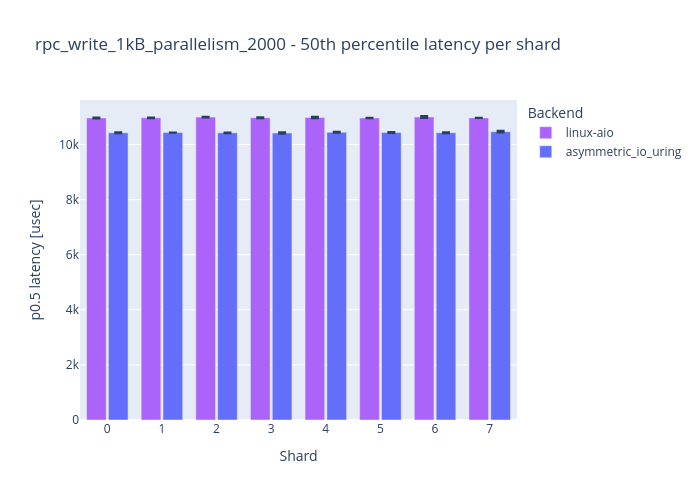
p0.5 latency ([usec]) for server with 4 shards and 2 usec of request processing time
Server with 7 Shards
Usually, the ratio between the application cores and networking cores is 7:1. That’s why the final and the best benchmark is with the server having 7 shards and 1 networking core.
When we add the artificial processing, the new backend shows promising results. The asymmetric_io_uring backend doesn’t perform as well as linux-aio, however it reclaims CPU time for shards. By moving I/O processing to the networking core, application cores become offloaded, which was the main goal for this project.
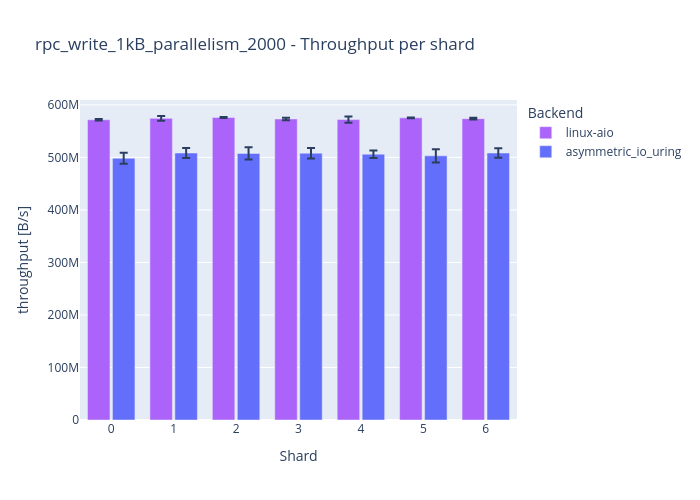
Throughput ([B/s]) for server with 7 shards and 2 usec of request processing time

p0.5 latency ([usec]) for server with 7 shards and 2 usec of request processing time
Disk I/O
It turns out that disk I/O is not as interesting as the networking in terms of the results. Both the linux-aio and asymmetric_io_uring backends perform really similarly.
Benchmarks were run on AWS EC2 i4i.4xlarge instances on the included dedicated NVMe storage drive, formatted with the XFS filesystem.
For the results to be reliable, we utilized a helper tool included in Seastar – iotune. It tests disk capabilities and provides a configuration file for tuning Seastar’s disk I/O scheduler.
Throughput
The first test only had a write load, which was not limited in any way.
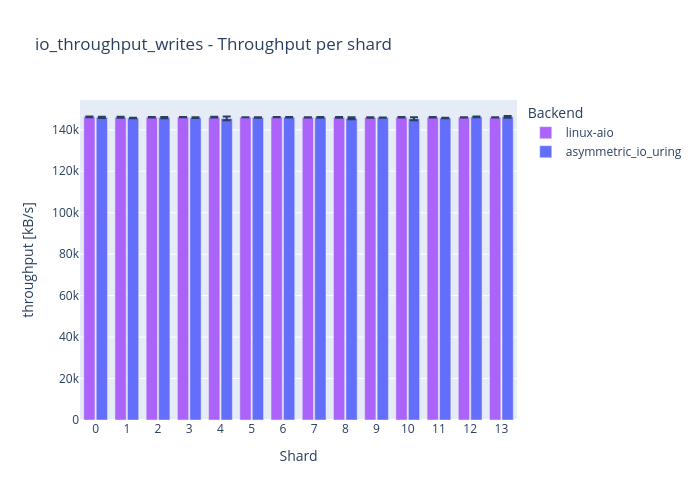
Write throughput ([kB/s]) for 7 shards in write only workload
Latencies Under High Load
The second test combined a high priority read task, which was limited to a certain amount of data per second, with a low-priority unlimited write task. By doing so, we intended to stress the application to measure the latency of priority operations in a busy application.
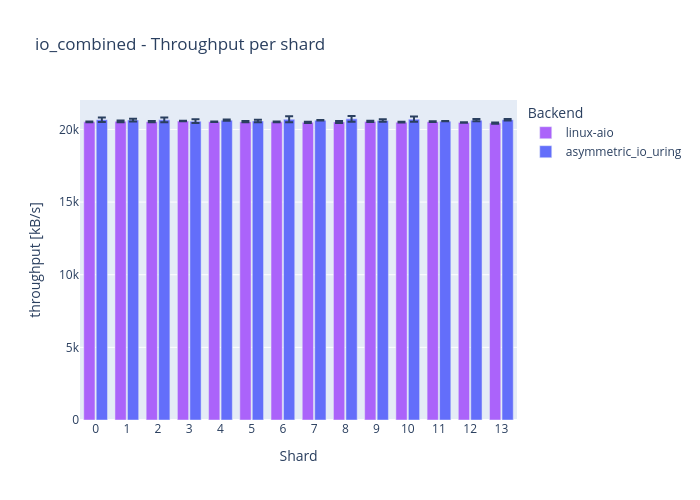
Write throughput ([kB/s]) for 7 shards in mixed workload
 Read p0.5 latency ([usec]) for 7 shards in mixed workload
In the benchmarks, the asymmetric_io_uring backend performs similarly to the linux-aio backend. We ran further throughput benchmarking with bandwidth limits to ensure that the disk speed is not the limitation and that the think_time parameter (which adds a delay between requests). Neither changed the conclusion — both backends perform similarly. The limitation here seems to be the disk, not Seastar itself.
To summarize the benchmark results:
- Disk I/O: Performance remains unchanged; the hardware itself is the primary bottleneck.
- Network I/O: The new backend might be a better fit for compute-heavy applications.
- Architecture Limits: For network-focused workloads, sharing one networking core across multiple shards quickly creates a bottleneck.
So Should I Use the New Backend with Seastar/ScyllaDB?
The asymmetric_io_uring backend isn’t an improvement in all cases, especially under high I/O load. However, if your application typically achieves capped networking throughput / focuses on disk I/O, it might benefit by using the new backend.
If you wish to use it, we recommend that you test it with your current setup and with the asymmetric_io_uring backend and judge what better suits your use case.
How to Use It?
Compilation
To use the asymmetric backend, you must compile Seastar with io_uring support enabled. Pass the --enable-io_uring flag during configuration:
./configure.py --enable-io_uring [other compilation options]Tuning
To get the full performance benefits of the asymmetric architecture, it is essential to align the io_uring worker cores with the system’s NIC interrupt handling. This is done using Seastar’s perftune.py script. Run the script with network tuning enabled. You can specify a custom ratio for auto-detecting the number of IRQ cores:
sudo ./scripts/perftune.py --tune net --nic ens5 --irq-core-auto-detection-ratio 8(In this example, an auto-detection ratio of 8 allocates 1 networking core for every 7 application cores).
Running
To run a Seastar application with the asymmetric backend, select the backend and define the CPU set reserved for the async kernel workers:
./your_seastar_app --reactor-backend=asymmetric_io_uring --async-workers-cpuset=14-15--reactor-backend=asymmetric_io_uring: Selects the asymmetric backend.--async-workers-cpuset: Specifies the cores dedicated toio_uringworkers and pollers. This option is mandatory when using this backend.
Tips
- Use Automatic Taskset Calculation: You can use
tasksetto select all the cores you want to dedicate to it (both application and networking cores) and specify which of them should beio_uringworkers with--async-workers-cpuset. For example:
taskset -c 0-15 ./your_seastar_app --reactor-backend=asymmetric_io_uring --async-workers-cpuset=14-15Under this configuration, Seastar resolves the worker cores as 14-15 and automatically spawns the compute shards on the remaining set (0-13), avoiding resource contention.
- Manual Core Selection: If you want to manually select the set of application cores (with
--cpuset), ensure it does not overlap with the--async-workers-cpuset.
Summary
Pros and Cons of the Asymmetric Backend
Like any architectural decision, the asymmetric backend comes with trade-offs:
- Pros:
- Core Isolation: Reclaims valuable CPU cycles on application shards by offloading the entire networking I/O to dedicated networking cores.
- Improved Latency Consistency: Minimizes scheduler preemption and context switches on application shards, resulting in more predictable latency under hybrid compute-and-I/O workloads.
- Cons:
- No Direct I/O-Bound Speedup: In purely I/O-bound benchmarks, the asymmetric backend does not outperform the traditional
linux-aiobackend. - Memory Copying Bottleneck: The networking cores spend a significant amount of execution time copying data between kernel and user space (via
copy_to_user). Without a zero-copy receive pipeline, the benefits of avoiding system calls are partially mitigated by memory transfer overhead.
- No Direct I/O-Bound Speedup: In purely I/O-bound benchmarks, the asymmetric backend does not outperform the traditional
Current Status
The core asymmetric backend has been successfully merged into the official Seastar repository.
We highly recommend testing the asymmetric backend on your own workloads – especially those with significant compute requirements combined with high-throughput networking – to see how much compute capacity can be recovered on your application shards.
Useful Links
For more details on the implementation, benchmarking tools, and the development process, check out the following resources:
- Asymmetric Backend Pull Request: Seastar PR #3297
- NUMA and SMT (HT) Awareness Pull Request: Seastar PR #3405
- Contributions to
rpc_tester: - Benchmarking & Visualizer Tools:
Appendix A – io_uring
What Is io_uring?
io_uring is a Linux-specific interface for scheduling asynchronous I/O operations. It shares memory between the userspace and the kernel to create two cyclic buffers – the Submission Queue (SQ) and the Completion Queue (CQ). The application initiates an operation by placing a Submission Queue Entry (SQE) into the SQ. Afterwards, the kernel executes entries pending in the SQ and places Completion Queue Entries (CQE) into the CQ. By default, io_uring does not have to execute operations in the order that they were scheduled.
io_uring is a low-level interface, but liburing provides a higher-level abstraction.
io_uring Features
Apart from its basic form of operations, io_uring has several more advanced features that open the door to optimizations.
For example:
- Kernel side polling
- Configuring kernel worker CPU affinity
- Attaching
io_uringinstances - Provided buffers
- Operation ordering
Let’s analyze each one in more detail.
Kernel Side Polling
By default, adding an SQE to the SQ doesn’t trigger kernel processing. The application must issue an io_uring_enter syscall to notify the kernel.
Despite being an improvement over regular I/O handling (where each I/O operation is a separate syscall), the performance implications are not negligible. Context switches are computationally expensive.
io_uring offers a different mode of operation: kernel side Submission Queue polling (SQPOLL). It can be enabled by setting the IORING_SETUP_SQPOLL flag during io_uring creation.
When configured in this way, the kernel creates a dedicated kernel thread which polls the io_uring for new entries. Instead of a system call, SQPOLL only requires modifying atomic variables to inform the kernel of new submissions.
When creating an io_uring instance with the IORING_SETUP_SQPOLL flag, the sq_thread_idle should also be specified. It dictates after what amount of time the poller thread goes to sleep and has to be woken up with a system call.
Additionally, by specifying the IORING_SETUP_SQ_AFF flag and the sq_thread_cpu field, the user can define on which CPU the kernel polling thread should operate.
Configuring Kernel Worker CPU Affinity
Some of the operations that can be scheduled with io_uring require instantiating a separate kernel thread to complete. Similarly to the kernel polling thread, the CPU affinity of these worker threads can be controlled. This can be achieved with io_uring_register_iowq_aff, which accepts a cpu set to which it should limit the kernel worker affinity.
Attaching io_uring Instances
If an application has several io_uring instances, it can combine them with IORING_SETUP_ATTACH_WQ during creation. This results in sharing kernel worker and poller threads (if kernel side SQ polling is used). By doing so, kernel threads from separate io_uring instances no longer compete for CPU time, thus potentially improving performance.
Provided Buffers
Instead of specifying a buffer for each I/O operation that requires it, it is possible to pre-register a pool of buffers beforehand. The kernel assigns a buffer to an operation when it is actually executed. By utilizing this feature, the number of simultaneously allocated buffers can be reduced, as it is only necessary to maintain as many as the number of in-flight operations.
Providing buffers can be achieved in two ways: using the older provided buffers interface io_uring_prep_provide_buffers or the newer buffer rings feature.
Operation Ordering
The operations added to the SQE can be ordered by utilizing the IOSQE_IO_LINK flag.
When set in an SQE, it ensures the next operation (next submitted SQE) will not be started until the current one finishes executing. It is possible to link multiple SQEs together and form a chain.
Appendix B – Our Contributions to the rpc_tester
rpc_tester is a Seastar app used for benchmarking the performance of Seastar’s networking using its RPC API. It functions in one of two modes:
- Server, which listens for and processes incoming requests.
- Client, which initiates connections to a specified address to execute RPC calls.
A configuration file is required to define the job’s parameters, which can be configured to either stream data or simulate a specific computational load.
At the start of the project, we decided to introduce a new job type based on RPC streaming, which supports continuous sending and receiving of data. This can be done by a sink and source, which can be thought of as two ends of the same stream. When the application wants to stream data, it puts it into the sink, and the other party can read it from the source. The main difference between this and the previous RPC jobs is that you don’t need to wait for the response on the RPC level (since the stream is continuous).
The newly introduced rpc_streaming job type works in a similar way to the existing rpc type. On each client shard, it creates a parallelism number of fibers – each of them sending some data in a loop. Each iteration just executes co_await sink(payload); (instead of a send-and-wait flow). This resolves when the data is sent, but does not wait for a response.
rpc_streaming distinguishes two verbs: unidirectional and bidirectional. The former is used when the client is the only one sending data, and the server just receives it. The latter is used when both parties send data to each other; apart from the client sending data to the server, the server echoes back each portion of the received data:
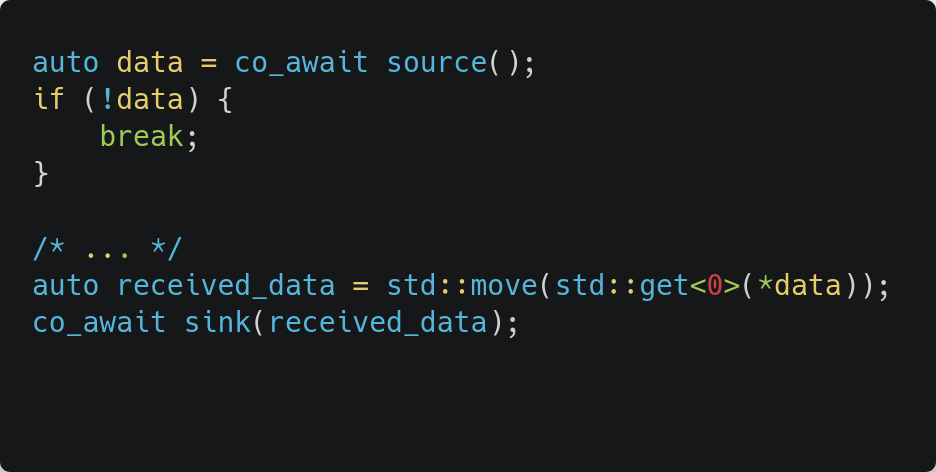
C++ code snippet: The result of a co_await on the source is assigned to a variable and subsequently moved into a sink
This way, we can measure both types of workloads: one with a lot of data being sent, and the other with a lot of data being sent and received.
Hunting the Race Condition
The rpc_tester runs all jobs for a specified amount of time, and then stops them and collects the results. However, it’s vital to ensure the proper closing of all opened RPC connections and streams.
While developing the rpc_streaming job, we noticed that sometimes the client side crashed due to an rpc::closed_error being raised. It was weird at first because all the connections seemed to be closed properly.
After some investigation, we discovered that the problem was in the way we were closing the streams. When using the streaming RPC API, a new TCP connection is established for each stream. However, they are grouped together in the same parent connection.
Previously, the resources were released in the following order:

C++ code snippet: Awaiting the closure of the sink followed by the termination of the RPC client into a sink
Here, sink is associated with the stream connection, and the _client is associated with the parent connection. We were closing the stream connection before the parent one. The problem comes down to the exact timing of when the sink.close() future resolves. It is resolved when the EOF is sent to the peer, but it does not guarantee that the peer has received it. If the parent connection is closed before the peer receives the EOF, it can cause the rpc::closed_error to be raised on the client side.
The race condition was more likely to happen when the streaming connection was overloaded with data. If the underlying TCP connection was congested, the EOF could be delayed, and the parent connection could be closed before the peer received it.
This race condition is clearly visible in the packet capture (see screenshot below), where port 50199 is the streaming connection and 52538 is the parent connection:

TCP Teardown Race Condition on ports 50199 and 52538: parent connection closes before streaming connection
- The client attempts to close the stream connection by sending a packet with the FIN, ACK flags.
- Immediately after, before the stream handshake completes, the client closes the parent connection by sending another FIN, ACK.
- The server responds with FIN, ACK for the parent connection, and the client replies with ACK. The parent connection is now closed.
- Because the streaming connection was congested, the initial stream FIN, ACK packet was lost. The client attempts to retransmit it, but the parent connection is already gone, resulting in the rpc::closed_error.
This is not the expected behavior, because the parent connection should be closed only after all the streams are properly closed.
The Fix
To mitigate this issue, we changed the order of closing the connections. For each stream, we enforce a strict 4-step closure sequence:
- Client sends EOF for a stream.
- Server receives EOF for a stream.
- The server sends EOF for their stream.
- Client receives EOF for the stream.
This way, after closing all streams for a given parent connection, we can be absolutely sure it’s safe to close the parent connection because all the EOFs have been definitively sent and received.
Exposing Additional Metrics
Beyond just adding streaming capabilities, we also wanted to improve overall benchmarking visibility. When benchmarking and using the rpc job type with the write verb, we wanted to measure the throughput in terms of bytes per second, but only the number of messages was available.
To address this limitation, we decided to expose additional metrics for the write verb: total duration, messages per second, total bytes, message size, and throughput. These additions are included alongside the original data, all of which are formatted as YAML and printed to stdout upon completion of the run.