
First the bad news: you missed a great opportunity to pick the brains of three rather distinguished performance experts. But the good news is that you can now watch the masterclass sessions – and also take the certification exam – online for free!
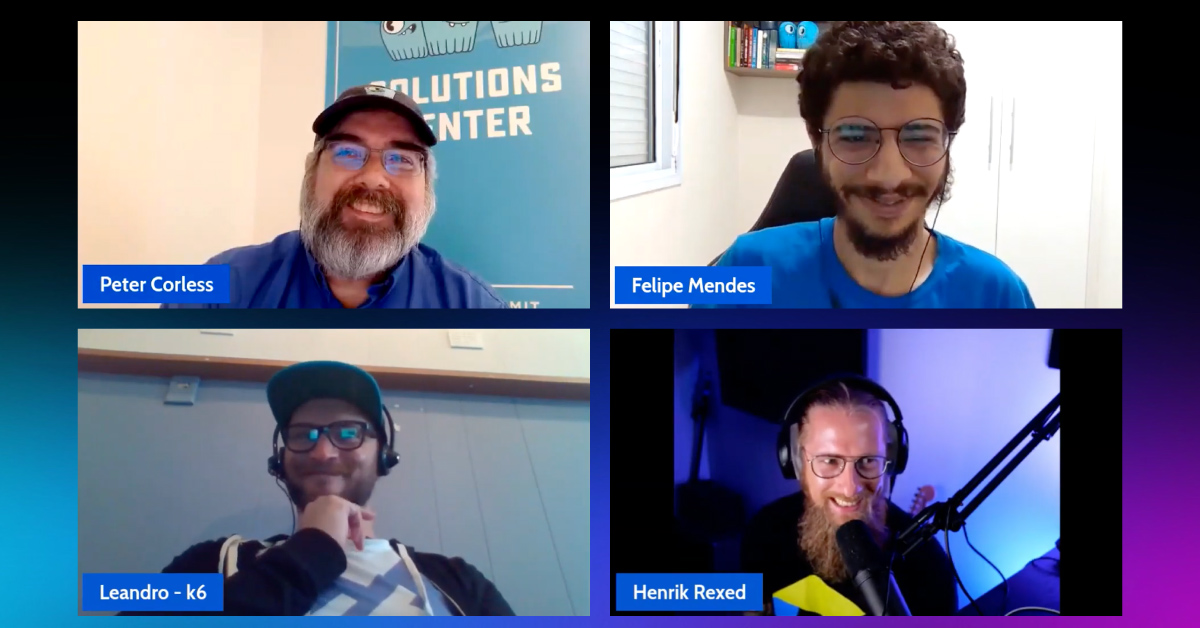
To deliver a free community-focused masterclass, Henrik Rexed (Dynatrace), Leandro Melendez (Grafana/k6), and Felipe Cardeneti Mendes (ScyllaDB) came together online from Marseilles, Mexico City, and Sao Paulo – sharing their expertise with hundreds of engineers joining virtually from around the globe. The focus was on how to optimize distributed system performance, from the front-end to the back-end, with SLO-driven strategies.
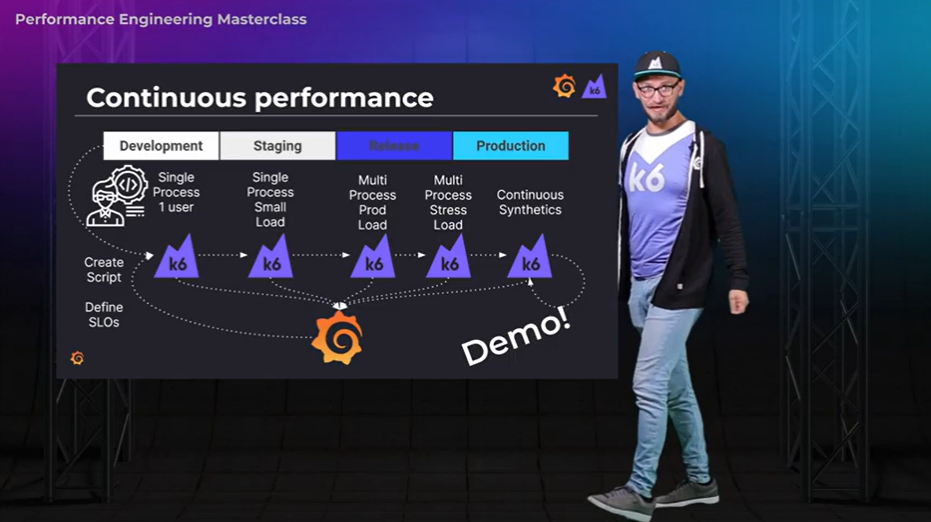
- Leandro started off by providing a grounding in current expectations of what performance engineering and load testing entail. His session defined the modern challenges developers face, including continuous performance principles, Service Level Objectives (SLOs), and Service Level Indicators (SLIs). It delineated best practices and provides hands-on examples using Grafana k6, an open source modern load testing tool.
- Henrik walked through how to measure, validate and visualize these SLOs using Prometheus, an open observability platform, to provide concrete examples. Next, he demonstrated how to automate your deployment using Keptn, a cloud-native event-based life-cycle orchestration framework. Attendees learned how it could be used for multi-stage delivery, remediation scenarios, and automating production tasks.
- Felipe then dived into distributed database observability, showing several real-world situations that may affect workload performance and how to diagnose them. Simply having access to key metrics is not enough, he explained. You need a deeper understanding of them to know what to watch for. That’s why he showed how to triage problems by priority and quickly gather live insights to troubleshoot application performance.
- All three then came together for a lively chat led by cordial host Peter Corless – tying together key threads from the sessions, tackling top performance engineering questions, and sharing thoughts on the latest performance engineering news and trends.
ACCESS THE MASTERCLASS ON-DEMAND
If you’re curious about what to expect, take a look at this panel video, as well as a couple of excerpts we’ve transcribed below for easy scanning.
Key takeaways from the other instructors’ sessions
Henrik: I would say the first – from Leandro – is that I need a wider green screen to be able to record that type of presentation! [Chuckles] We are always in connection, Leandro and myself, so I knew quite a lot about his topics. Felipe’s was really interesting. I was doing analysis of databases when I was working as a performance engineer, and it was interesting to see the KPIs you walked through. It will be interesting to look at them a bit more so then I can utilize them for Keptn. [Keptn in an open source enterprise-grade control plane for cloud-native continuous delivery and automated operations.]
Felipe: That’s exactly what I wanted to say. I wasn’t aware of Keptn, so it was very insightful for me. Now I’m really excited to see how I can integrate ScyllaDB Monitoring Stack with Keptn to make things even better. Of course, Leandro, you have to teach me how you record videos because that was awesome man!
Leandro: I have to say, Felipe, some of the things that you showed I wish were available at large scale when I was trying to catch performance bottlenecks – bottlenecks that very often came from the database side. And for you, Henrik, I can’t wait to implement and try some of the new Keptn functionalities and to mix it with what we’re doing at k6; it sounds like they would go together really, really well.
Where to start when performance KPIs are trending in the wrong direction
Henrik: I would say first of all, when you are taking the mission of validating a given component, you need to ask the question, “Okay, so if I do that request, what would happen in the backend?” Because if you don’t know it, then you will basically go everywhere in the architecture and chase things that don’t make sense. By knowing your environment, you know what layer of your application will be involved when it is utilized. Then you start with, say, your latency metric. You know that after that you will have some queues or some connections. You can get those connections, and see if the memory starts to go up. If so, maybe there’s a queueing problem. There is no “state of the art” in terms of which metrics you should look at. It really depends on your own stack. To be able to pick the right metrics, you have to understand precisely what’s going on.
Leandro: I will expand a little bit on what Henrik mentioned. Yes, on one hand, it’s very important to know what you have to observe and to track and to diagnose. Speaking of diagnosing – let’s say you see your blood pressure deviating. There is no best or first thing that you always look at. Are you under stress? Are you eating and drinking well? Do you have kidney issues? How you are going to be investigating it is highly contextual. Adding on top of what Henrik is saying, do you have an MRI machine or other scanner at hand, like a good observability or monitoring platform? Maybe your environment reveals some good reason for that deviation to be happening. There are no silver bullets with performance testing, observability, or monitoring as Henrik said. If you have the MRI scan, you may have deep insight into what is happening – and even there, it will depend a lot. If you don’t have it, and you have only automations, black-box or front-end measurements, it will be just like having a blood pressure monitor and trying to figure it out from there.
Felipe: I agree with both of my peers; what they have said, it’s certainly right. There is no really specific metric that is going to mean anything to everyone. For example, I typically like to look at latency first. For example, when I’m analyzing a problem, often I go back to ask, “What is your SLA requirement?” Many times I see a latency of 10 ms, 15 ms, but if I don’t know what the SLOs or SLAs are, it’s hard for me to make sense of what I’m seeing. So a general understanding of what we are expecting is certainly what is necessary. In addition to that, one thing that I would like to add is how important it is for us to have historical metrics. You can then analyze the whole history of how your application has been performing and then you can quickly compare how it has been performing over time. There are some scenarios when, for example, you may have a bad access pattern at a specific time of the day.
Access the Performance Engineering Masterclass Now
Intrigued? You can attend the complete masterclass – and even take the certification exam – whenever you have a few hours to spare. When you complete it, you’ll know best practices on how to:
- Optimize your team’s pipelines and processes for continuous performance
- Define, validate, and visualize SLOs across your distributed systems
- Diagnose and fix subpar distributed database performance using observability methods