Investigating problems in a distributed system may be a tedious task, but it becomes much easier with the right tools for the job. One such tool is Wireshark, a well known utility that offers snooping on all kinds of network protocols – ranging from Ethernet to HTTP and beyond. From now on, it’s also possible to dissect ScyllaDB’s internal protocol, used to communicate between nodes. This includes reading and writing rows, exchanging schema information, gossiping and repairs.
Introduction
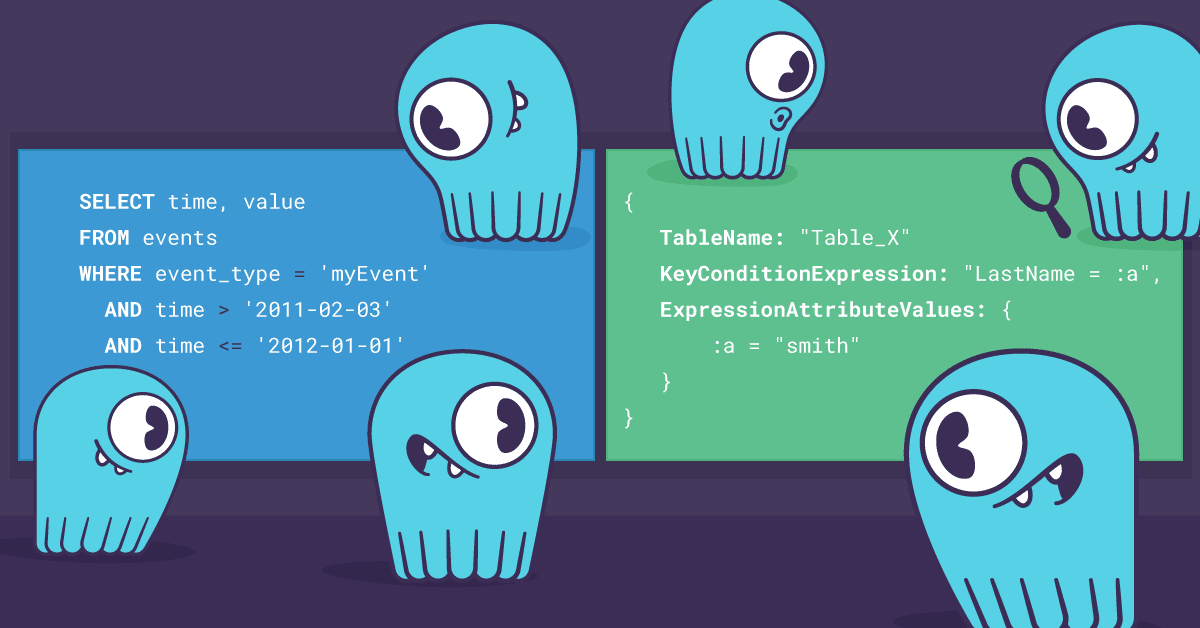
Using a packet dissector to investigate issues in distributed systems is a great asset. It’s extremely valuable to be able to see which nodes communicated with each other, which requests arrived from the clients at which time, and more. However, instead of examining raw bytes that happened to go through our network interfaces, it’s useful to get them parsed to a human-readable form first – assuming we know which protocols were used. With Wireshark, it’s possible to dissect the communication between ScyllaDB nodes and their clients – both via the legacy Thrift protocol and the current standard, CQL (for which we contributed as well!). In order to examine CQL packets, simply use a “cql” filter in Wireshark:
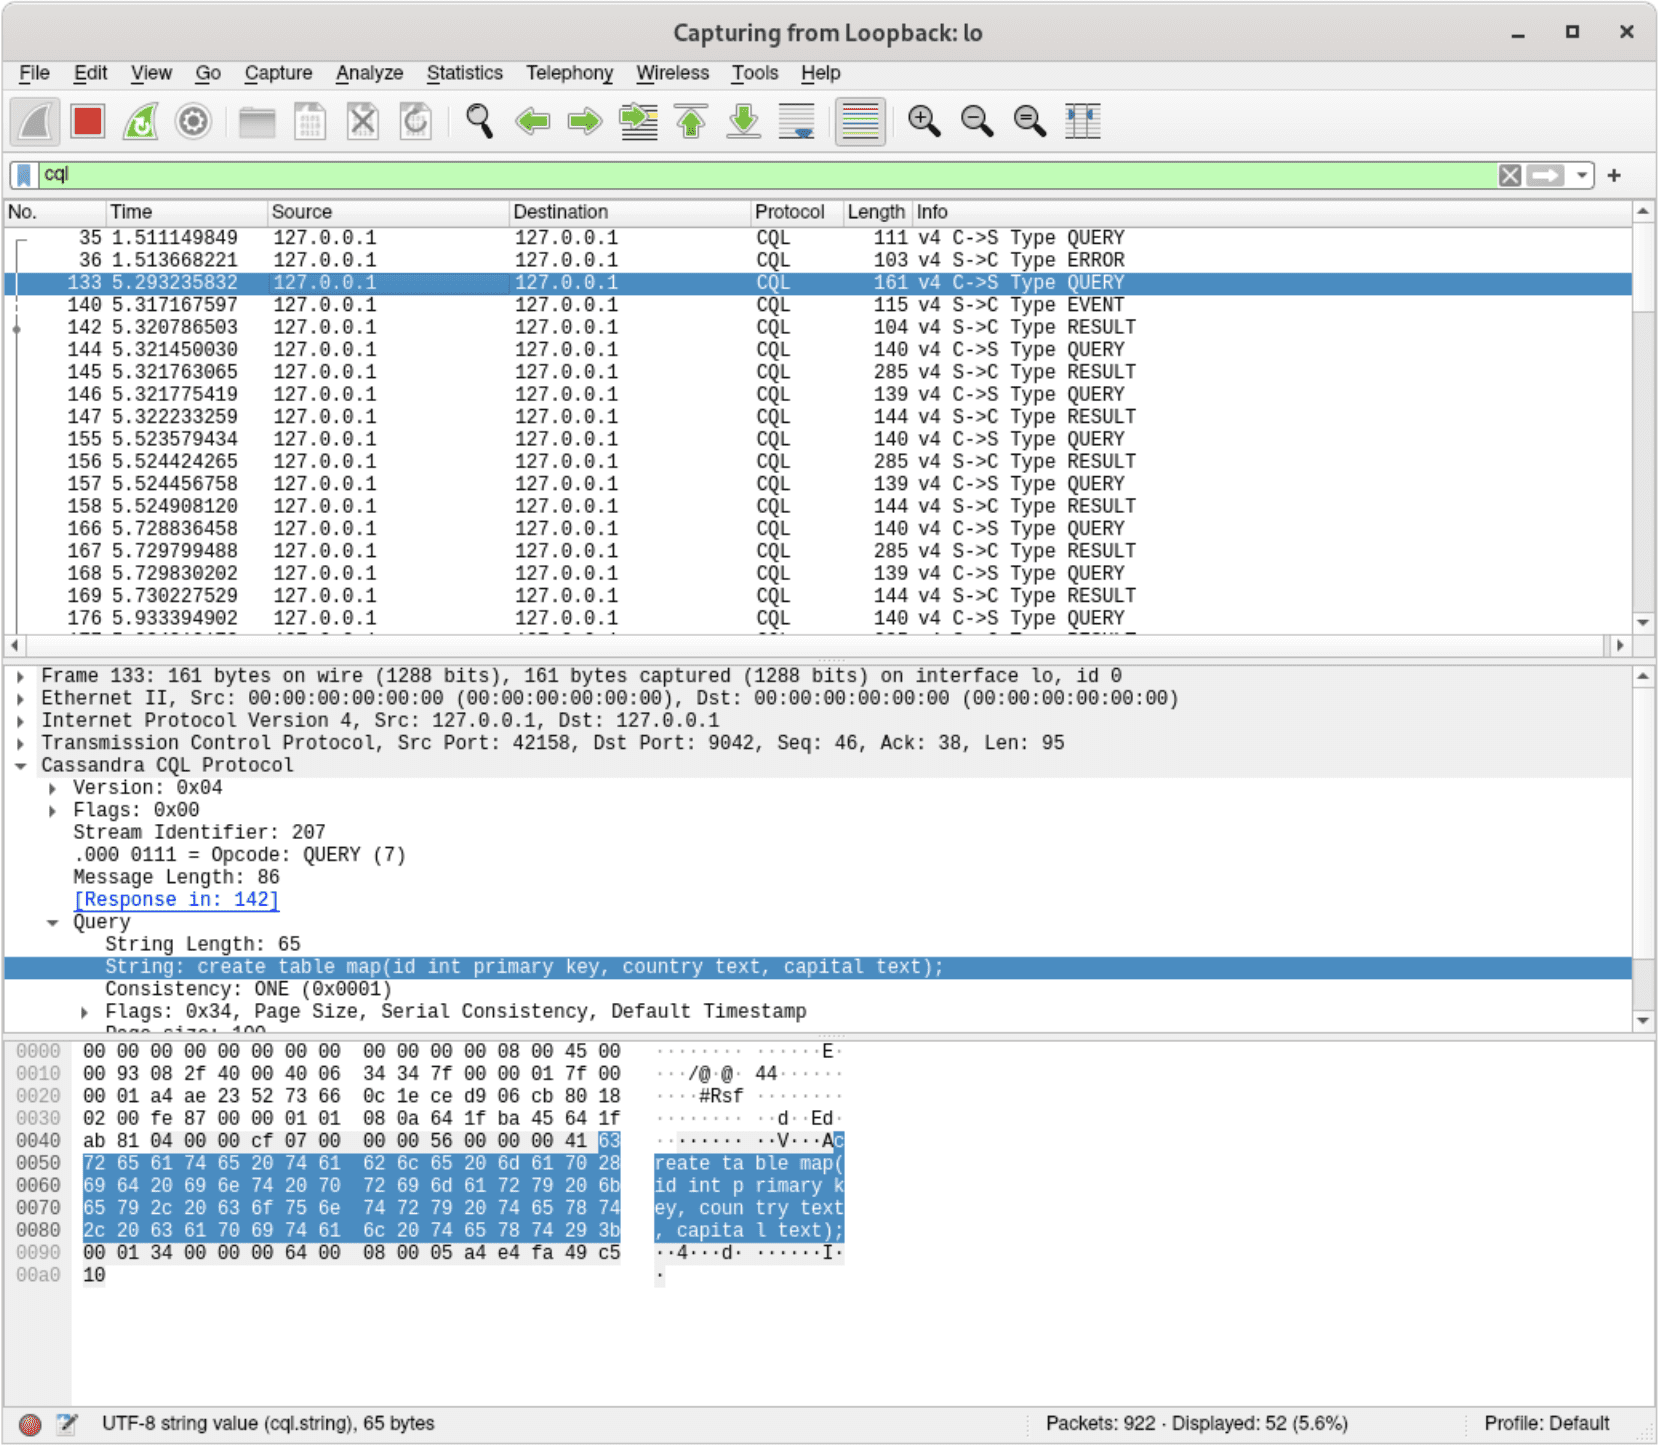
With the “cql” filter, only CQL packets are shown
Filters can also limit the output to specific packets we’re interested in, e.g. only queries and their results:
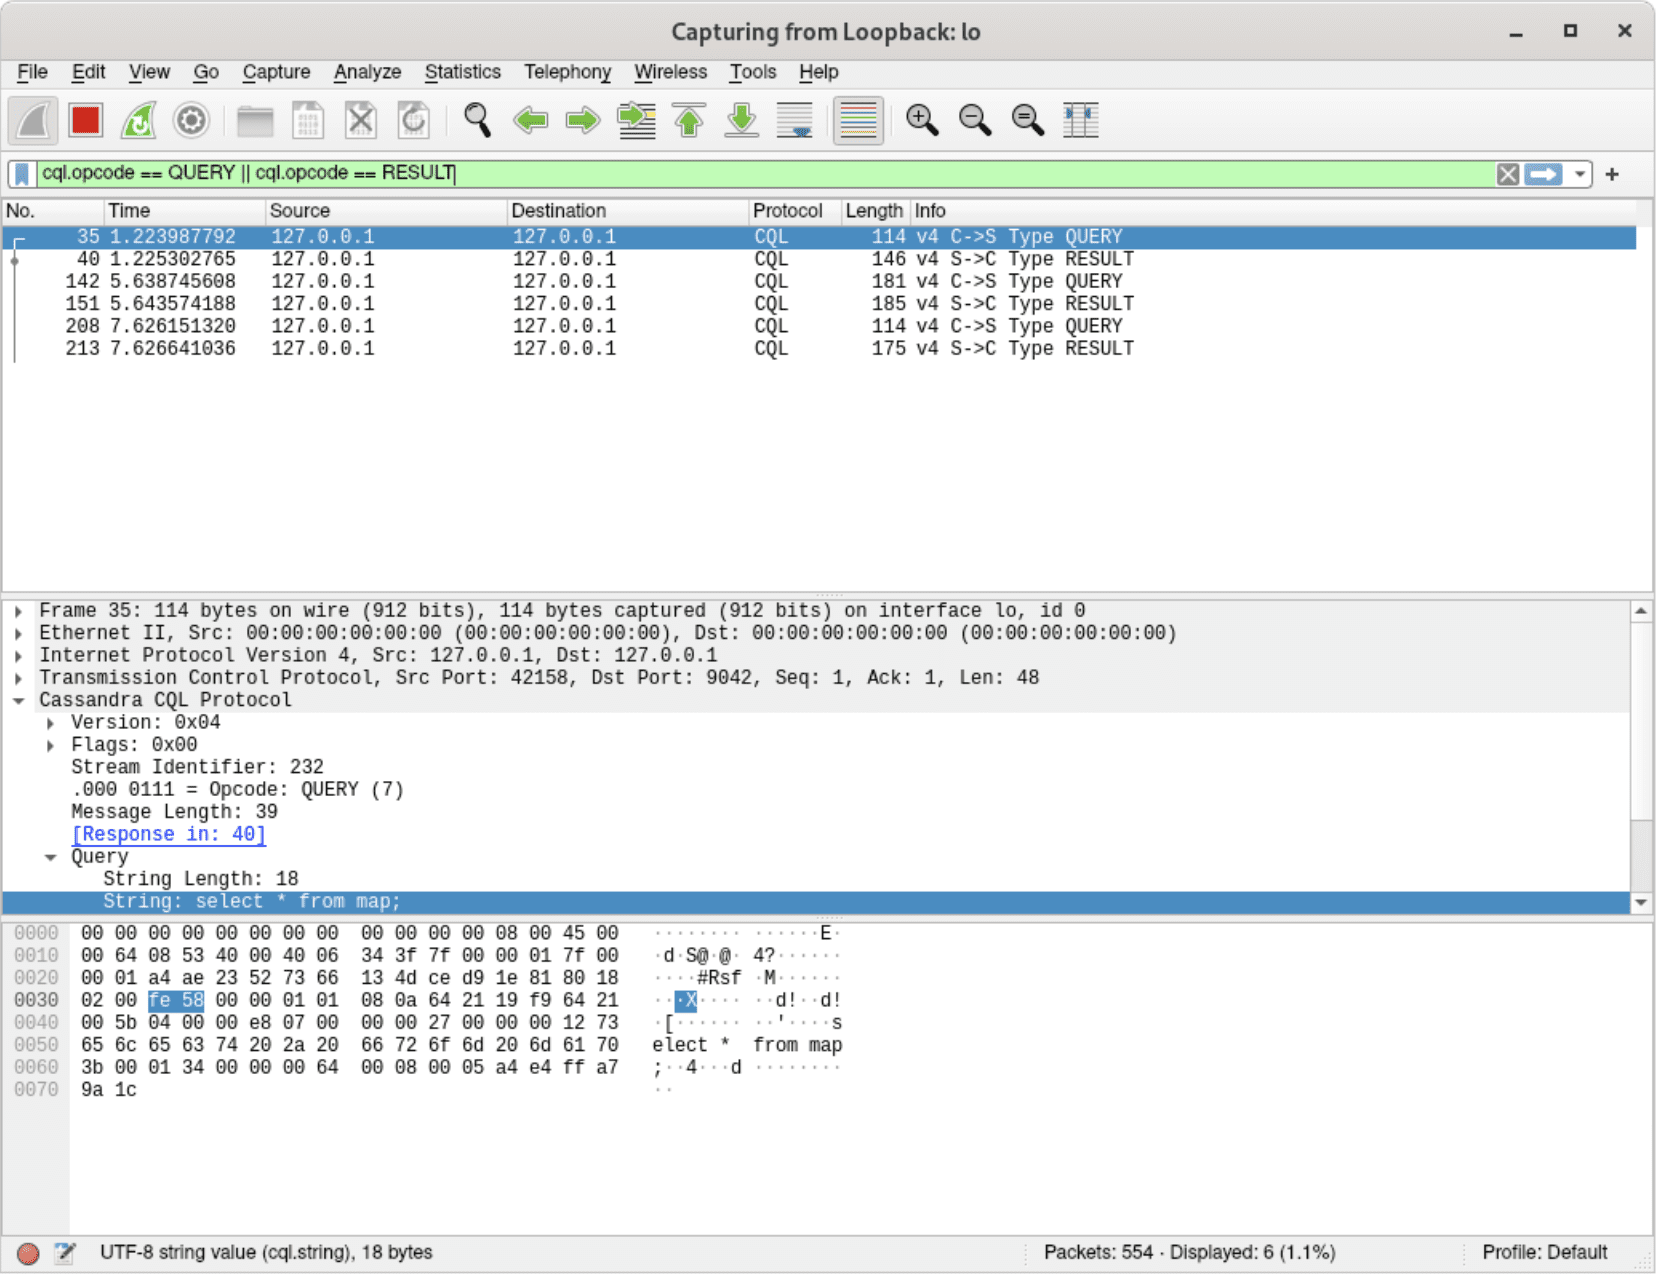
Only CQL requests and their results are shown – other types (auth, events, etc.) are not visible
That’s all very cool, but ScyllaDB is much more than its client-server protocol! Nodes also need to communicate with each other to fulfill various tasks. These are for example:
- sending user-provided data from coordinators to replicas
- reading data from other replicas in order to fulfill the consistency level
- generating materialized view updates
- updating schema information – announcing new tables, keyspaces, etc.
- sharing cluster state via gossiping – which nodes are down, which are still bootstrapping, etc.
- performing PAXOS rounds for lightweight transactions
and many more.
While it’s very useful to be able to dissect and examine what happens between clients and ScyllaDB nodes, it’s often not enough. We know that a write request reached the coordinator node, but was data replicated to other nodes? Were all needed view updates generated and sent to appropriate replicas? Dissecting the network traffic between ScyllaDB nodes can help answer these kinds of tough questions.
Now, since ScyllaDB’s internal protocol is based on TCP and usually happens on port 7000, we can try to manually interpret the packets and check if they match our expectations.
For instance, the image below clearly represents a mutation, since the ninth byte of the TCP payload equals to 0x01, which is ScyllaDB’s internal opcode for mutation:
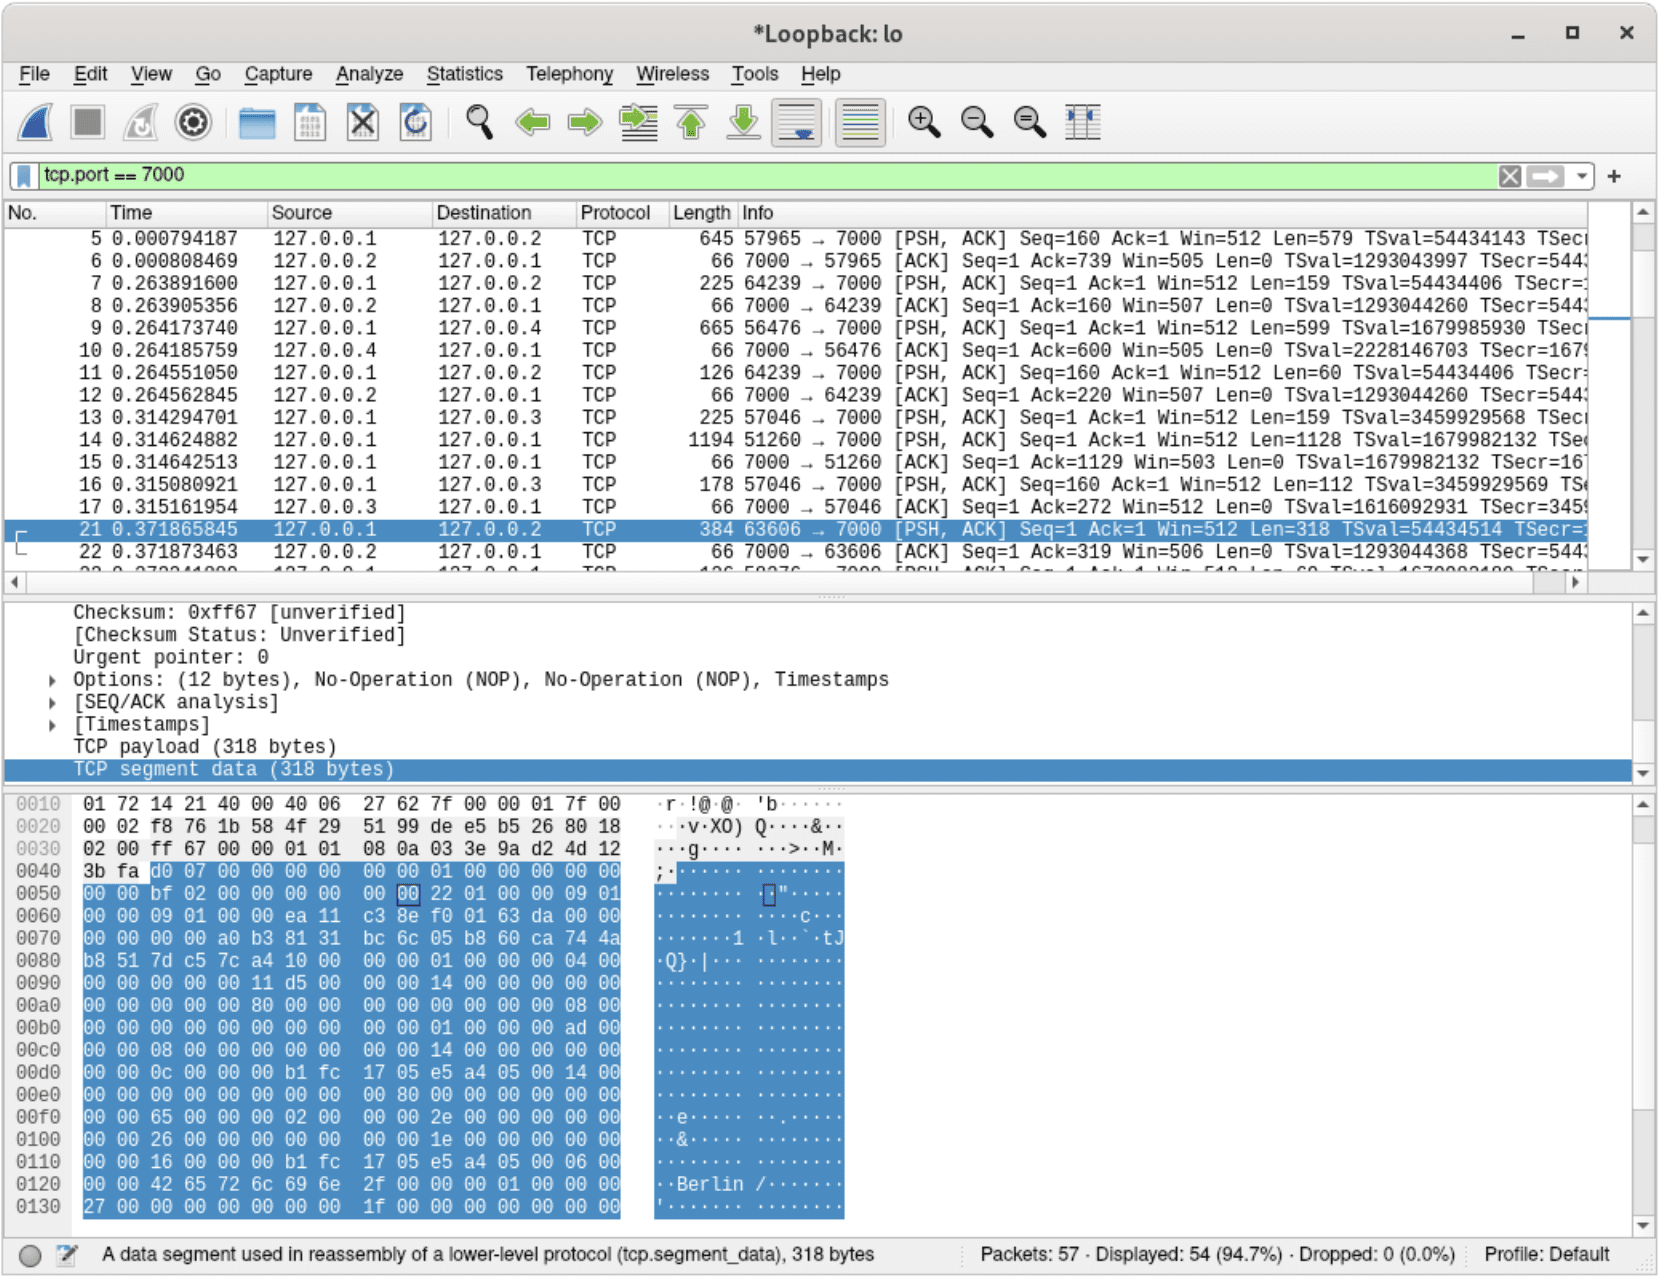
Raw TCP payload inspection
Easy, right? Just kidding – parsing the flow manually (or even with custom shell scripts) based on raw TCP packets is a tedious process. After all, couldn’t Wireshark decode opcodes for us in a neat manner, just like it does for CQL? Well, now it can — an initial implementation of ScyllaDB internal protocol dissector landed in Wireshark.
Quick Start
ScyllaDB dissector was merged to Wireshark master only recently (March 30th 2020), so if it hasn’t become part of any official Wireshark release, it would first need to be built from source.
Example script:
git clone git@github.com:wireshark/wireshark.git
cd wireshark
mkdir build
cd build
cmake .. -DCMAKE_BUILD_TYPE=Release
make -j16
Now that Wireshark is built and ready to launch, one last thing to do is to ensure that ScyllaDB packets will get recognized. Since port 7000 is not officially IANA registered as ScyllaDB protocol (https://www.iana.org/protocols), we need to configure wireshark to look for ScyllaDB at port 7000. That can be done via:
- Wireshark GUI: `Analyze > Decode As > set ScyllaDB as default for TCP port 7000`
- a config entry in Wireshark decoding config:
echo "decode_as_entry: tcp.port,7000,ScyllaDB,ScyllaDB" >>
~/.config/wireshark/decode_as_entries
That’s it! Wireshark should now be able to properly dissect ScyllaDB inter-node messages.
Examples
Let’s take another look at the network traffic after the ScyllaDB dissector was added. It’s now much easier to determine which packets represent a mutation — rows sent from the coordinator to replicas, in order to be saved on disk:
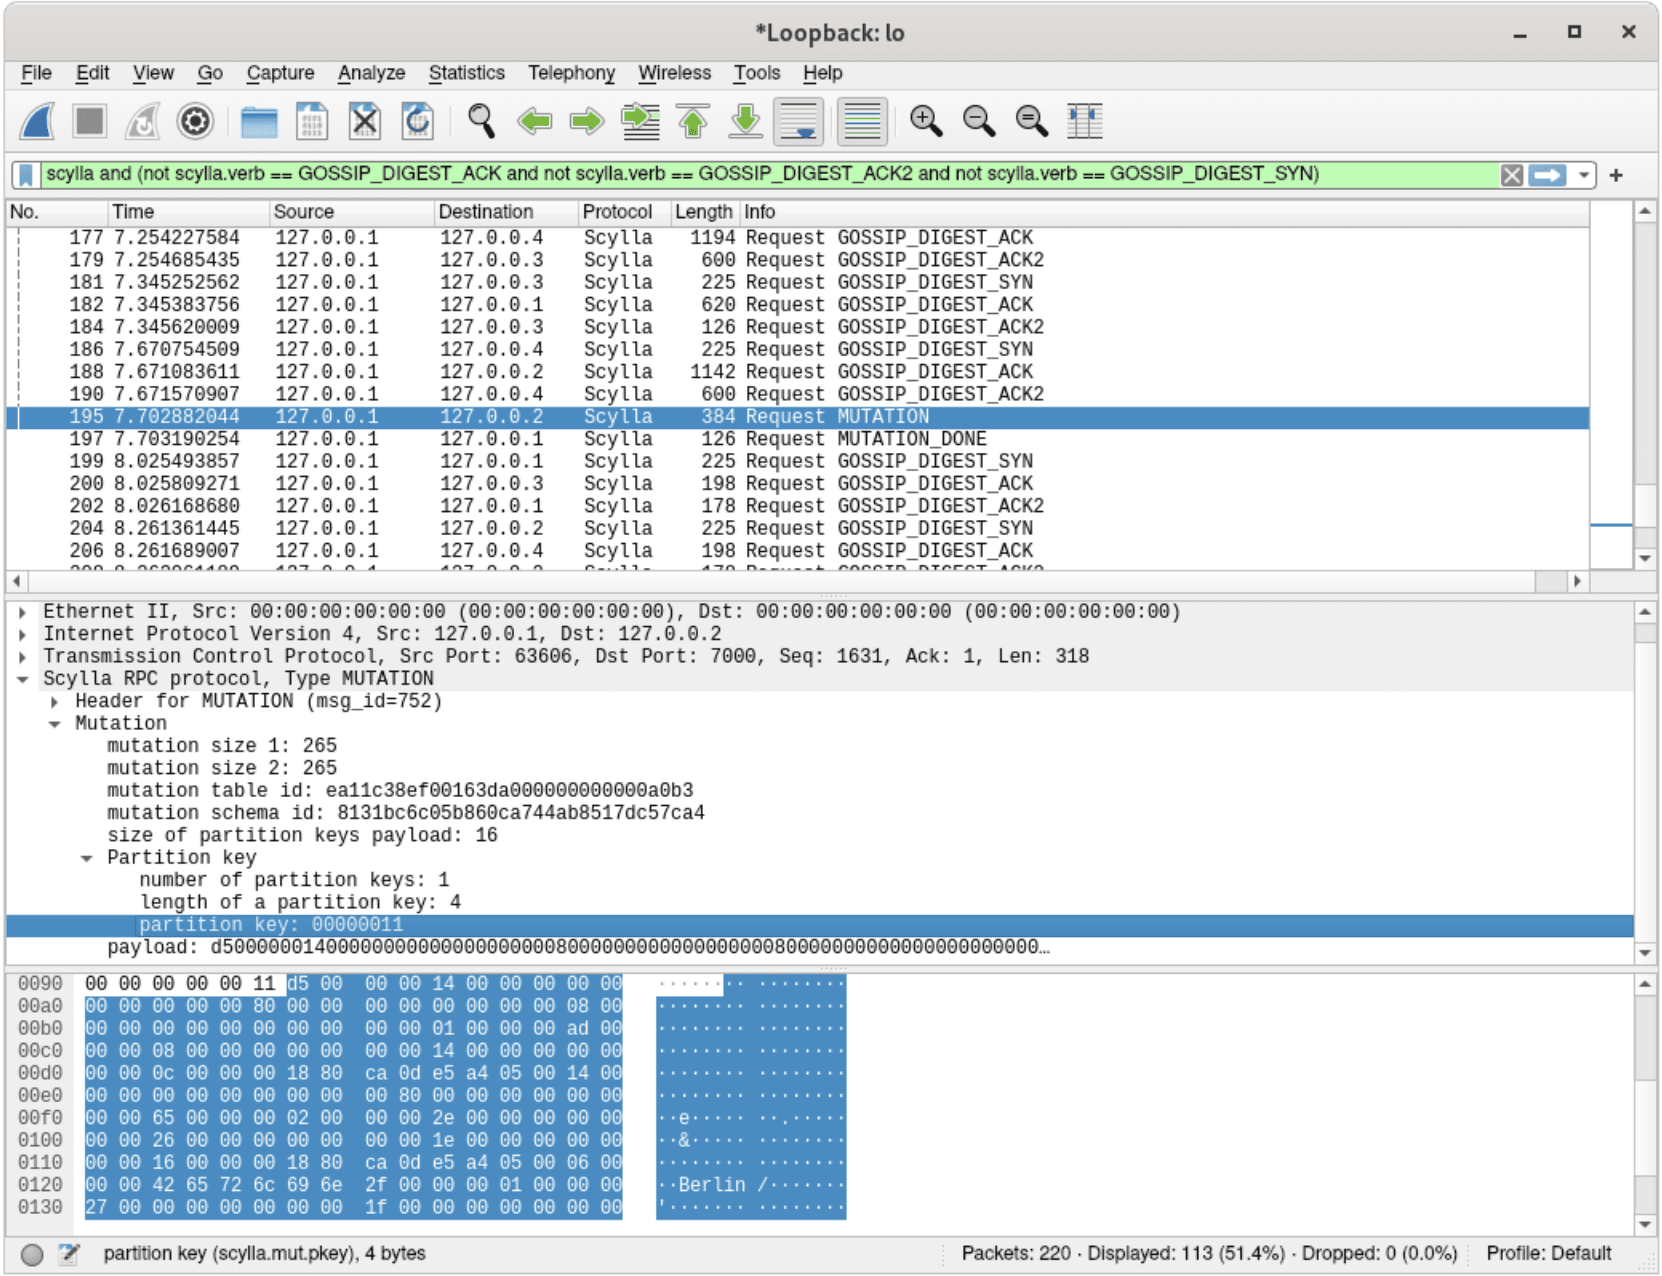
A dissected mutation – carrying data expected to be written to a replica
The reading process also became more transparent – here we can see that one node received a read request, while another one was asked only for a digest, which will be used later to compare checksums and ensure that the consistency level requested by a user was reached:
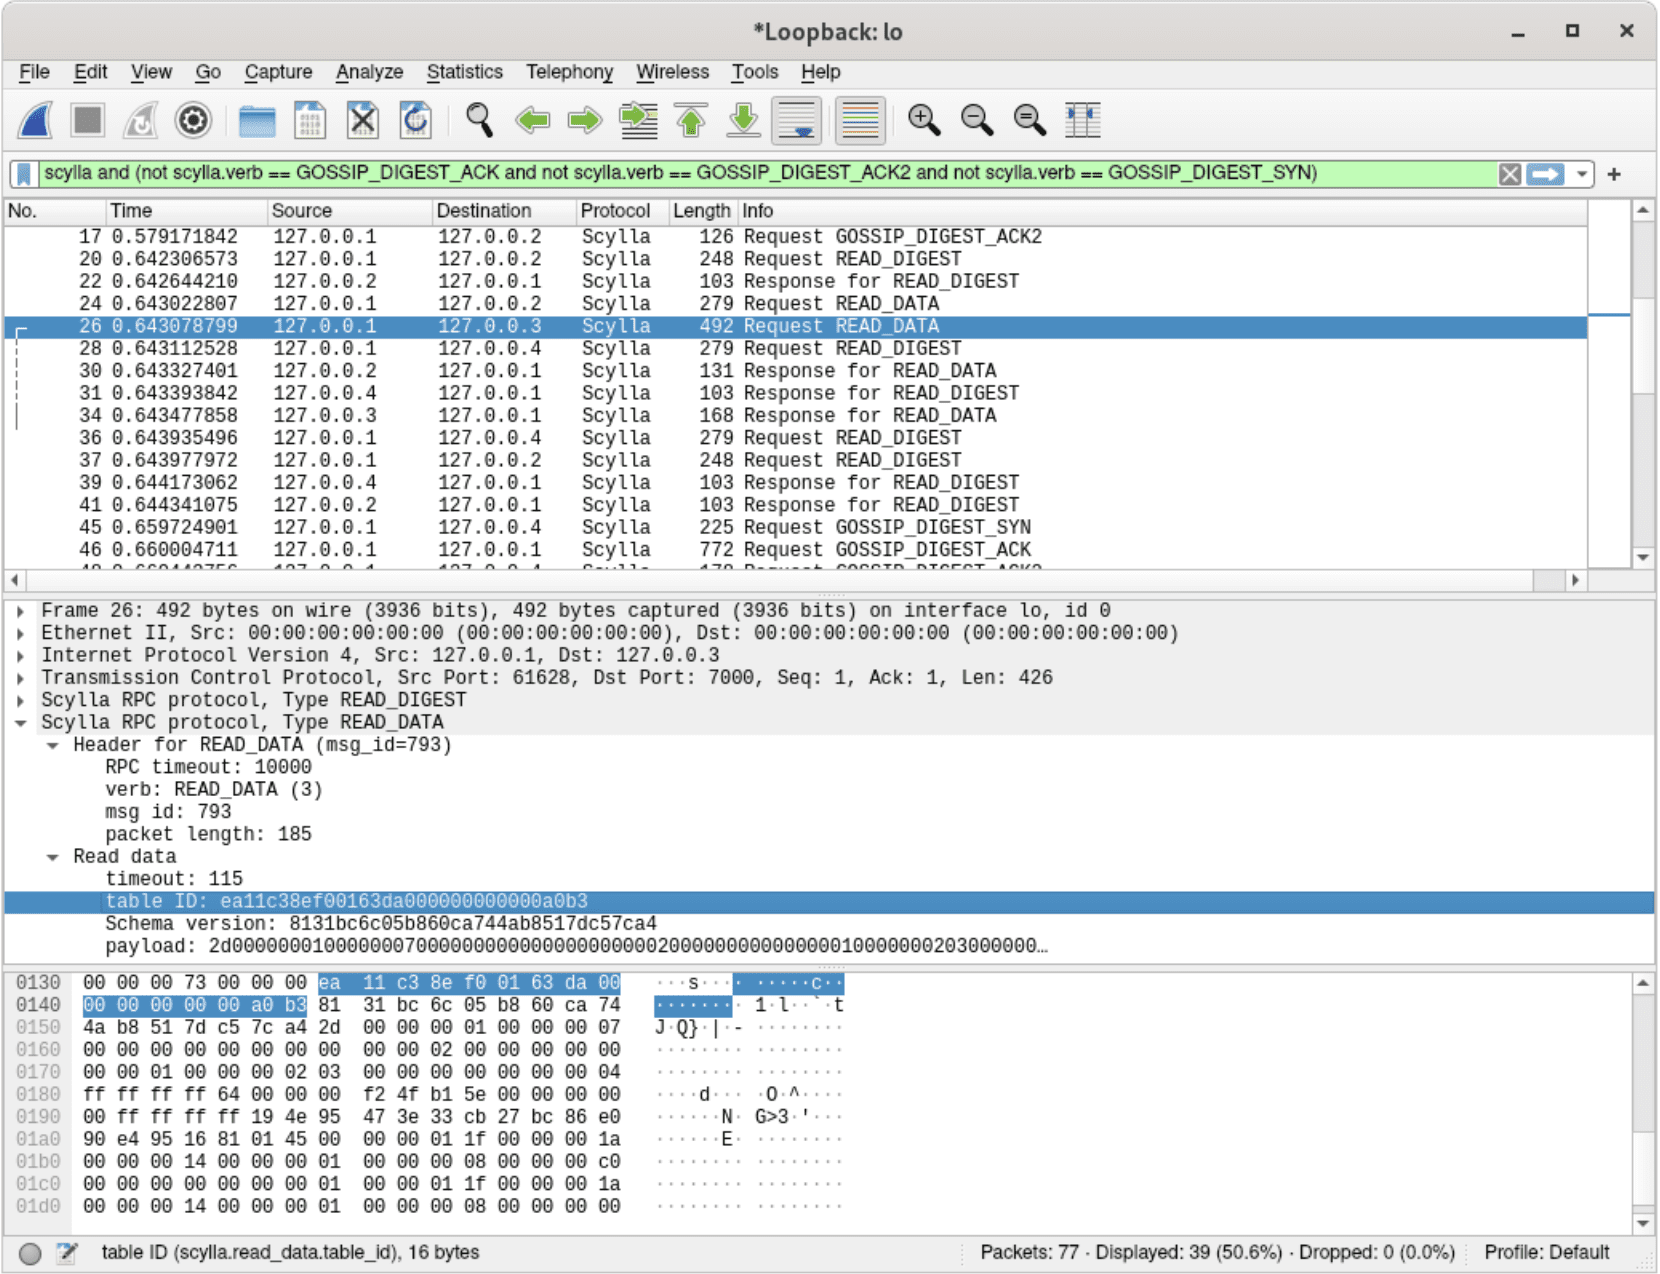
A dissected read request – asking for data from a specific table
The ScyllaDB dissector is still in development, so most of the packets are not fully dissected — but it’s always possible to see what kind of operations they are responsible for.
It’s easy to notice that the majority of the traffic comes from exchanging gossip information between all nodes. Wireshark filters come in really handy when it comes to extract only interesting information from the stream of packets. Here are some examples:
- All packets except gossip information:
scylla and (not scylla.verb == GOSSIP_DIGEST_ACK and not scylla.verb == GOSSIP_DIGEST_ACK2 and not scylla.verb == GOSSIP_DIGEST_SYN) - Write operations only:
scylla.verb == MUTATION - All write operations for a specific partition key in a specific table:
scylla.mut.table_id == ea:11:0f:44:50:9e:ef:aa:00:00:00:00:00:00:23:8a and scylla.mut.pkey == 68:65:68
Naturally, it’s possible to dissect multiple protocols at a time in order to get a complete picture of what happened in the distributed environment. For instance, here’s a comprehensive example of a complete flow: inserting a row with a lightweight transaction, and then trying to insert it again, which does not succeed, since it already exists. In order words, a following CQL payload is executed on a `map` table (defined as `CREATE TABLE map(id int PRIMARY KEY, country text, capital text)`:
INSERT INTO map(id, country, capital) values (17, 'Germany', 'Berlin') IF NOT EXISTS;
INSERT INTO map(id, country, capital) values (17, 'Germany', 'Berlin') IF NOT EXISTS;
Note that the example includes both client-ScyllaDB communication and ScyllaDB inter-node messages, which together form a complete picture of what happened in the cluster. The following Wireshark filter was used:
(scylla and (not scylla.verb == GOSSIP_DIGEST_ACK and not scylla.verb == GOSSIP_DIGEST_ACK2 and not scylla.verb == GOSSIP_DIGEST_SYN)) or cql
Wireshark allows visualizing communication as a flow graph, so let’s take advantage of this capability:
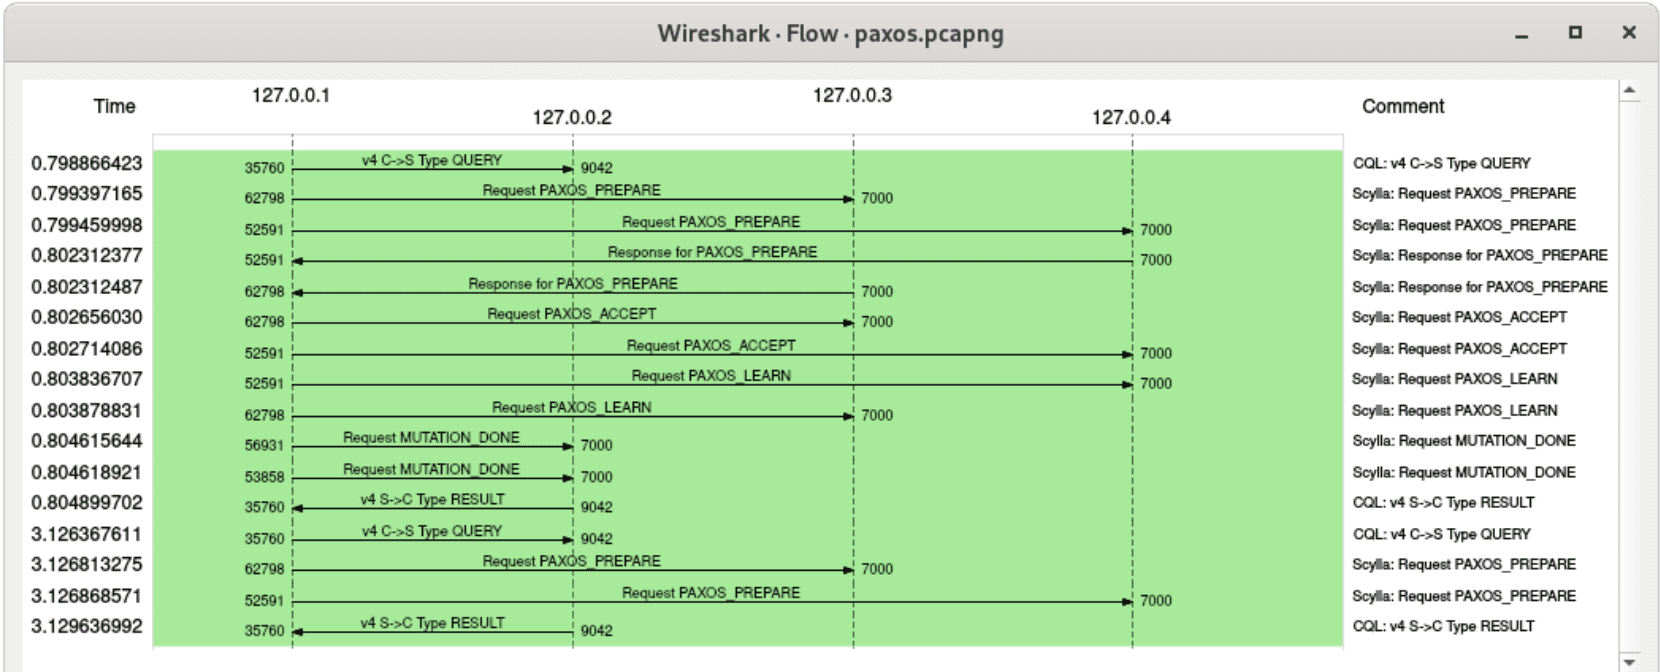 A flow graph for packets involved in a lightweight transaction
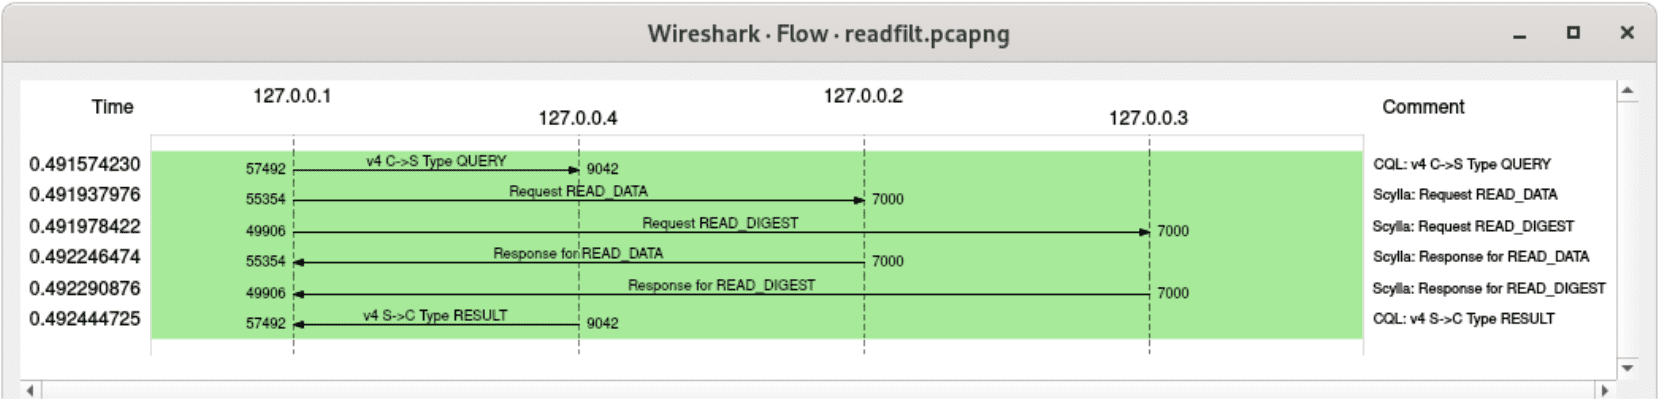
The dissector can also visualize the throughput overhead induced by materialized views and secondary indexes. Here’s how a query which uses a secondary index looks like — it needs to read rows not only from the base table, but also from the underlying index, which may reside on other nodes:
A flow graph for an indexed read operation with consistency level TWO
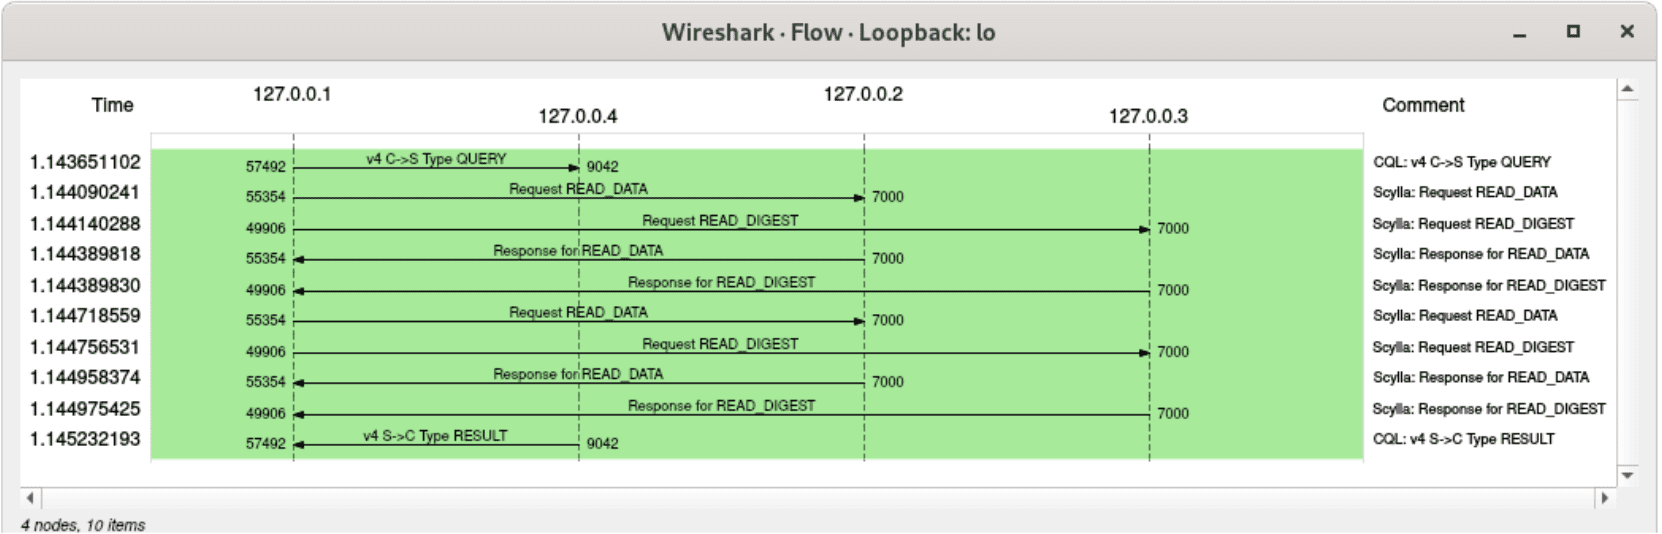
and here’s a corresponding query, which simply specifies a primary key to read from, with consistency level TWO. It means that one node will be queried for data, and another will send only a digest:
A flow graph for a regular read operation (without any indexes involved), consistency level TWO
Similarly, here’s how writing to a table looks like with replication factor 2. No surprises here – two mutations need to be sent to appropriate replicas:
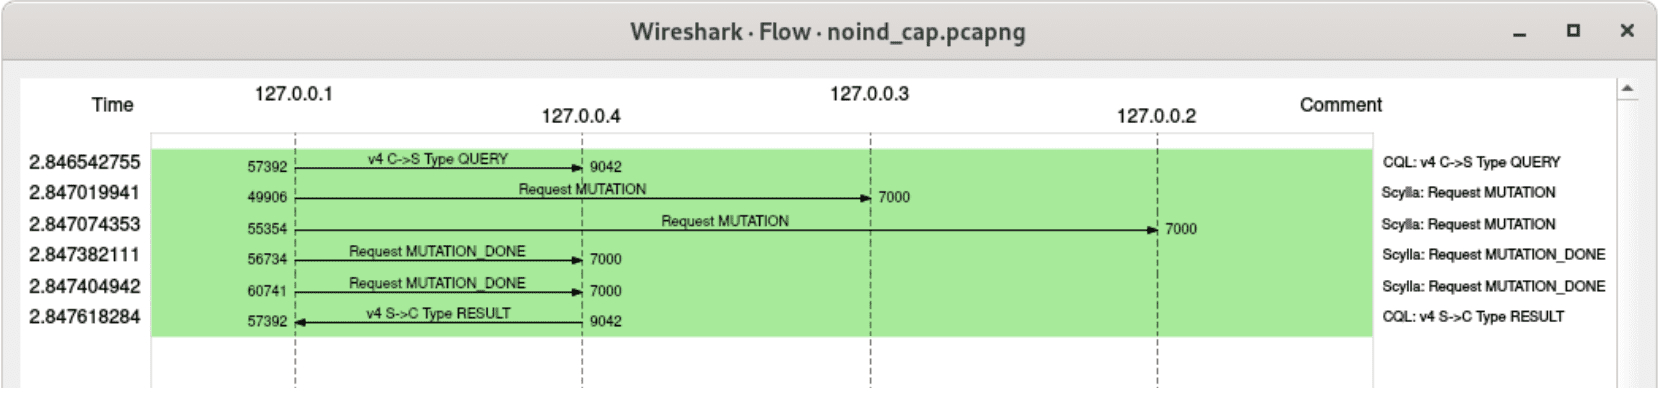
A flow graph for a regular write operation with replication factor 2
and here’s a corresponding write operation, but after adding a secondary index to this table – besides writing to the base table, view updates are also generated and sent:
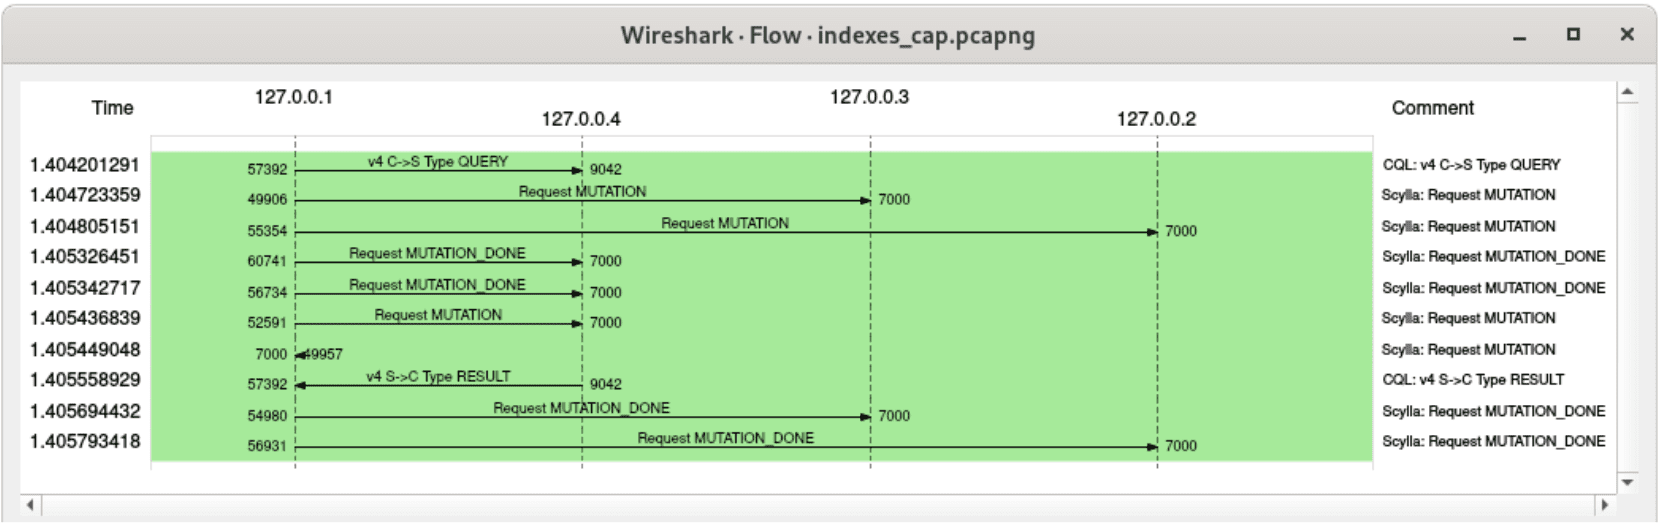
A flow graph for a write operation involving materialized view updates, replication factor 2
The trace above shows another interesting property of materialized view updates – the fact that they are executed in the background. Two mutations were acknowledged before returning a response to the client – these are the writes to the base table. Conversely, it can be observed that view updates were acknowledged only after the client received a response.
Summary
Protocol dissectors are a very powerful tool to investigate issues in distributed systems. Snooping on internal communication between ScyllaDB nodes became much easier with Wireshark, now that it’s officially able to dissect ScyllaDB inter-node protocol. Give it a try!
Update
As of December 2020, ScyllaDB RPC dissector is available in Wireshark 3.4.0, which is bundled by default in Fedora so you don’t have to compile it on your own. See the display reference here.