
We recently launched ScyllaDB Cloud, allowing you to get the most out of ScyllaDB while not having to burden yourself with cluster management tasks.
Worried about scaling up or out? Replacing a node? Monitoring disk usage? Scheduling and keeping an eye on repairs and backups? Taking care of various security settings? Applying hotfixes? Well have no fear! We will take care of all these concerns for you and much more.
In this blog post we will cover the initial onboarding process, including creating an account and spinning up a cluster. In another upcoming blog we will cover specific migration options you have to get your data into ScyllaDB Cloud (NoSQL DBaaS).
Deploy a Cluster
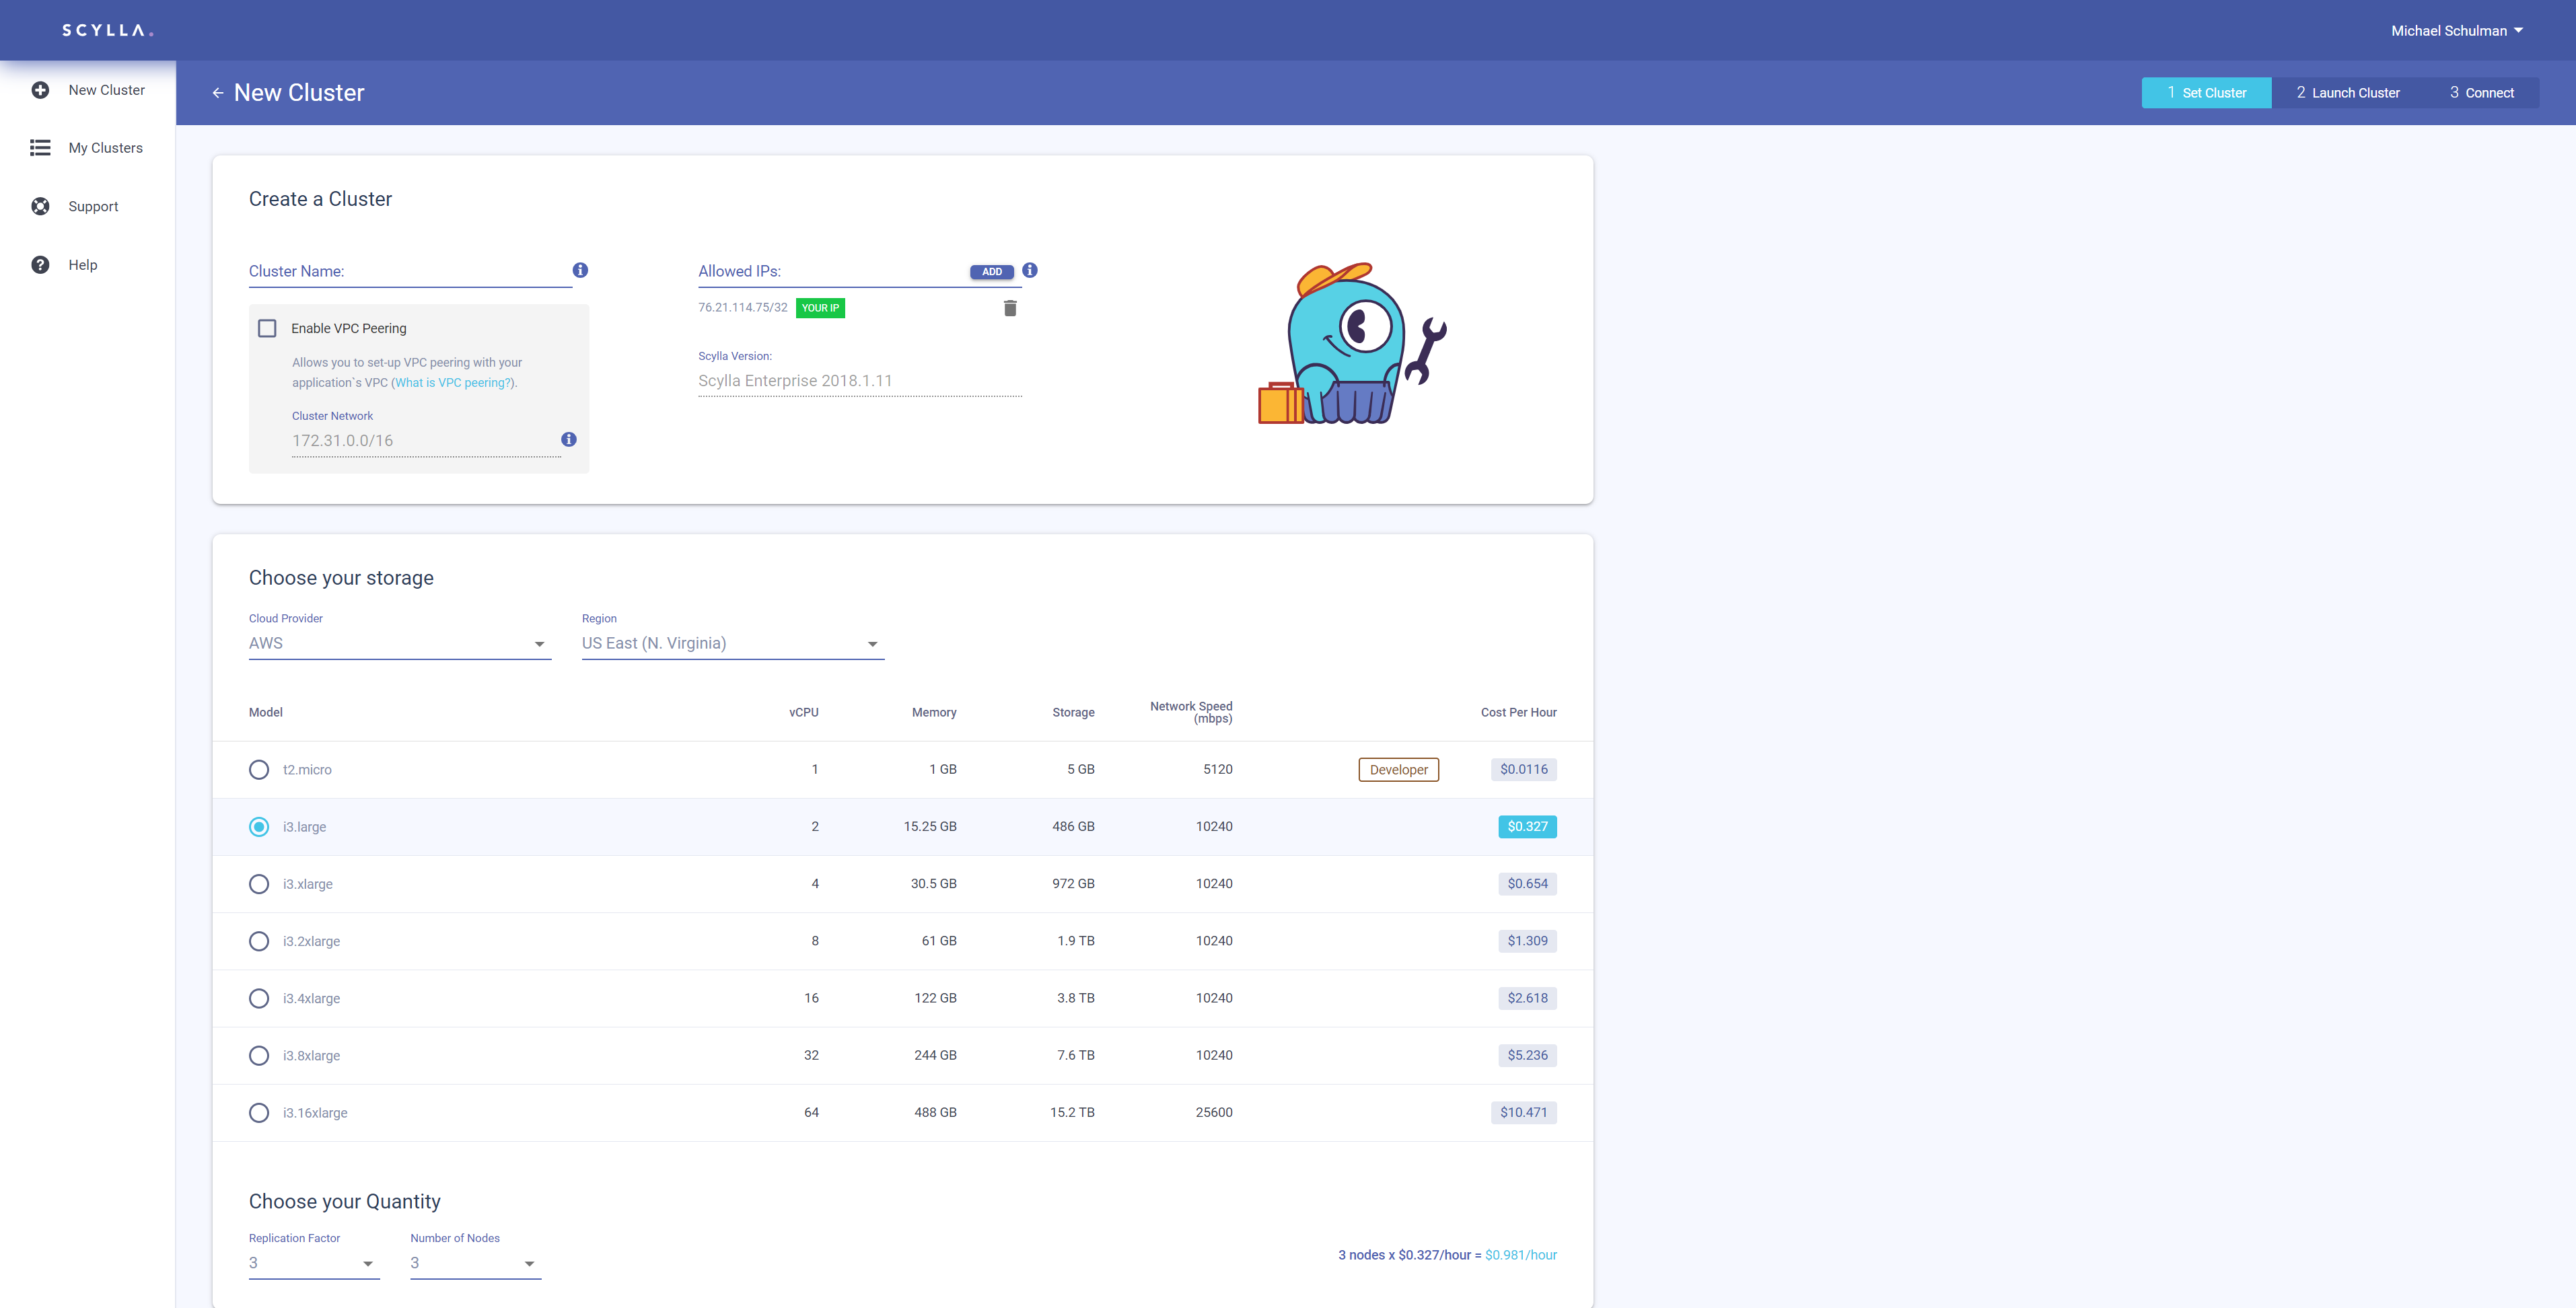
After you sign-up for ScyllaDB Cloud it’s now time to sign-in and create your cluster:
- Set your cluster name
- Set the allowed IPs: your client / driver IPs (IP ranges are supported)
- Cloud provider is AWS, select the region for your cluster deployment
- Select the instance type to be used (i3 family options, or t2 for developers)
- Select the Replication Factor (RF) and Number of nodes (Num nodes options, corresponds to RF)
- Optional: Check the box if you wish to enable VPC peering, and enter the Cluster Network CIDR. For each cluster we create a separate VPC. For each availability zone we create a subnet with 256 IPs. You can choose any range from the private ones 10.x.x.x or 192.168.x.x or 172.x.x.xNote: Please choose a CIDR that won’t overlap your existing VPCs.
Note: Distribution to Availability Zones (AZs) correspond to the RF. At the bottom section you will see an illustration of the AZs node distribution. Nodes will be evenly distributed between AZs.
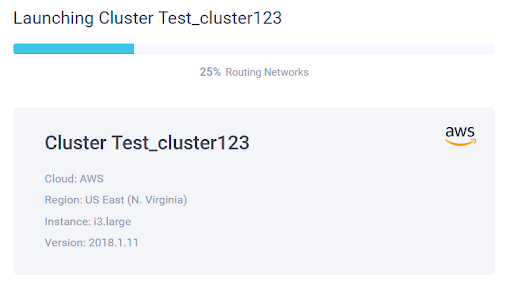
Launching the Cluster
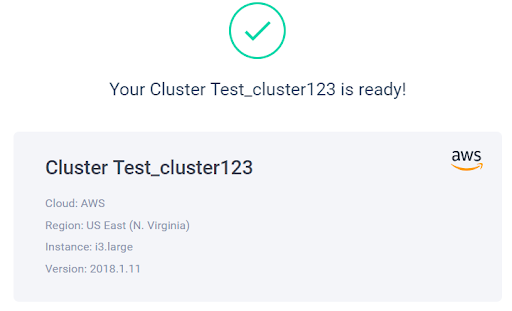
Next you will be able to see the cluster bootstrapping in progress until it’s completed.
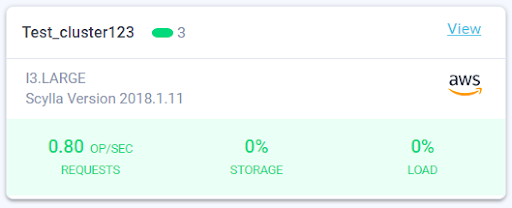
When the cluster is up and running, you can already observe 3 major metrics in the UI:
- Requests (Ops/Sec)
- Storage space – Consumed disk space
- Load (ScyllaDB cpu-reactor load) – Load generated by ScyllaDB
Add VPC Peering
If you enabled VPC peering, you will now see the screen to configure it. There are 3 steps: Request, Accept and Route.
1st step – Request: In order to setup the VPC peering we will need you to provide us the following details:
- AWS Account Number → for example: 868456412743
- VPC ID → for example: vpc-094d5a56043du234jf
- VPC CIDR → for example: 10.0.0.0/16
- Region → for example: us-east-1
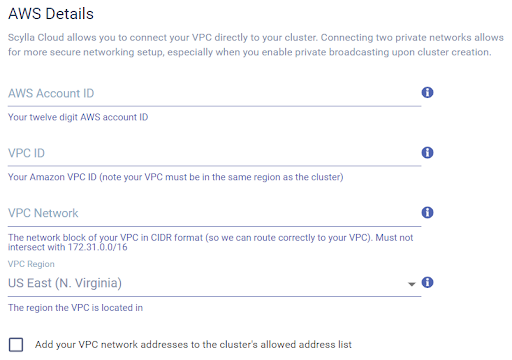
Don’t forget to mark the check-box to add the VPC network to the cluster’s allowed IPs (if you do forget, you can still add it later manually).
Press the “Submit VPC Peering Request” button; this takes you to the 2nd step.
2nd step – Accept: Here you will find detailed explanations with screenshots on how to accept the request on your AWS UI.
Once you completed the needed steps on AWS, go back to ScyllaDB Cloud UI and press the “Connect” button to get to the third step.
3rd step – Route: here there are also detailed steps and screenshots on how to setup the routing tables via the AWS UI.
Once you have completed the steps on AWS, go back to ScyllaDB Cloud UI and press “Done”.
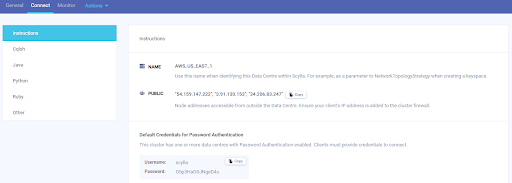
Connect to ScyllaDB Cloud using various drivers
If you did not enable VPC peering, once the cluster bootstrap is done, you will be redirected to the “Connect” tab. Here you can find client side code examples on how to connect to your ScyllaDB Cloud cluster using various drivers.
The examples already include the relevant details for your cluster, like the IP and datacenter name. Examples are provided for the following drivers:
- Cqlsh
- Java
- Python
- Ruby
- Others
Cluster view
Go to Cluster view and select your cluster to see a high level view of your cluster details:
- Cluster ID
- ScyllaDB version
- Cluster size
- Replication Factor
- CIDR Block (optional) -> CIDR block you’ll want us to create ScyllaDB Cloud Cluster → for example: 10.0.0.0/16 (Needs to be different from your application VPC CIDR)
- Allowed IPs → you can edit it from this view as well, adding or removing IPs / IP ranges
- Public IP | Private IP | Status | Region | AZ | Instance Type
- On the top right side you can observe the 3 major metrics mentioned earlier
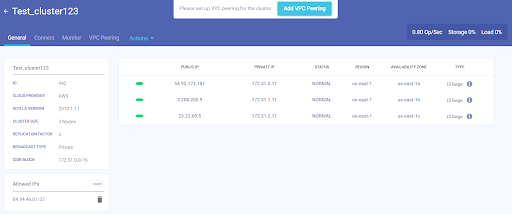
Note: If you checked “Enable VPC peering” check-box and did not complete the VPC peering yet, you will see the “Add VPC Peering” notice at the top
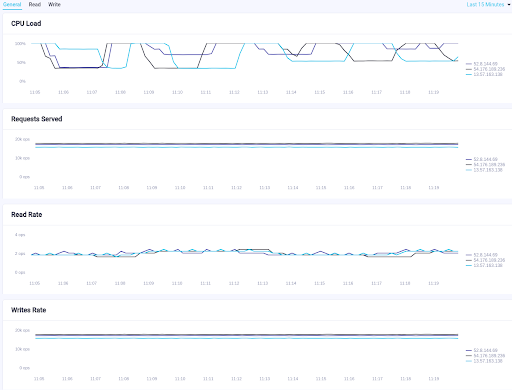
ScyllaDB Cloud Metrics
From your cluster view you can dive into the “Monitor” tab to see the following list of metrics:
- CPU Load
- Requests Served
- Read Rate
- Average Read Latency
- Writes Rate
- Average Write Latency
Note: We are constantly improving the metrics exposed to the UI, so over time the list will grow. ScyllaDB DevOps are monitoring thousands of metrics per node for you in the background.
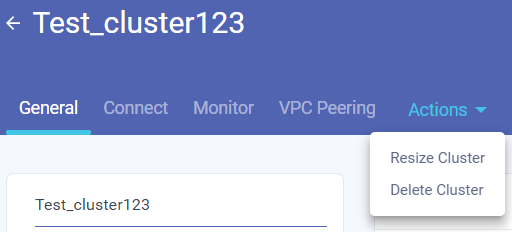
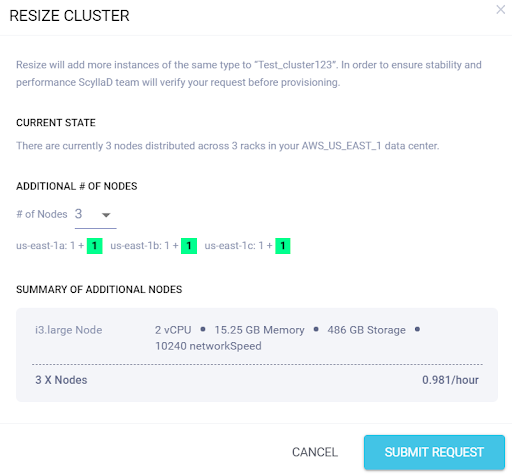
Resize / Delete cluster
Want to resize or delete your cluster? No worries, here’s how to do it.
- In your cluster view, click on “Actions” tab, there you’ll find 2 options: Resize / Delete
- Submit the request and our DevOps will take care of it for you.
We manage everything for you!
- Monitor thousands of metrics per server
- Set automatic recurring repairs
- Set Alerts
- Disk Space
- CQL connection (node down)
- Backups (last 3 days, week + 2 weeks)
- Security settings
- Authentication Encryption
- Applying hotfixes and upgrades
Expert Cloud Support
Keep in mind that upon signing up for ScyllaDB Cloud we create a Zendesk account for you, if you don’t have one already. This allows you to press the “Support” button in the ScyllaDB Cloud user interface for immediate access to your Zendesk account and to submit a ticket.
The ScyllaDB support response team is there for you 24/7/365. We have DevOps monitoring your cluster and taking care of any request for scaling-up/out you might have, as well as engineers (Tiers 1-4) around the globe to respond to any Critical and High priority tickets.
Submit a ticket
Something’s not right? Cluster unavailable, Performance issues? Here’s how to submit a ticket.
- Press the “Support” button and you will be redirected into Zendesk
- Use the “Submit a request” form.
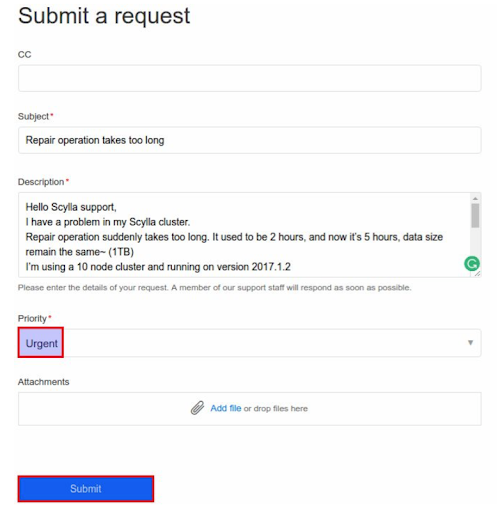
Ticket Priority
Please make sure to select the appropriate Ticket priority. P1 and P2 tickets triggers On-Call DevOps / Engineers to engage and help resolve the issue.
- Urgent (P1)
- Cluster unavailable
- Possible data lost
- Possible data corrupted
- High (P2)
- Cluster is partially available (degraded)
- Cluster suffers from major performance problems
- Normal (P3)
- Cluster suffers from minor performance issues
- Low (P4)
- Questions, Requests
Upgrades and Maintenance
ScyllaDB Cloud runs the ScyllaDB Enterprise edition. From time to time there are patch releases. In some cases we will define some upgrades as critical ones. Mandating an upgrade. Don’t worry, we’re not gonna pull the rug from under your feet – All upgrade procedures will be coordinated with the user.
Next Steps
After you get your cluster up and running, the next step is to load your data. We will be publishing a migration blog soon on migrating specifically to ScyllaDB Cloud, but for now you might want to read our blog about migration strategies or watch the on-demand webinar.
If you do try ScyllaDB Cloud, we’d love to hear your feedback, either via our Slack channel, or by dropping us a line.