In a datastore like ScyllaDB, there are many actors competing for disk I/O. Examples of such actors are data writers (in ScyllaDB’s parlance they can be either memtable or commitlog writers), and a disk reader fetching the data to serve a cache miss. To illustrate the role that competition plays, if we are just issuing disk I/O without resorting to any fairness or balancing consideration, a reader, for instance, could find itself behind a storm of writes. By the time it has the opportunity to run, all that wait would have translated into increased latency for the read.
If one is using a threaded approach for managing I/O, a thread can be assigned to a different priority group by tools such as ionice. However, ionice only allows us to choose between general concepts like real-time, best-effort and idle. And while Linux will try to preserve fairness among the different actors, that doesn’t allow any fine tuning to take place. Dividing bandwidth among users is a common task in network processing, but it is usually not possible with disk I/O without resorting to infrastructure like cgroups.
More importantly, modern designs like the Seastar framework used by ScyllaDB to build its infrastructure may stay away from threads in favor of a thread-per-core design in the search for better scalability. In the light of these considerations, can a userspace application like ScyllaDB somehow guarantee that all actors are served according to the priorities we would want them to obey?
As we will discuss throughout this article, even if the balancing aspects are set aside for a moment, is it really a good idea for a userspace application like a datastore, that generates lots of I/O requests and depends on having them finished in a timely fashion, to always throw requests at the kernel and the layers below as fast as they arrive?
In this two-part article, I will explore the details of Seastar’s Disk I/O Scheduler used in applications like ScyllaDB, commonly referred to as the “I/O Queues” because of its implementation as a set of queues. In this first part, I will discuss the motivations for having an userspace Disk I/O Scheduler in the first place—including a detailed explanation of the problems that led to its implementation and some very simple real life examples for ScyllaDB that demonstrate the problems.
In the next installment, we will look at the design for the current incarnation of the scheduler, the effects of guaranteed fairness among classes, with example usage from ScyllaDB, and future work.
Limiting the number of outstanding requests
Due to its highly parallel nature, Seastar is capable of delivering high numbers of requests per second from the processor side. As much as we would expect the disks to be able to handle all requests as they are generated, that is unfortunately not always the case. In some setups, the common disk latency can become high enough that the requests will pile up somewhere down the I/O stack. Where exactly—if in the physical disk queues, in the kernel block layer, or in the filesystem—is hard to predict. It depends on a confluence of factors related to the specific implementation of each of these components.
But does that queue-waiting matter? The future-promise programming model in Seastar is such that as soon as the I/O finishes, processing will continue, meaning that aside from the increased latency, it is, at least in principle, fine to have them piling up a little.
Regardless of the programming model, queueing those requests in userspace instead of allowing them to sit waiting in a queue below us won’t save us any latency. After all, such requests are queued all the same, and we are just changing in which queue that wait is happening. But if we are certain that a request will just sit in a queue somewhere down the stack without making any progress, here is why it would be much better to queue them ourselves: By doing this we can have a richer processing of those queued I/O requests. For instance:
- We can provide metrics for the application and its users so it knows it should maybe throttle its clients. Clients which are synchronous will automatically be throttled if requests just take longer.
- We can prioritize certain requests and send them at the next opportunity, regardless of how many others we have.
- We can cancel some requests before they had a chance to have any real impact in the layers below us.
Figure 1 shows a top-level diagram of how that is supposed to work. Instead of being sent to the kernel for processing, the requests are sent to the userspace Disk I/O Scheduler that will be able to apply any kind of rich processing that we want.

Figure 1: On the left, the requests generated by the userspace process are thrown directly into the kernel and layers below. In the right, a Disk I/O Scheduler now sits between the requests and the kernel. We can then classify those request into semantically meaningful classes (A and B), and track them, prioritize them, guarantee balancing, and make sure that the lower layers are never overloaded.
Moreover, as we shall see in the following sections, even if we are not doing any processing like described above, queueing requests in the lower layers can unfortunately have deleterious effects that can be avoided by queueing them in userspace. This is due to various limitations of the I/O stack that sits below us. In short, after a certain queueing limit is reached, thrashing behavior will ensue. Referring again to Figure 1, it is possible to see that we are now also in complete control of the number of requests that are admitted into the I/O stack.
To understand why pushing an unbounded number of requests to the kernel can have adverse effects on performance, we need to understand what are the limits we will encounter in the path of a request downwards to the disk. We will explore the limitations of each part of the stack shown in Figure 1 in the following sections.
The filesystem
Let’s be reminded that Seastar is a thread-per-core, asynchronous I/O machine. A Seastar task is scheduled and has the core until it finishes its processor-bound computation. The immediate result of that, is that iowait is Seastar’s enemy #1. Being thread-per-core means that whenever anything on a core blocks or sleeps, there is nothing to be scheduled in its place on that core.
This is, as explored in details here in a recent blog post by Avi Kivity, the main reason for Seastar’s preference and outright insistence on XFS. However, even XFS will sleep during the asynchronous I/O submission path at times. The problem was recently discussed exhaustively at the XFS mailing list. Sleeping during I/O that is supposed to be asynchronous is mostly caused by the fact that XFS, with the goal of expanding parallelism, allocates buffers for its transaction log and metadata updates from an ‘’allocation group’’. If a group encounters contention or runs out of space, I/O submission may fall back to synchronous behavior. That can happen, for example, if metadata writes take a long time to complete, which is the inevitable result of the layers below XFS—the Linux block layer and the disk—being overloaded.
The Linux block layer
If at any point there are more than 128 outstanding requests (configurable) per disk, the Linux block layer will just stop accepting requests and go into synchronous wait before new requests can be queued. This can be probed and configured in the following sysfs file:
$ sudo cat /sys/class/block/sda/queue/nr_requests
128
However, while increasing this can be helpful in some circumstances, if the reason the requests pile up is that the disk cannot respond fast enough, increasing this tunable will just mask the problem. With the previous XFS explanation in mind, that means that the filesystem itself will start blocking because the requests won’t complete in time.
An easy, back-of-the-napkin calculation assuming 200 microsecond response time for 128kB requests—a quite typical Seastar I/O size—tells us that this should be good enough for over 600 MB/s worth of throughput, which is about right for a most modern SSDs. That means that this default for /proc is a sane one, and increasing it is unlikely to help matters in any way.
The disk array itself
Modern SSDs have internal queues that allow the disk to proceed with many operations in parallel. Unfortunately, those queues are finite in number and given enough requests, they will fill up. At some point, throwing more requests at the disk will result in an increase of latency without any increase in throughput. This can be seen in Figure 2.

Figure2: diskplorer response curve for an Amazon EC2 i2.8xlarge instance.
This graph was obtained by running the diskplorer disk evaluation tool in an Amazon EC2 i2.8xlarge instance, with all its 8 disks configured in a RAID0 array. We can clearly see that the SSD’s internal queue parallelism, together with the RAID setup, yields a great level of request parallelism (Disk-wise differences in EC2 instances were discussed in detail by us here.) However, even in such a good instance, there is a point in which an increase in latency won’t translate to an increase in throughput anymore.
Looking at the graph above, and together with what we have discussed in the previous sections, it becomes clear that just allowing requests to sit at the disk level won’t do us any good, and may even severely hurt us. Summing it all up, aside from the increased latency, which we can’t really help, those requests will lead to iowait times at the Linux block layer level due to excess outstanding requests, at the filesystem level, due to the fact that metadata writes will stall, or even worse: both.
We circle back now hoping that is clear that in order to avoid that and at the same time provide for functionality like request prioritization, we should limit the amount of requests that we throw at the disk, and queue them ourselves.
Looking at the graph at Figure 2, one has a good idea on what this number should be for this particular setup. For any other given setup, the diskplorer tool can be used to generate a similar graph.
However, since finding the right point through this method is both error-prone and time-consuming (diskplorer can take ages to collect all points). ScyllaDB (and Seastar) now ships with scylla_io_setup (a wrapper around Seastar’s iotune) tool, that helps users find out what the recommended threshold is and configure the I/O scheduler properly. That number will then be used as the --max-io-requests parameter for Seastar, indicating what is the maximum number of concurrent disk I/O requests we will allow.
For users of Amazon AMIs provided by ScyllaDB, those values are already preloaded to sane configurations and there is no need to run the tool.
Limiting the disk parallelism in practice
To demonstrate how ScyllaDB can use its I/O Scheduler, we have run a small experiment on an EC2 c3.8xlarge instance. Please note that we don’t recommend this machine as explained in our blog post about it, but in order to demonstrate ScyllaDB’s behavior with slow disks, it comes in handy.
In this test, two ScyllaDB c3.8xlarge instances are ran at the same time. In each run we have one constrained and one unconstrained node. The unconstrained node doesn’t apply any I/O queue settings, while for the constrained node, we apply:
--num-io-queues 8 --max-nr-requests 32
Two clients then connect to each independently and at the same time and push requests for 10 minutes, each running the following script on c4.4xlarge machines.
#!/bin/bash
SERVERS=$1
IDX=$2
N=50000000
POP_BEGIN=$(($IDX*$N+1))
POP_END=$((($IDX+1)*$N))

taskset -c 1-15 cassandra-stress write duration=10m \
-pop seq=$POP_BEGIN..$POP_END -mode native cql3 \
-node $SERVERS -rate threads=500
Note that from the CPU point of view, this is not enough to saturate the server. We have disabled the commitlog in both, in order to isolate the sources of I/O and simplify the analysis, so all disk activity is due to memtable writes and compaction (so we can have some reads in the mix as well). The behavior of multiple I/O originators is the subject of our next post.
Figure 3 shows the node’s response in terms of CQL ops/second and their correlation with the system’s iowait and Seastar’s pending I/O, which is the number of requests sitting in the internal queue waiting for their turn to be dispatched to the kernel. As we have mentioned in our previous article about EC2 instance performance, the performance of an instance can vary a lot even among instances of the same class. To isolate those effects and prevent this from skewing the results, we invert the instances placement during both runs. In the first run the node ScyllaDB-1 (in blue) is constrained (has I/O Scheduler parameters applied) while ScyllaDB-2 (in green) is unconstrained (no I/O Scheduler parameters applied), and in the second run, ScyllaDB-1 (blue) is unconstrained while ScyllaDB-2 (green) is constrained.
Even in such simple scenario, those instances will find a bottleneck in the disk. The total bandwidth is at the peak of what these instances can do and when compactions start we see in the CQL ops/second graph in Figure 3 the overall throughput dropping.
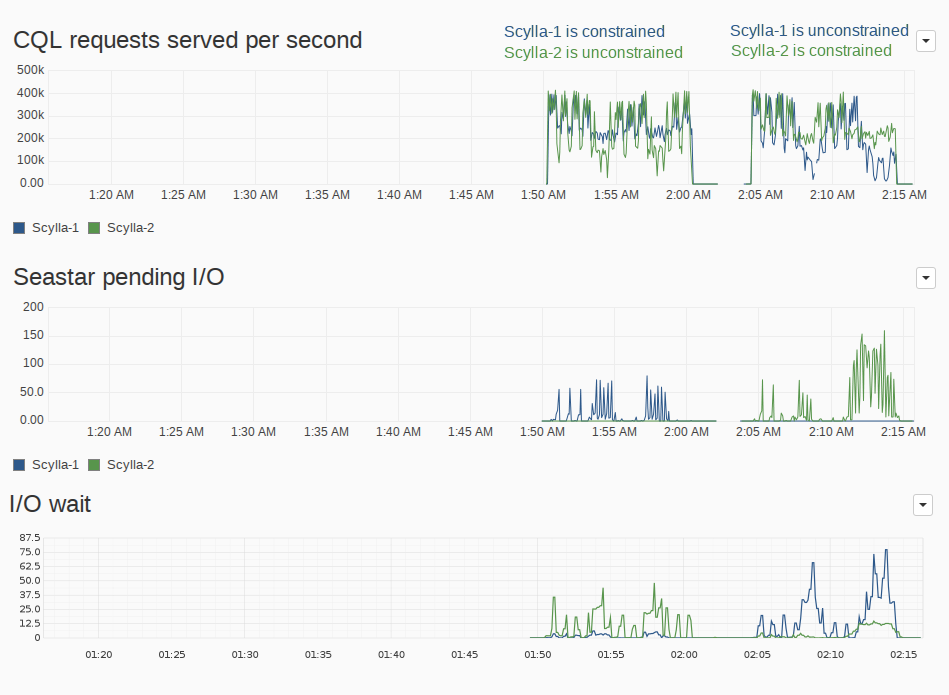
Figure 3: Seastar pending I/O operations and system’s iowait time. Note how we are basically shifting the latter to the former, by having the requests wait inside ScyllaDB.
In the unconstrained instances, Figure 3 shows us that the huge drops in throughput translate into iowait time. It’s hard from these figures alone to determine where the requests are stuck: if in the filesystem, the block layer, or the disk itself. But in a way or another, they are. Avoiding waiting times is the kind of goal we have in mind when designing a thread-per-core, shared-nothing architecture, and for the constrained runs, we see in Figure 3 that most of that I/O time is translated into Seastar pending I/O. In a threaded model, another thread could take the CPU during iowait. But besides the context switch penalties that the thread-per-core model aims to avoid, the block layer would still be overloaded and operating less efficiently.
That means that the requests are now sitting in a queue inside ScyllaDB, waiting for some to finish before we can dispatch more. Because of that, the drops in throughput are not as big as the unconstrained case, since the CPU is able to keep pushing work instead of just waiting.
It is also interesting to look at final latency peak figures for both clients in each run. They don’t change much up until the 95th percentile, but for the tail, the effects can be clearly seen in the tables below.
For the unrestricted node, this load produces the following figures (all measurements in microseconds)
| Run1 Client1 | Run1 Client2 | Run2 Client1 | Run2 Client2 | |
| latency 99th percentile | 21.0 | 20.2 | 29.1 | 28.8 |
| latency 99.9th percentile | 44.8 | 39.7 | 115.3 | 104.2 |
| latency max | 509.7 | 512.1 | 743.9 | 819.4 |
While the restricted node similarly produces:
| Run1 Client1 | Run1 Client2 | Run2 Client1 | Run2 Client2 | |
| latency 99th percentile | 13.1 | 11.6 | 16.7 | 16.6 |
| latency 99.9th percentile | 26.1 | 23.6 | 50.4 | 46.8 |
| latency max | 478.5 | 529.8 | 607.7 | 608.9 |
By employing a userspace Disk I/O Scheduler we have reduced the 99th percentile latency by 42%, the 99.9th percentile latency by up to 55%, and the max latency by up to 25%. It is hard to completely eliminate iowait times, especially in noisy environments like Amazon EC2. But in all cases the I/O Scheduler can greatly reduce it, which translates immediately into better performance and lower latencies.
Stay tuned!
In the second installment of this article, we will explain the internal design of our I/O Scheduler, and how it is used to solve the problem we have talked about in the first place: providing fairness guarantees among our multiple users.
Follow @ScyllaDB on Twitter or subscribe to this site’s RSS feed to keep up with future development.