We built a new DynamoDB cost analyzer that helps developers understand what their workloads will really cost
DynamoDB costs can blindside you. Teams regularly face “bill shock”: that sinking feeling when you look at a shockingly high bill and realize that you haven’t paid enough attention to your usage, especially with on-demand pricing. Provisioned capacity brings a different risk: performance. If you can’t accurately predict capacity or your math is off, requests get throttled. It’s a delicate balancing act.
Although AWS offers a DynamoDB pricing calculator, it often misses the nuances of real-world workloads (e.g., bursty traffic or uneven access patterns, or using global tables or caching).
We wanted something better. In full transparency, we wanted something better to help the teams considering ScyllaDB as a DynamoDB alternative. So we built a new DynamoDB cost calculator that helps developers understand what their workloads will really cost. Although we designed it for teams comparing DynamoDB with ScyllaDB, we believe it’s useful for anyone looking to more accurately estimate their DynamoDB costs, for any reason. You can see the live version at: calculator.scylladb.com

How We Built It
We wanted to build something that would work client side, without the need for any server components. It’s a simple JavaScript single page application that we currently host on GitHub pages. If you want to check out the source code, feel free to take a look at https://github.com/scylladb/calculator
To be honest, working with the examples at https://calculator.aws/ was a bit of a nightmare, and when you “show calculations,” you get these walls of text:
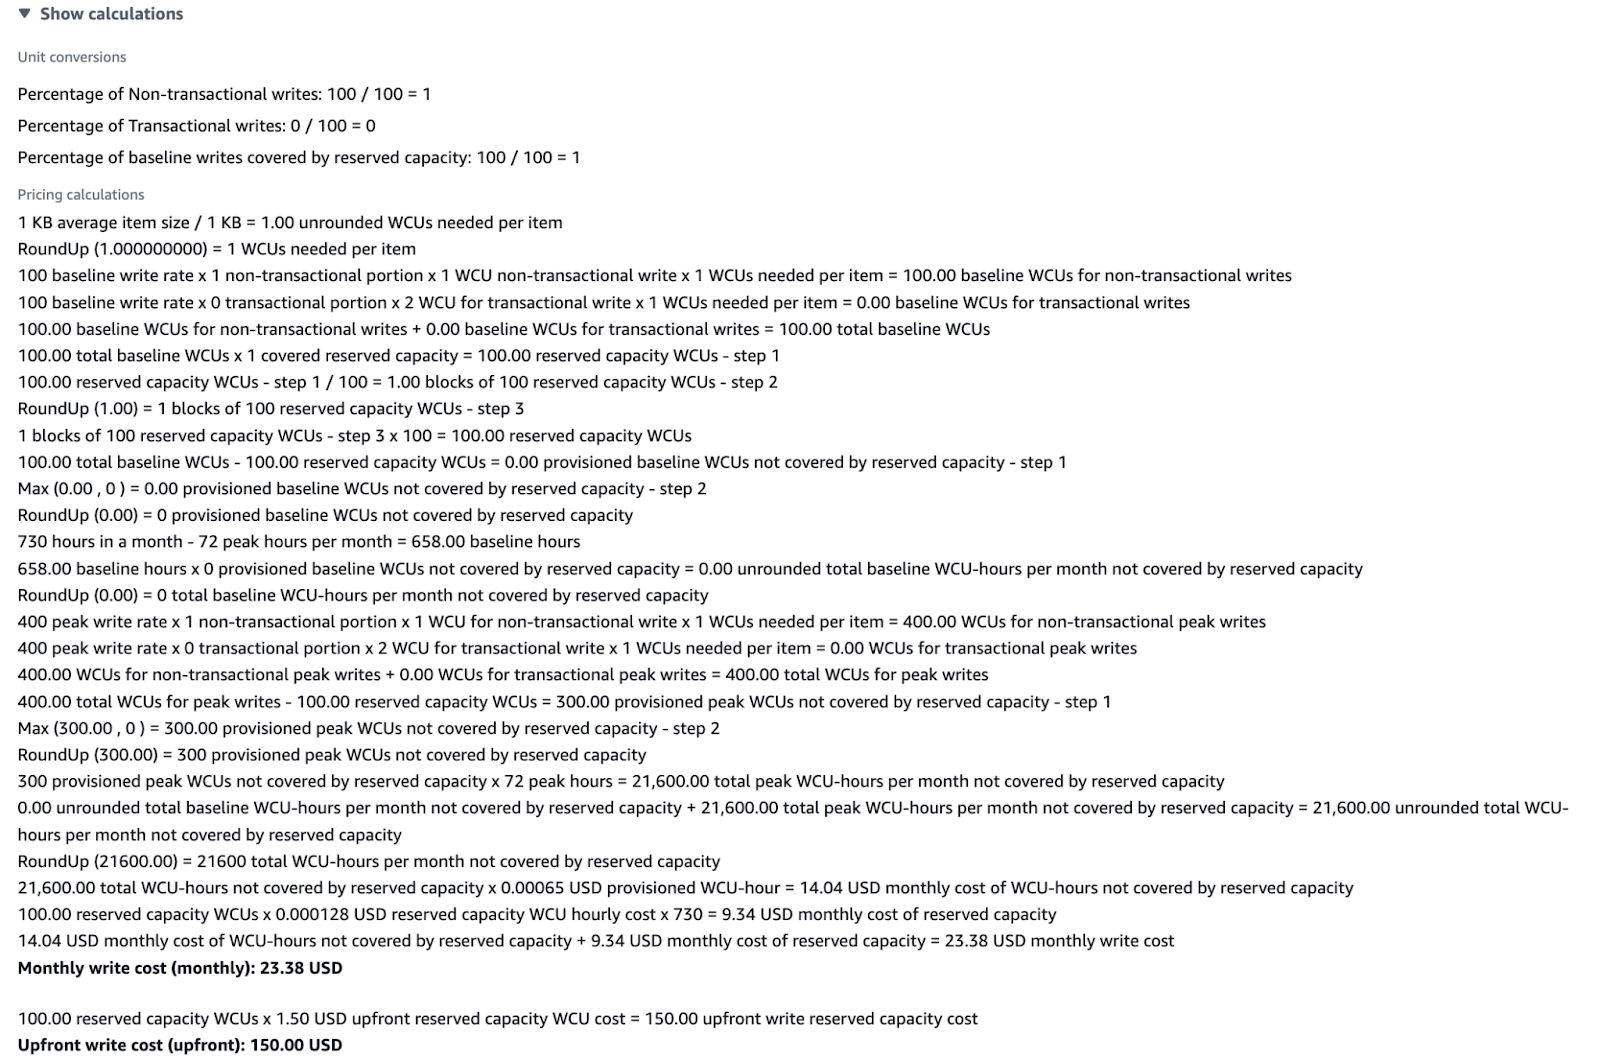
I was tempted to take a shorter approach, like:
Monthly WCU Cost = WCUs × Price_per_WCU_per_hour × 730 hours/month
But every time I simplified this, I found it harder to get parity between what I calculated and the final price in AWS’s calculation. Sometimes the difference was due to rounding, other times it was due to the mixture of reserved + provision capacity, and so on. So to make it easier (for me) to debug, I faithfully followed their calculations line by line and tried to replicate this in my own rather ugly function: https://github.com/scylladb/calculator/blob/main/src/calculator.js
I may still refactor this into smaller functions. But for now, I wanted to get parity between theirs and ours. You’ll see that there are also some end-to-end tests for these calculations — I use those to test for a bunch of different configurations. I will probably expand on these in time as well.
So that gets the job done for On Demand, Provisioned (and Reserved) capacity models.
If you’ve used AWS’s calculator, you know that you can’t specify things like a peak (or peak width) in On Demand. I’m not sure about their reasoning. I decided it would be easier for users to specify both the baseline and peak for reads and writes (respectively) in On Demand, much like Provisioned capacity.
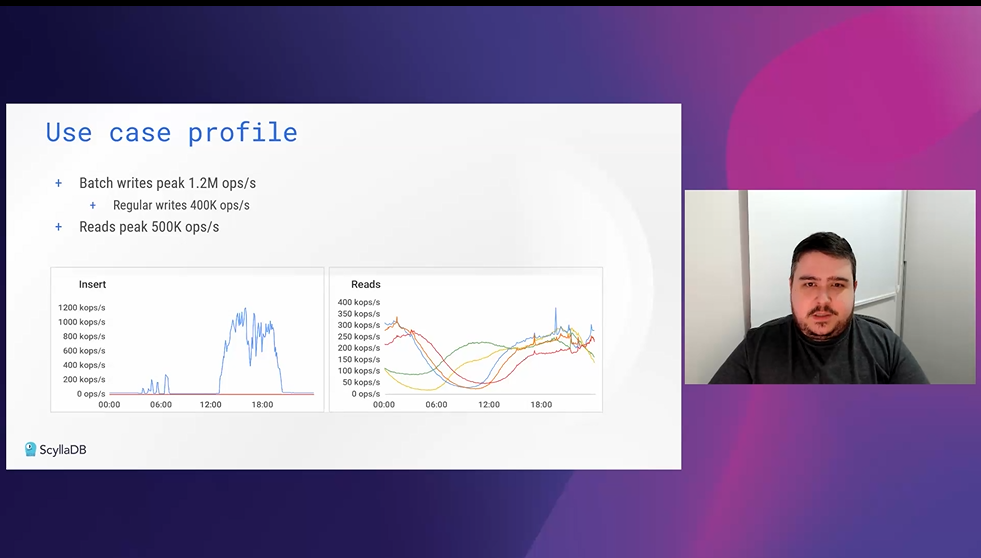
Another design decision was to represent the traffic using a chart. I do better with visuals, so seeing the peaks and troughs makes it easier for me to understand – and I hope it does for you as well.
You’ll also notice that as you change the inputs, the URL query parameters change to reflect those inputs. That’s designed to make it easier to share and reference specific variations of costs.
There’s some other math in there, like figuring out the true cost of Global Tables and understanding derived costs of things like network transfer or DynamoDB Accelerator (DAX). However, explaining all that is a bit too dense for this format. We’ll talk more about that in an upcoming webinar (see the next section).
The good news is that you can estimate these costs in addition to your workload, as they can be big cost multipliers when planning out your usage of DynamoDB.
Explore “what if” scenarios for your own workloads
Analyzing Costs in Real-World Scenarios
The ultimate goal of all this tinkering and tuning is to help you explore various “what-if” scenarios from a DynamoDB cost perspective. To get started, we’re sharing the cost impacts of some of the more interesting DynamoDB user scenarios we’ve come across at ScyllaDB.
My colleague Gui and I just got together for a deep dive into how factors like traffic surges, multi-datacenter expansion, and the introduction of caching (e.g., DAX) impact DynamoDB costs. We explored how a few (anonymized) teams we work with ended up blindsided by their DynamoDB bills and the various options they considered for getting costs back under control.
Watch the DynamoDB costs chat now