ScyllaDB powers real-time AI with low latency, high throughput, and billion-scale data.
Learn MoreAWS Benchmarks – or comparable low-end hardware – conducted by engineers at both ScyllaDB and third parties have demonstrated that ScyllaDB outperforms Apache Cassandra better than 10x.
These NoSQL database performance advantages stem from ScyllaDB’s modern hardware-friendly and ultra-scalable architecture. As a result, ScyllaDB’s performance grows as the hardware size grows.
Scaling both up and out offers many advantages: from simplified cluster management to access to generally better hardware and economies of scale.
However, many users have compelling reasons to stay on low-end hardware, even if temporarily. It’s then reasonable to ask: How does ScyllaDB fare against Apache Cassandra in such scenarios?
We’ll show in this report that while ScyllaDB’s performance edge over Apache Cassandra is lower than more powerful hardware would provide, ScyllaDB keeps outperforming Apache Cassandra in a wide range of scenarios even when low-end hardware – such as AWS c3.2xlarge – imposes itself as a bottleneck (see Table 1).
| Test | Apache Cassandra 3.0.9 | ScyllaDB 1.6.1 | Difference | Better is: |
| Time to populate | 5h 21m 29s | 4h 27m 19s | 20% | lower |
| Time to compact | 7h 32m | 21m | 21x | lower |
| Total quiesce time (populate and compact) | 12h 43m | 4h 48m | 2.68x | lower |
Read throughput (small dataset) | 51,267 reads/second | 124,958 reads/second | 2.43x | higher |
Read throughput (medium dataset) | 7,363 reads/second | 6,958 reads/second | -5% | higher |
Read throughput (large dataset) | 5,089 reads/second | 5,592 reads/second | 9.8% | higher |
| Reads during writes | 547 reads/second | 920 reads/second | 68% | higher |
99.9th latency (at 5,000 writes/second) | 130.3 milliseconds | 11.9 milliseconds | 10.9x | lower |
99.9th latency (at 10,000 writes/second) | 153.3 milliseconds | 16.9 milliseconds | 9.0x | lower |
99.9th latency (at 20,000 writes/second) | 199 milliseconds | 20.3 milliseconds | 9.8x | lower |
99.9th latency (at 30,000 writes/second) | 217.1 milliseconds | 27.5 milliseconds | 7.9x | lower |
Table 1: Summary of results obtained for all tests conducted in this benchmark
For all tests, each cluster consists of three server instances and clients querying a table set with a replication factor of tnree, and consistency level of QUORUM.To provide readers with a fair assessment of ScyllaDB performance on low-end hardware under various scenarios, we divided this test into four different phases, executed in the following order:
We ran both Apache Cassandra and ScyllaDB on Amazon EC2, using c3.2xlarge machines. These machines have eight vCPUs placed on four physical cores and 16 GB of memory. That is a configuration that can easily be described as “laptop specs.” All instances of the c3 class, including c3.2xlarge, have two local SSDs attached. Using the local SSDs in a RAID array is our recommendation on EC2 machines where local SSDs are available.
However, we do acknowledge that there are valid uses for EBS. Because the goal of this benchmark is to demonstrate ScyllaDB’s behavior in low-end hardware, we will use the local SSDs in a RAID array for the commit log only, while keeping the data volume in an attached GP2 EBS volume, 3.4 TB in size. The choice of size is so that the volumes achieve the maximum IOPS per volume of 10k IOPS.
We have used a single volume to match conditions we often see in the field. For production deployments using EBS, we recommend using as many disks as possible in a RAID configuration, up to the 65k IOPS per-instance maximum that AWS advertises.
Loaders: 3 x m4.2xlarge (8 vCPUs) writing to a disjoint set. In this phase we write 810,774,192 unique partitions separated equally over the three loaders and measure the time each cluster takes to complete it. Table 2 summarizes the results (lower is better), including high-percentile latencies. The times reported for both population and quiesce is the time when the last client finishes, and the latency reported is the highest of the three loaders for each percentile during data ingestion.
| Apache Cassandra | ScyllaDB | ||||||
| Population time | Total time to quiesce | Population time | Total time to quiesce | ||||
| 19,289 seconds | 46,409 seconds | 16,039 seconds | 17,299 seconds | ||||
| Apache Cassandra | ScyllaDB | ||||||
| lat 95th | lat 99th | lat 99.9th | lat max | lat 95th | lat 99th | lat 99.9th | lat max |
| 166.1 | 299.4 | 440.5 | 1089.5 | 71.8 | 85.9 | 114.7 | 860.4 |
Table 2: Apache Cassandra and ScyllaDB’s population phase. Latency (ms) during ingestion reported is higher of each of the 3 clients at each percentile
Apache Cassandra takes 20% more time than ScyllaDB to insert the data. However, note that Apache Cassandra has a setting that limits the compaction throughput so that it doesn’t influence write workloads, which is set to the default value of 16.
ScyllaDB has no such option and auto-tunes itself using its Workload Conditioning techniques to make sure a compaction backlog, which is undesirable for reads, is not created. So ScyllaDB is faster even when compactions are running at full speed.
Because of that, after the population phase is done ScyllaDB finishes all remaining compactions in around 21 minutes. The same task in Apache Cassandra takes around 7 hours 32 minutes. As Apache Cassandra throttles its compactions, a massive backlog is created, hurting concurrent reads, and hampering Apache Cassandra’s ability to compact faster during idle periods without human intervention.
To reflect that, we’ll report the “Total time to quiesce”, defined as the time between the population phase start and the time where all activity ceases. We will show in the “reads during writes” phase how a growing compaction backlog has a very real impact in performance.
The graph in Figure 1 shows a plot of cluster throughput (yellow) versus aggregate number of active compactions over time (green). The plot is generated by ScyllaDB’s monitoring stack. As the load finishes, compactions are already far ahead on their way to completion.
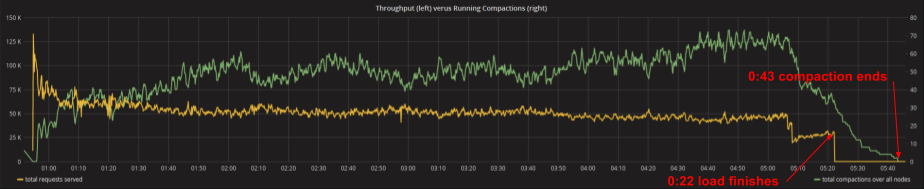
Figure 1: ScyllaDB finishes all pending compactions 21 minutes after the load finishes
In comparison, Figure 2 shows the AWS monitoring panel for the Apache Cassandra nodes. During and after the ingestion period, users would face a massive compaction backlog.
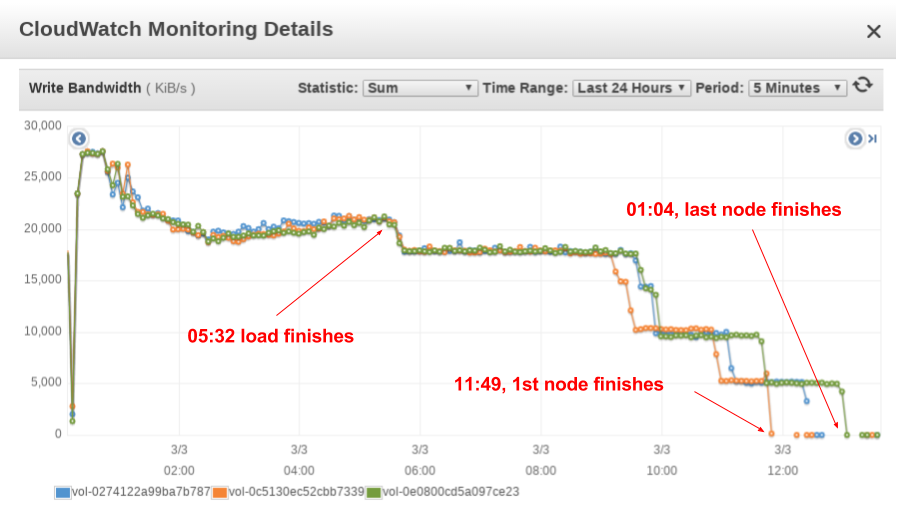
Figure 2: Apache Cassandra finishes all pending compactions 7h32m after the load finishes
We believe that the amount of tuning involved in a typical Apache Cassandra cluster operation is way too large and makes it hard to adapt to changing circumstances. That factor is the drive behind our continuous work to make ScyllaDB self-tuning. Still, for fairness, after all the tests were done we executed the ingestion test for Apache Cassandra again, this time disabling compaction throttling (Apache Cassandra was stopped, data were removed, and caches were dropped).
Figure 3 shows the results we obtained. Apache Cassandra is able to take advantage of being idle now, with an initial burst that very likely already merged a lot of sstables for the first size tier into larger ones, which will greatly help reads. Still, that takes two hours. The total compaction time gets reduced by 25% to six hours, a far cry from ScyllaDB’s 21-minute compaction.
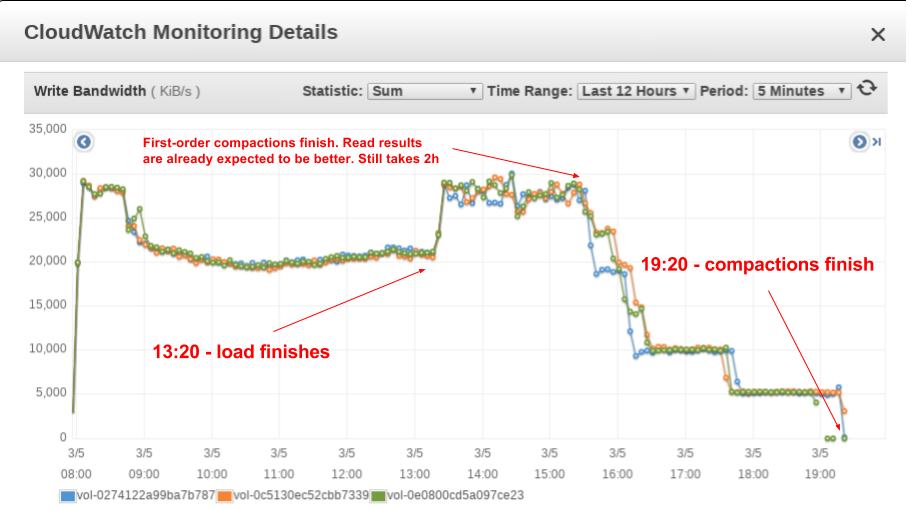
Figure 3: Apache Cassandra gets better if compactions are unthrottled, with the total time to compact all data being reduced to 6 hours, from the previous 7h32m
Loaders: 3 x m4.2xlarge (8 vCPUs) randomly reading partitions
All three phases in the read test were done after both Apache Cassandra and ScyllaDB finishes their compactions.
For the small dataset read phase we queried the partitions according to a Gaussian distribution centered at the mean with stdev=10k partitions. The goal is to demonstrate the performance of Apache Cassandra and ScyllaDB serving a dataset that is highly likely to fit in memory. The small number of cores will be a limiting factor, but EBS will not. After an initial warm-up, this workload will not use the disk at all, and will run for 20 minutes.
For the medium-size dataset read phase, we will query randomly according to a gaussian distribution centered at the mean with stdev=100M. This dataset size is chosen to be at least twice as big as the memory size, but it is small enough so that cache locality considerations will come into play. This phase will run for 60 minutes.
For the large dataset read phase, we will query randomly according to a uniform distribution spanning the whole range of keys. This dataset should reduce locality considerations of cache to a minimum and stress the EBS volumes to its maximum. This phase will run for 60 minutes.
ScyllaDB’s throughput in the small dataset is 2.5 times higher than Apache Cassandra’s.
In the medium and large dataset tests, EBS is the limiting factor for both ScyllaDB and Apache Cassandra, and the disk throughput stays at its 10k IOPS peak during the whole test. The results in this situation are less conclusive, with ScyllaDB performing 9.8% better than Apache Cassandra for uniform reads over the entire dataset, and Apache Cassandra performing 5% better than ScyllaDB for Gaussian reads.
The similarity of the disk-bound results is expected from a situation in which hardware is a bottleneck, but it does show some opportunities for improvement in ScyllaDB that we are already working to resolve. However, one needs to keep in mind that this test was done with the cluster quiet, after all compaction work was done. We believe a more realistic scenario involves reading concurrently to writes. That will be done in the “reads during writes” phase.
Loaders: 1 x m4.2xlarge (8 vCPUs) writing at a fixed rate
In the previous tests, we focused on the throughput the system can achieve. However, most real-life systems operate at or close to a steady rate and will try to stay away from their maximum capacity. It is then interesting to focus on the latency of requests at a steady rate.
We ran a single loader, rate limited at 5k, 10k, 20k and 30k writes/second respectively. All of these are below the maximum throughput of both ScyllaDB and Apache Cassandra, as observed during population. Each run lasted for 30 minutes. We executed nodetool flush between each run. After the flush, the system was allowed to quiesce before the next run started.
Table 3 summarizes the results. ScyllaDB is clearly ahead, providing latencies up to 10 times better than Apache Cassandra at high percentiles. That’s easy to see in both Figure 4, which shows the mean latencies for all throughput tested and Figure 5, which shows the 99.9th percentile.
Note: The mean is measured in microseconds; the other measurements are in milliseconds.
| Apache Cassandra | ScyllaDB | |||||||||
| mean | 95th | 99th | 99.9th | max | mean | 95th | 99th | 99.9th | max | |
| 5k | 2.6 | 1.7 | 8.8 | 130 | 689.1 | 0.7 | 0.7 | 2.9 | 11.9 | 216.3 |
| 10k | 3.6 | 2.3 | 40.7 | 153.3 | 374 | 1.1 | 3 | 10.5 | 16.7 | 402.5 |
| 20k | 7.7 | 13.3 | 107 | 199 | 495 | 2.2 | 7.9 | 13.8 | 20.3 | 202.5 |
| 30k | 13.4 | 26.8 | 134.5 | 217.1 | 450.8 | 5 | 13.7 | 20.1 | 27.5 | 204.5 |
Table 3: Latency percentiles (ms) at a fixed throughput.
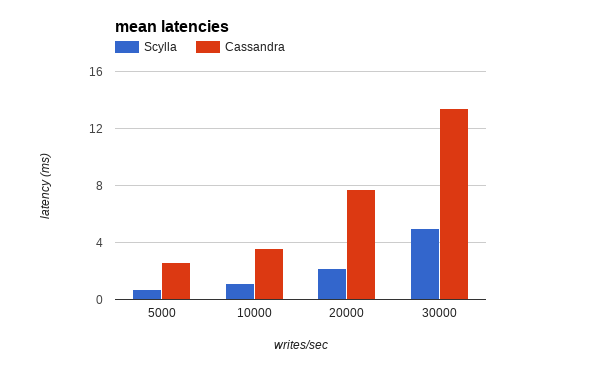
Figure 4: Mean latencies in ScyllaDB versus Apache Cassandra
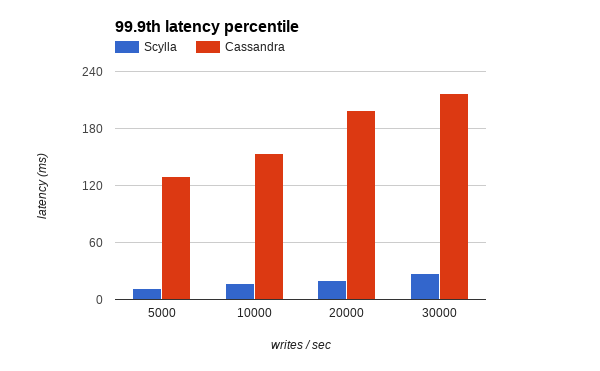
Figure 5: 99.9th percentile latencies for ScyllaDB and Apache Cassandra
Loaders: 2 x m4.2xlarge (8 vCPUs) split into one writer, one reader.
As we noted in the population phase, even at a lower rate of writes, Apache Cassandra can’t keep up with compactions, taking 7h32m to fully compact after the load finishes, far more than ScyllaDB’s 21 minutes.
As users running real workloads know, this result is much more than a benchmarking artifact. Not being able to compact fast enough impairs the cluster’s ability to serve reads and is particularly harmful for read latencies.
To assess the impact a compaction backlog has in a concurrent read workload, we have loaded each cluster with a constant rate of 30k writes/second for a period of four hours. The writes focus on a specific subset of the population range (10M keys), and the rate is determined based on the results of the population phase to be challenging enough for the clusters to handle, without saturating them.
After roughly three hours (1000 seconds), we fire a latency-oriented, workload from another loader, using only 40 threads. The reads, however, are random and spread throughout the whole range, forcing them to be served from the disk.
The results of this test appear in Table 4:
| Apache Cassandra | ScyllaDB | Difference | |
| Throughput | 547 reads/second | 920 reads/second | 68 % |
| latency mean | 10.7 milliseconds | 10.9 milliseconds | -1.83 % |
| latency 95th | 30.8 milliseconds | 23.9 milliseconds | 28.9 % |
| latency 99th | 130.5 milliseconds | 31.2 milliseconds | 4.2 x |
| latency 99.9th | 250.5 milliseconds | 42.9 milliseconds | 5.8 x |
| latency max | 5711.3 milliseconds | 517 milliseconds | 11 x |
Table 4: Apache Cassandra versus ScyllaDB reading during write load.
In this situation, ScyllaDB can serve the reads 68% faster than Apache Cassandra with much improved tail latencies. Looking at nodetool cfhistograms can help us understand part of the reason why. One of the servers shows, at 99% Apache Cassandra is reading from 20 SSTables while ScyllaDB is reading from only 6. At max, Apache Cassandra reads from 29 SStables while ScyllaDB reads from 14.
Apache Cassandra:
keyspace1/standard1 histograms
Percentile SSTables Write Latency Read Latency Partition Size Cell Count
 (micros) (micros) (bytes)
50% 1.00 20.50 3379.39 258 5
75% 1.00 20.50 5839.59 258 5
95% 3.00 35.43 14530.76 258 5
98% 4.00 42.51 25109.16 258 5
99% 20.00 42.51 43388.63 258 5
Min 1.00 3.97 126.94 180 5
Max 29.00 268650.95 268650.95 258
ScyllaDB:
keyspace1/standard1 histograms
Percentile SSTables Write Latency Read Latency Partition Size Cell Count
 (micros) (micros) (bytes)
50% 1.00 14.00 1597.00 310 5
75% 1.00 14.00 8239.00 310 5
95% 3.00 24.00 14237.00 310 5
98% 4.00 29.00 17084.00 310 5
99% 6.00 35.00 20501.00 310 5
Min 0.00 3.00 21.00 259 5
Max 14.00 152321.00 219342.00 310 5
Note that because we are only writing to a subset of the data, the problem is pushed to the higher percentiles; data that is read from outside that range should be resolved by one SSTable only, assuming the Bloom Filters work well (they usually do). For larger datasets involving many rewrites, it’s easy to see that ScyllaDB’s advantage would increase.
Writing to the entire range multiple times would take this test too long, so we capped it. But this situation happens routinely in many real deployments.
While it is true that ScyllaDB shines the brightest when executed on high-end server hardware, this benchmark demonstrates that the ScyllaDB advantage over Apache Cassandra is not restricted to high-end environments.
Hardware is becoming cheaper and bigger. We believe that users will benefit from easier maintenance and fewer failures with fewer, larger nodes. However, ScyllaDB consistently outperforms Apache Cassandra even in situations with constrained resources.
At peak throughput, ScyllaDB is able to handle data ingestion faster than Apache Cassandra, and it does so at lower high percentile latencies without creating a compaction backlog or requiring manual tuning of compaction rates. When compared at an equivalent rate lower than the point of saturation, ScyllaDB is able to maintain latencies that are more consistent and up to 10 times lower than Apache Cassandra for the 99.9th percentile.
In the absence of competing writes, reading from memory in ScyllaDB is 2.5 times faster than Apache Cassandra, while reading datasets entirely from disk will provide similar results for both databases. However, for many workloads this is an unrealistic scenario, as reads happen while data is being ingested. When that’s the case, ScyllaDB’s ability to compact data faster puts ScyllaDB ahead by 68% even if the workload is served from the disk.
For this test, we tested DataStax Community Edition, based on Apache Cassandra 3.0.9. We configured the Cassandra VMs in accordance with the official Datastax guide, optmizing for SSDs.
Also in accordance with that guide, we set the JVM Garbage collector to G1GC. because the document doesn’t specify the exact G1GC settings, we picked the following:
-XX:+UseG1GC
-XX:G1RSetUpdatingPauseTimePercent=5
-XX:MaxGCPauseMillis=500
-XX:InitiatingHeapOccupancyPercent=70
-XX:ParallelGCThreads=8
-XX:ConcGCThreads=8
Also, we made changes to the Cassandra yaml file; some based on the comments present in the file while others based on Al Tobey’s guide to Cassandra tuning. Although the guide is written with Apache Cassandra 2.1 in mind, we found the changes to be still relevant.
A summary of the changes follow:
memtable_allocation_type: offheap_buffers
trickle_fsync: true
concurrent_reads: 16
concurrent_writes: 64
concurrent_counter_writes: 16
disk_optimization_strategy: ssd
concurrent_compactors: 8
For this benchmark, we used the official ScyllaDB 1.6.1 AMI. We made no changes to the ScyllaDB configuration file because ScyllaDB is supposed to automatically adapt to changing circumstances.
However, two automatic configuration issues affecting c3.2xlarge exclusively failed to be made to ScyllaDB and had to be manually adjusted. We are working to fix this issue as we strive to provide a setup-free experience across all kinds of hardware.
Users of c3.2xlarge can bypass these issues by applying the following changes:
# adjust the correct cpuset for ScyllaDB
echo CPUSET=\"--cpuset 1-7\" | sudo tee /etc/scylla.d/cpuset.conf
# manually configure ScyllaDB’s networking
sudo sh /usr/lib/scylla/posix_net_conf.sh -sq
# prevent the wrong network configuration to be applied on ScyllaDB’s startup.
sudo sed -i "s/SET_NIC=yes/SET_NIC=no/" /etc/sysconfig/scylla-server
In addition to those changes, the official ScyllaDB 1.6.1 [does not recognize attached EBS devices](20](https://github.com/scylladb/scylla-ami/issues/20), and will create a RAID array with all available devices at /var/lib/scylla. We manually undid that and then mounted the EBS device at the data location, and a RAID array with the local SSDs at the commitlog location.
Here’s a list of all stress commands used at each phase. Shown below are the ScyllaDB versions. Apache Cassandra differs on IP addresses and log file names only.
cassandra-stress write n=270258064 cl=QUORUM -schema "replication(factor=3)" -mode native cql3 -pop seq=540516129..810774192 \
-node 172.30.0.205,184.72.116.251,172.30.0.228 \
 -rate threads=800 -log file=ScyllaDBreplica3mar22017.data
cassandra-stress write n=270258064 cl=QUORUM -schema "replication(factor=3)" -mode native cql3 -pop seq=270258065..540516128 \
-node 172.30.0.205,184.72.116.251,172.30.0.228 \
-rate threads=800 -log file=ScyllaDBreplica3mar22017.data
cassandra-stress write n=270258064 cl=QUORUM -schema "replication(factor=3)" -mode native cql3 -pop seq=1..270258064 \
-node 172.30.0.205,184.72.116.251,172.30.0.228 \
-rate threads=800 -log file=ScyllaDBreplica3mar22017.data
cassandra-stress write duration=30m cl=QUORUM -schema "replication(factor=3)" -mode native cql3 -pop seq=1..810774192 \
 -node 172.30.0.205,184.72.116.251,172.30.0.228 \
 -rate threads=800 limit=5000/s\
 -log file=testlim5k_ScyllaDBC32xlMar22017.data
cassandra-stress write duration=30m cl=QUORUM -schema "replication(factor=3)" -mode native cql3 -pop seq=1..810774192 \
 -node 172.30.0.205,184.72.116.251,172.30.0.228 \
 -rate threads=800 limit=10000/s\
 -log file=testlim10k_ScyllaDBC32xlMar22017.data
cassandra-stress write duration=30m cl=QUORUM -schema "replication(factor=3)" -mode native cql3 -pop seq=1..810774192 \
 -node 172.30.0.205,184.72.116.251,172.30.0.228 \
 -rate threads=800 limit=20000/s\
 -log file=testlim20k_ScyllaDBC32xlMar22017.data
cassandra-stress write duration=30m cl=QUORUM -schema "replication(factor=3)" -mode native cql3 -pop seq=1..810774192 \
 -node 172.30.0.205,184.72.116.251,172.30.0.228 \
 -rate threads=800 limit=30000/s\
 -log file=testlim30k_ScyllaDBC32xlMar22017.data
cassandra-stress read duration=20m cl=QUORUM -mode native cql3 -pop dist=gaussian\(1..810774192,405387096,10000\) \
 -node 172.30.0.205,184.72.116.251,172.30.0.228 \
 -rate threads=400 \
 -log file=testreadsmall_ScyllaDB_C32xlMar22017.data
cassandra-stress read duration=60m cl=QUORUM -mode native cql3 -pop dist=uniform\(1..810774192\) \
 -node 172.30.0.205,184.72.116.251,172.30.0.228 \
 -rate threads=400 \
 -log file=testreadlarge_ScyllaDB_C32xlMar22017.data
cassandra-stress read duration=60m cl=QUORUM -mode native cql3 -pop dist=gaussian\(1..810774192,405387096,100000000\) \
 -node 172.30.0.205,184.72.116.251,172.30.0.228 \
 -rate threads=400 \
 -log file=testreadmedium_ScyllaDB_C32xlMar22017.data
cassandra-stress read duration=60m no-warmup cl=QUORUM -mode native cql3 -pop dist=uniform\(1..810774192\) \
-node 172.30.0.205,184.72.116.251,172.30.0.228 \
 -rate threads=10 -log file=testmixed_read.data
cassandra-stress write duration=4h cl=QUORUM -schema "replication(factor=3)" -mode native cql3 -pop seq=1..10000000\
-node 172.30.0.205,184.72.116.251,172.30.0.228 \
 -rate threads=800 limit=30000/s\
 -log file=testmixed_write30k.data
The complete list, together with the raw results achieved by each loader can be found here.


