ScyllaDB powers real-time AI with low latency, high throughput, and billion-scale data.
Learn MoreIn this evaluation, we did our best to define a workload that reflects conditions users will encounter in AWS i3 production deployments. Based on those workloads, we leveraged our familiarity with user deployments to select the optimal machine types per database to make the AWS i3 performance benchmarks as realistic and as practical as possible.
These benchmark results provide a throughput and latency comparison of ScyllaDB Open Source version 2.2 release vs. Cassandra 3.11 release. The results obtained from extensive testing show how ScyllaDB outperforms Cassandra at 99% and 99.9% latency, smoothing out Cassandra’s more egregious latency spikes. Plus, condensing the cluster size from 40 nodes to only four makes database system management far more efficient and cost-effective.
ScyllaDB is unique among NoSQL databases in its ability to fully leverage powerful modern hardware. Its shared-nothing, lock-free and shard-per-core architecture allows ScyllaDB to scale up with hardware resources: cores, RAM and I/O devices. AWS EC2’s strongest instance available, i3.metal, is the perfect choice for our ScyllaDB cluster.
Cassandra, in contrast, is limited in its ability to scale up due to its reliance on the Java virtual machine (JVM). The JVM prevents Cassandra from interacting directly with server hardware. Its threads and locks are heavy, and they actually slow down as the core count grows. In the absence of NUMA awareness, performance suffers. As a result, using the AWS i3.metal instance would not yield optimal results for Cassandra and will be a waste of money as a chosen machine type. To make the comparison fair, we selected AWS i3.4xlarge instances for Cassandra which are 4 times smaller than i3.metal but also 4 times cheaper.
The following workload was defined for each test:
The load generator, cassandra-stress, was used to populate each database using the default cassandra-stress schema. Once population and compaction completed, the service was restarted on all nodes, ensuring that the tests ran against a cold cache and with all compactions complete. Each test ran for 90 minutes to ensure a steady state.
To achieve SLAs against this i3 benchmark with Cassandra, we calculated that a 40-node cluster, running on i3.4xlarge instances, would be required. As you can read further, this setup did not meet the SLA for most workloads and, ultimately, a larger cluster was required.
| ScyllaDB Cluster | Cassandra Cluster | |
| EC2 Instance type | i3.Metal (36 physical cores| 512 GiB RAM) | i3.4xlarge (8 physical cores | 122 GiB RAM) |
| Storage (ephemeral disks) | 8 NVMe drives, each 1900GB | 2 NVMe drives, each 1900GB |
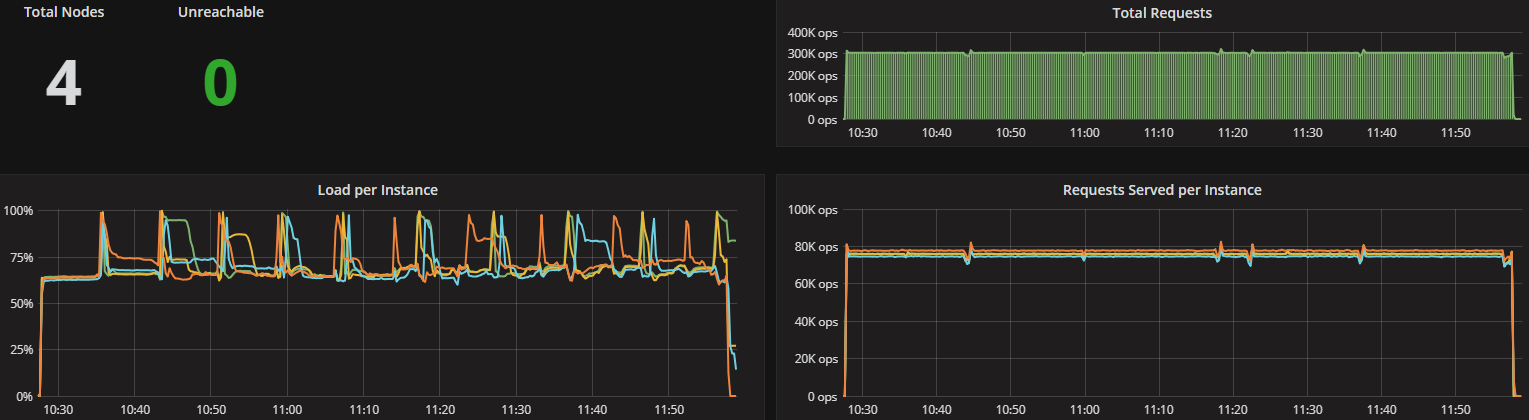
| Cluster size | 4-node cluster on single DC | 40-node cluster on single DC |
| Total CPU and RAM | CPU count: 288 | RAM size: 2TB | CPU count: 640 | RAM size: ~4.76TB |
| DB SW version | ScyllaDB Open Source version 2.2 | Cassandra 3.11.2 (OpenJDK build 1.8.0_171-b10) |
| Latency tests | 7 x i3.8xlarge (up to 10Gb network) 14 cassandra-stress clients, 2 per instance | 8 x i3.8xlarge (up to 10Gb network) 16 cassandra-stress clients, 2 per instance |
Cassandra requires detailed tuning to achieve optimal results. For these tests, tuning settings were derived from the official Datastax guide to Cassandra tuning. We invite readers to suggest other tuning settings that might produce an alternative perspective on the relative performance characteristics of these two databases.
Originally we applied the changes listed below only to the cassandra.yaml and the jvm options files — that yielded poor performance results. After applying the IO tuning setting, Cassandra started performing much better. Yet despite multiple attempts using various amounts of cassandra-stress clients and threads per client, we could not get more than 30K operations per second throughput.
| cassandra.yaml | buffer_pool_use_heap_if_exhausted: true | ||
| jvm.options |
| ||
| IO tuning | echo 1 > /sys/block/md0/queue/nomerges |
In contrast to Cassandra, ScyllaDB dynamically tunes itself for optimal performance. No specific optimizations were required.
Latency tests strive to stress disk access. To achieve this, each database was populated with a large dataset of around 11TB, consisting of 38.85B partitions using the default cassandra-stress schema, where each partition size was ~310 bytes. A replication factor of 3 was used. Each Cassandra node holds a data set that is 5.5 times bigger than its RAM, whereas each ScyllaDB node holds 16.25 times the data size of RAM.
The total storage used by Cassandra is smaller than in ScyllaDB due to the Cassandra 3.0 file format utilized in Cassandra 3.11. (As a side note, ScyllaDB 3.0, planned for Q4 2018 release, will provide native support for the newer file format natively)
| ScyllaDB | Cassandra | |
| Total used storage | ~32.5 TB | ~27 TB |
| /dev/md0 (Avg.) | ~8.18 TB / node | ~692 GB / node |
| Data size / RAM ratio | ~16.25 : 1 | ~5.5 : 1 |
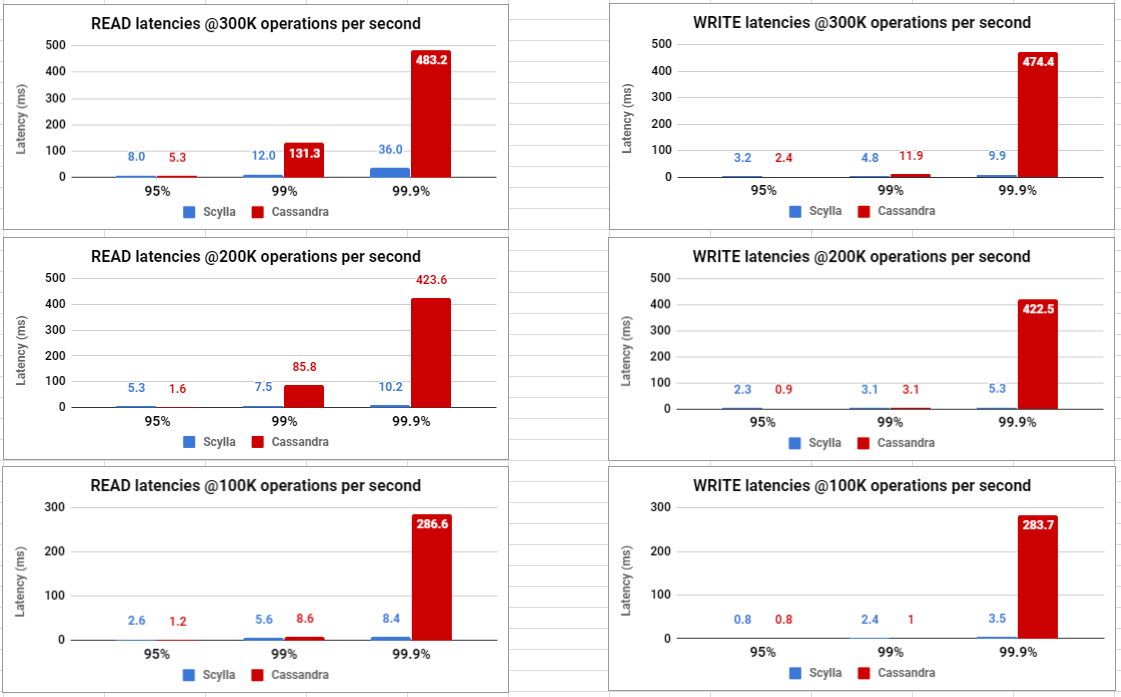
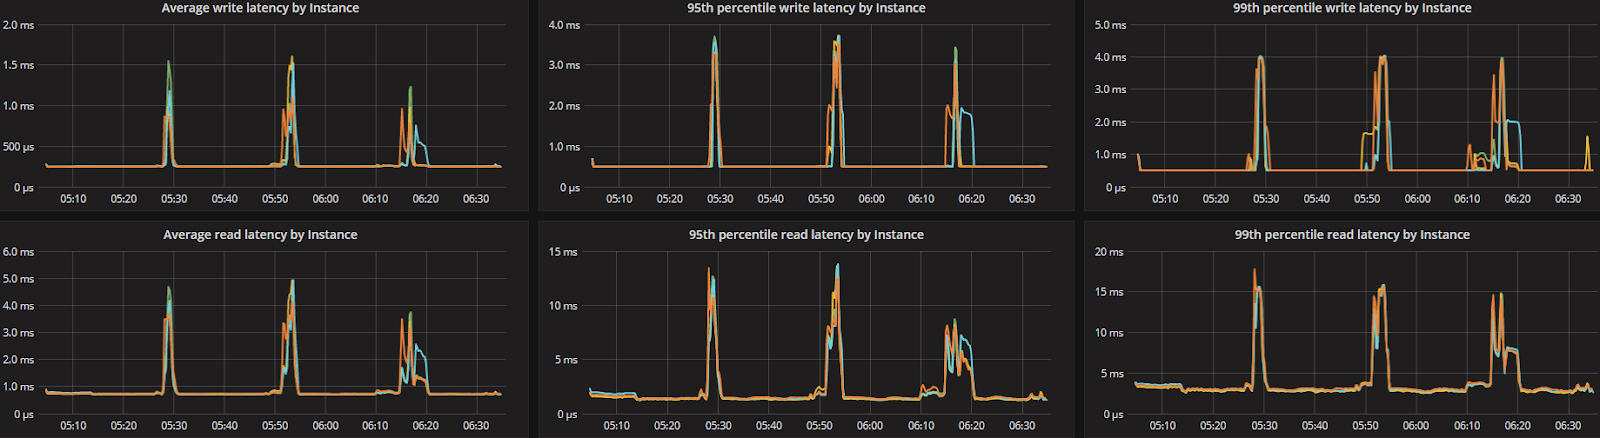
The following table summarizes the results for each latency test.
| cassandra-stress Workloads | ScyllaDB Open Source version 2.2 (4-nodes x i3.Metal) | Cassandra 3.11 (40-nodes x i3.4xlarge) |
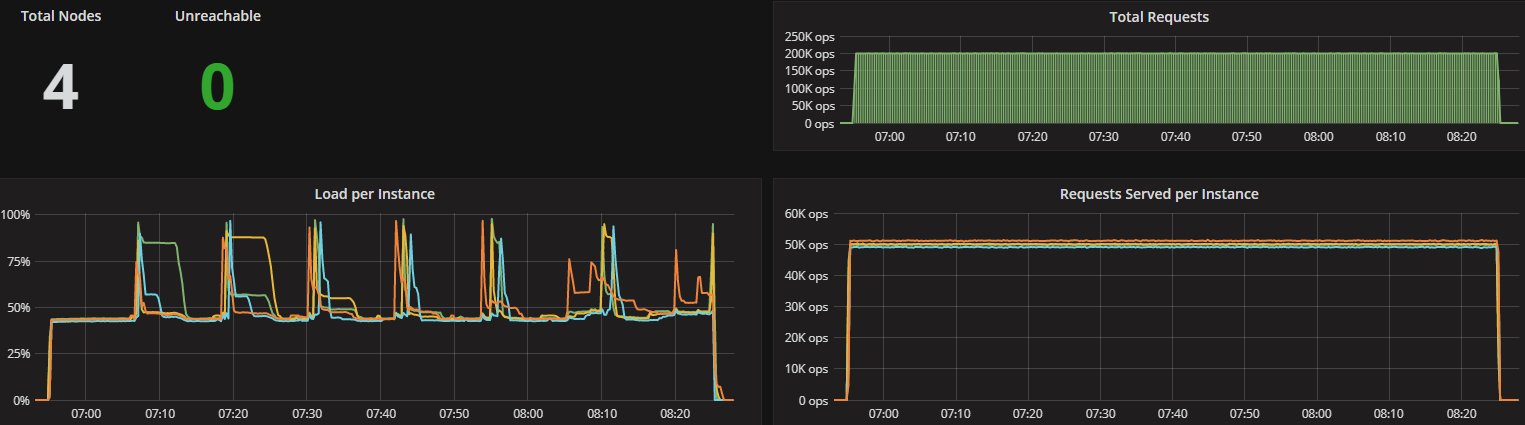
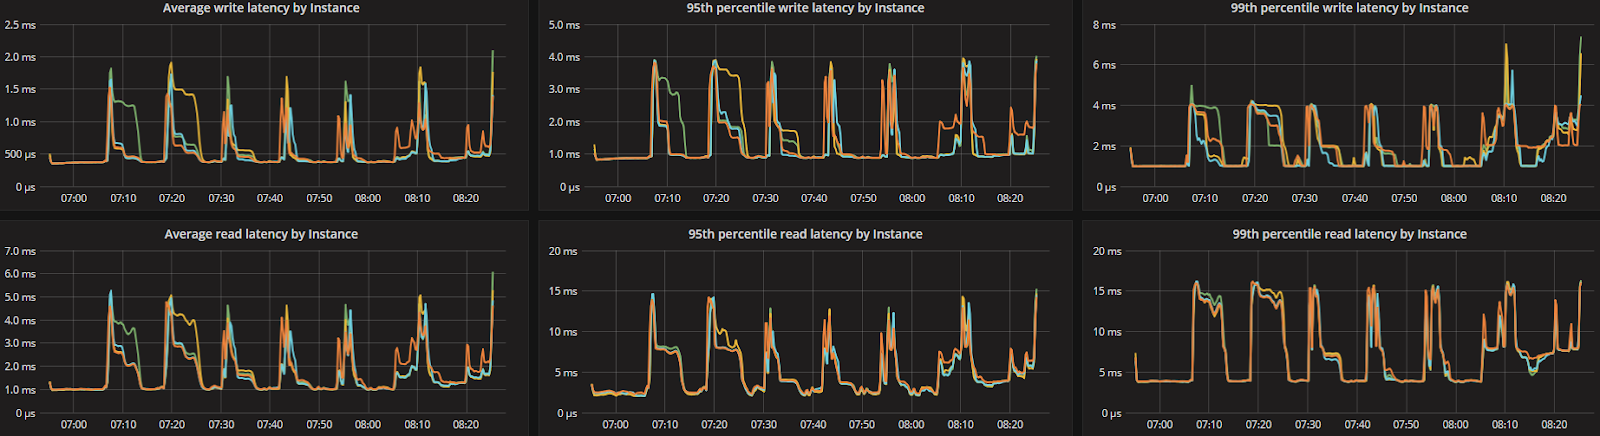
Latency Test (300K) Workload A (CL=Q) Range: Distribution: gaussian\ Duration: 90 min. | Overall Throughput (ops/sec): ~304K Avg Load (scylla-server): ~70% ————————————————————————- READ partitions (Avg.): ~58.62M Avg. 95% Latency (ms): 8.0 Avg. 99% Latency (ms): 12.0 Avg. 99.9% Latency (ms): 36.0 ————————————————————————- UPDATE partitions (Avg.): ~58.62M Avg. 95% Latency (ms): 3.2 Avg. 99% Latency (ms): 4.8 Avg. 99.9% Latency (ms): 9.9 * 14 x i3.8xlarge used as loaders (10gb network) | Overall Throughput (ops/sec): ~306K Avg Load: ~50% ————————————————————————- READ partitions (Avg.): ~51.61M Avg. 95% Latency (ms): 5.3 Avg. 99% Latency (ms): 131.3 Avg. 99.9% Latency (ms): 483.2 ————————————————————————- UPDATE partitions (Avg.): ~51.61M Avg. 95% Latency (ms): 2.4 Avg. 99% Latency (ms): 11.9 Avg. 99.9% Latency (ms): 474.4 * 16 x i3.8xlarge used as loaders (10gb network) |
Latency Test (200K) Workload A (CL=Q) Range: Distribution: gaussian\ Duration: 90 min. | Overall Throughput (ops/sec): ~200K Avg Load (scylla-server): ~50% ————————————————————————- READ partitions (Avg.): ~38.58M Avg. 95% Latency (ms): 5.3 Avg. 99% Latency (ms): 7.5 Avg. 99.9% Latency (ms): 10.2 ————————————————————————- UPDATE partitions (Avg.): ~38.58M Avg. 95% Latency (ms): 2.3 Avg. 99% Latency (ms): 3.1 Avg. 99.9% Latency (ms): 5.3 * 14 x i3.8xlarge used as loaders (10gb network) | Overall Throughput (ops/sec): ~200K Avg Load: ~35% ————————————————————————- READ partitions (Avg.): ~33.87M Avg. 95% Latency (ms): 1.6 Avg. 99% Latency (ms): 85.8 Avg. 99.9% Latency (ms): 423.6 ————————————————————————- UPDATE partitions (Avg.): ~33.87M Avg. 95% Latency (ms): 0.9 Avg. 99% Latency (ms): 3.1 Avg. 99.9% Latency (ms): 422.5 * 16 x i3.8xlarge used as loaders (10gb network) |
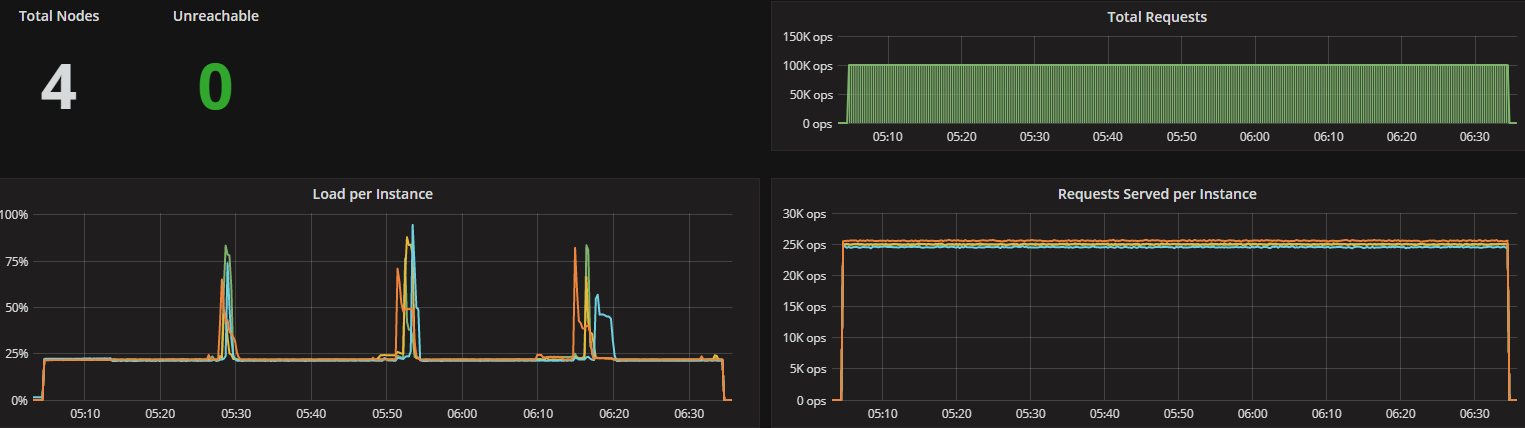
Latency Test (100K) Workload A (CL=Q) Range: Distribution: gaussian\ Duration: 90 min. | Overall Throughput (ops/sec): ~100K Avg Load (scylla-server): ~25% ————————————————————————- READ partitions (Avg.): ~19.29M Avg. 95% Latency (ms): 2.6 Avg. 99% Latency (ms): 5.6 Avg. 99.9% Latency (ms): 8.4 ————————————————————————- UPDATE partitions (Avg.): ~19.29M Avg. 95% Latency (ms): 0.8 Avg. 99% Latency (ms): 2.4 Avg. 99.9% Latency (ms): 3.5 * 14 x i3.8xlarge used as loaders (10gb network) | Overall Throughput (ops/sec): ~100K Avg Load: ~18% ————————————————————————- READ partitions (Avg.): ~16.88M Avg. 95% Latency (ms): 1.2 Avg. 99% Latency (ms): 8.6 Avg. 99.9% Latency (ms): 286.6 ————————————————————————- UPDATE partitions (Avg.): ~16.88M Avg. 95% Latency (ms): 0.8 Avg. 99% Latency (ms): 1.0 Avg. 99.9% Latency (ms): 283.7 * 16 x i3.8xlarge used as loaders (10gb network) |
Compared to the 40-node Cassandra cluster, the ScyllaDB 4-node cluster provided:
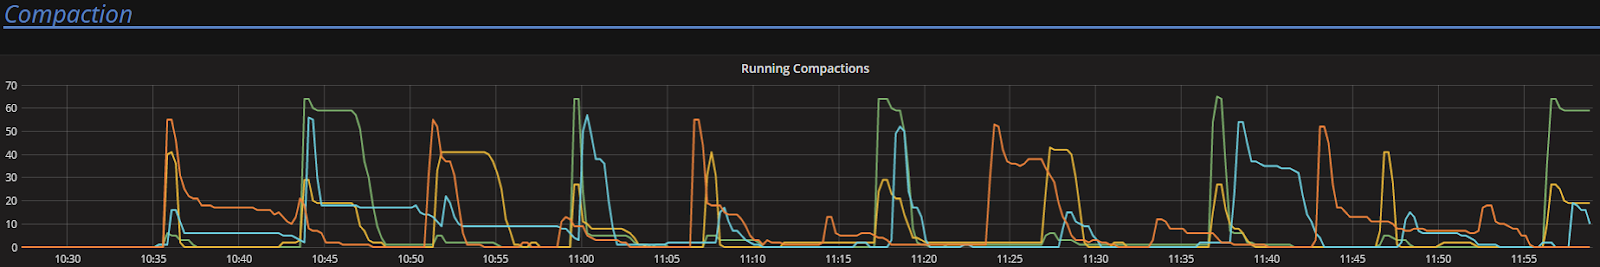
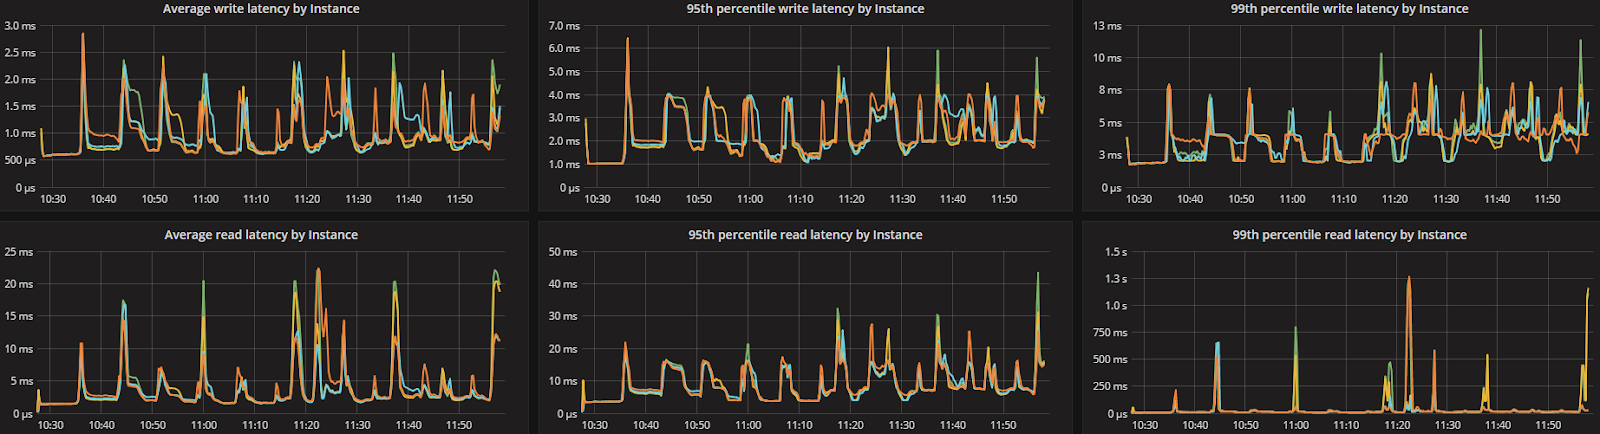
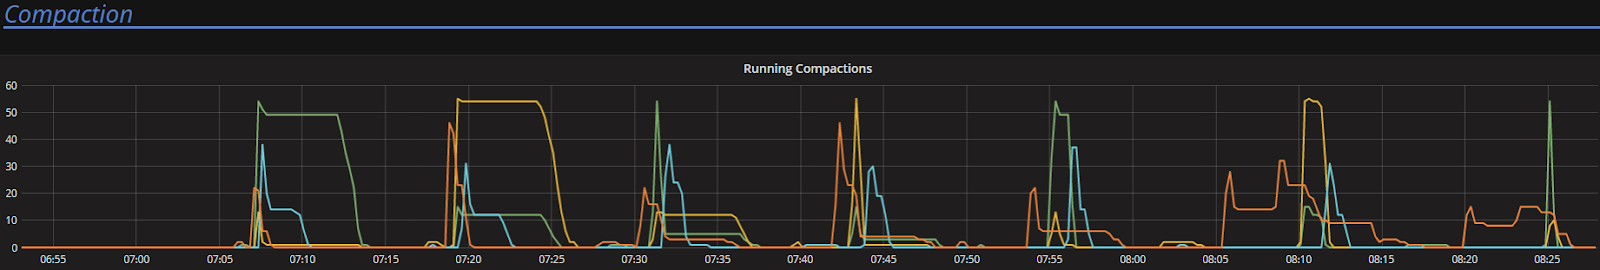
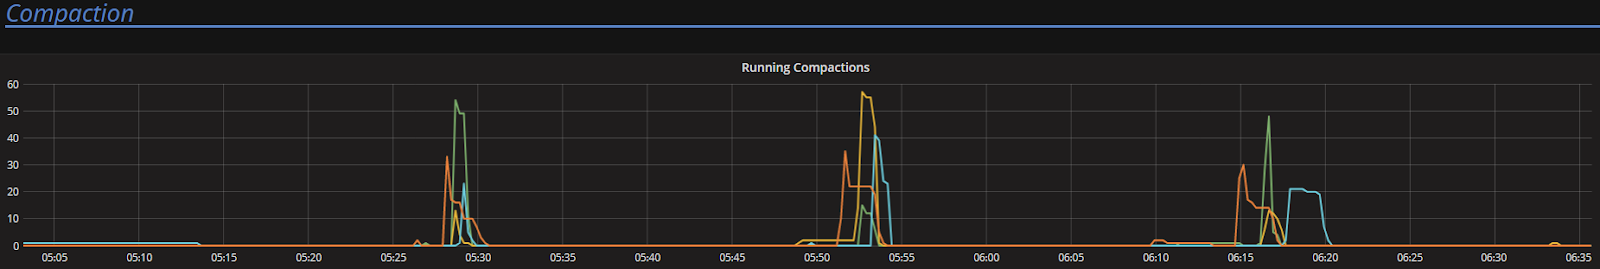
ScyllaDB version 2.2 introduces several new capabilities, including the Compaction Controller for the Size Tiered Compaction Strategy (STCS). This new controller provides ScyllaDB with an understanding of just how much CPU shares it can allocate for compactions. In all the tested workloads (300K OPS, 200K OPS, and 100K OPS) the incoming traffic load on the CPU-reactor was on average 70%, 50%, and 25% respectively. The compaction controller understands if there are enough unused/free CPU shares to be allocated for compactions. This enables ScyllaDB to complete the compactions in a fast and aggressive manner while ensuring that the foreground load is maintained and the throughput is unaffected. The spikes you see in the CPU-reactor graph in each of the workloads correspond exactly to compaction jobs execution, as can be seen, the in the compaction graph.
When the workload is bigger (300K OPS), SSTables are created faster and more frequent compactions are needed, which is why we see more frequent CPU-reactor spikes to 100%.
When the workload is smaller (100K OPS), SSTables are created more slowly and compactions are needed less frequently, resulting in very few CPU-reactor spikes during that run.
The hardware failure rate is a function of the node. While theoretically SSD manufacturers cite Mean Time Between Failure (MTBF) of a million or more hours, a reliable rate we received from one of the three large vendors is that, in production, failures of SSD drives occur in roughly two years. We can make these factors more empirical by performing a calculation drawn from reliability and failure analysis, specifically the Probability of Concurrent Double Failures (PCDF). The more nodes a cluster has, the chances for a single failure and even a double failure increase. Both ScyllaDB and Cassandra can cope with node loss when the replication factor is 3 and quorum is needed. However, in the event of a subsequent fault, the range of data will not be accessible for a quorum consistency level requirement until replacement nodes are installed and remaining replicas stream the data into the new nodes.
With this in mind, we can compare the PCDF for Cassandra versus ScyllaDB, as tested in this AWS i3 performance benchmark using the following formula:
PCDF = NC * (MTTR/MTBF)^2 * DIY
Where:
The results show that ScyllaDB provides significantly lower PCDF than Cassandra, along with a commensurate reduction in the overhead of downtime and manual intervention:
Cassandra’s PCDF = 40 * ( 1/730)^2*365 = 2.7% for a double error
ScyllaDB’s PCDF = 4 * ( 1/730)^2*365 = 0.27% for a double error
To conclude, we can put these performance numbers into the larger context of total cost of ownership (TCO). As we have shown, in terms of platform provisioning, ScyllaDB’s TCO is 2.5x better than Cassandra TCO.
Additionally, there is a huge difference in latency at the upper percentiles. Had we been trying to achieve the same latency, the ROI would have at least doubled, to 5x or more.
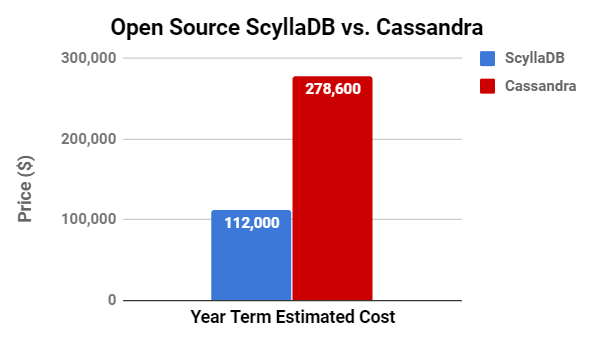
| ScyllaDB Open Source version 2.2 | Cassandra 3.11 |
Year term estimated cost: ~$112K
| Year term estimated cost: ~$278.6K
|
nohup cassandra-stress write no-warmup n=4856250000 cl=one -mode native cql3 -node [IPs] -rate threads=200 -log file=[log_file] -pop seq=1..4856250000 & nohup taskset -c 1-15 cassandra-stress mixed ratio\(write=1,read=1\) no-warmup duration=90m cl=quorum -pop dist=gaussian\(1..38850000000,19425000000,6475000000\) -mode native cql3 -node [IPs] -log file=[log_file] -rate threads=200 limit=7142/s | 14285/s | 21650/s &(300K | 200K | 100K Ops)nohup taskset -c 17-31 cassandra-stress mixed ratio\(write=1,read=1\) no-warmup duration=90m cl=quorum -pop dist=gaussian\(1..38850000000,19425000000,6475000000\) -mode native cql3 -node [IPs] -log file=[log_file] -rate threads=200 limit=21650/s | 14285/s | 7142/s & (300K | 200K | 100K Ops)nohup cassandra-stress write n=2428125000 cl=one -mode native cql3 -node [IPs] -rate threads=200 -log file=[log file] -pop seq=0..2428125000 &nohup cassandra-stress mixed ratio\(write=1,read=1\) no-warmup duration=90m cl=quorum -pop dist=gaussian\(1..38850000000,19425000000,6475000000\) -mode native cql3 -node [IPs] -log file=[log_file] -rate threads=200 limit=19000/s | 12500/s | 6250/s & (300K | 200K | 100K Ops)


