ScyllaDB 2.0’s New Feature in-depth: Heat Weighted Load Balancing
With time, a ScyllaDB cluster adapts to an application’s behavior. Given a steady read-mostly workload, after an initial warm-up period, all nodes will have their caches populated with a working set, and the workload will see a certain cache hit rate and enjoy a certain performance level (throughput and latency).
In this post, we consider what happens if one of the nodes loses its cache. This is not an uncommon event: It happens, for example, during rolling upgrades when individual nodes are rebooted while the entire cluster remains operational and expected to continue to perform well. But as we shall show below, balancing the work naively among the nodes can result in overloading of the cold nodes (those with empty caches) and degraded performance of the entire cluster – especially noticeable as increased latency. In addition to understanding the problem, we will also present a solution – heat-weighted load balancing, a new feature of ScyllaDB 2.0.
To make a long story short, heat-weighted load balancing gives cold nodes less work. But the devil is in the details: Exactly how much work should we give each node? How do we do this when a consistency level greater than one requires giving work to more than one node? How can we rebalance the load after the token-aware driver already divides the requests evenly between coordinator nodes? And how do we rebalance this load without overwhelming the network with forwarded requests? We will survey very briefly some of these details and then present experimental results which demonstrate that heat-weighted load balancing achieves its goal of keeping the latency low even when a node is rebooted.
Seeing the problem
So let’s start by looking at what happens to a cluster’s performance today without heat-weighted load balancing when one of the nodes restarts with an empty cache. We set up a three-node cluster with data and a certain read workload with the consistency level set to QUORUM. Let’s take a look in Graphana and observe the results.
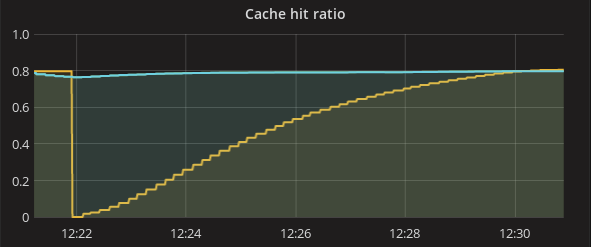
If we look the cache hit ratio (cache hits per request) on all three nodes, all of them start around 0.8 until one of the nodes (shown by the yellow line) restarts and has a cache hit ratio of 0. The cache hit ratio will then begins to gradually increase as requests continue to arrive at the cold node and warm up its cache. About 10 minutes later, the cold node’s caches fill up just as they were before the reboot.
So far, so good. We start seeing hints of a problem when all of the nodes serve the same amount of reads whether they have a high or low hit ratio. As a result, we see the following graph comparing the number of cache misses per second in the restarted node (yellow line) and old nodes (blue line):

Looking at this graph, we can see that the restarted node (yellow) has a huge amount of cache misses compared to other nodes. These cache misses all involve disk I/O. This immediately affects the median read latency as seen from the next graph.

Here we see a very small initial latency increase when a node goes down (see the vertical line labeled “down”). This happens because the remaining two nodes in the cluster have to handle the same load as before. But when the node goes up again (vertical line labeled “up”), latency jumps to twice of its previous value. While we saw a two-fold increase of mean latency in this particular test, the situation can be much worse for tail latency. Also, if a cluster works at the brink of its I/O ability, reads may start to timeout.
Before we present a solution, let’s look at what actually happens under the hood, and how the load is (inappropriately) balanced today before heat-weighted load balancing.
Given reads with CL=QUORUM, a coordinator has the task of selecting two replicas out of three to redirect reads. Usually, a coordinator is also a replica for the requested data (if the token-aware policy is used in the driver) and it will choose itself and some other random node to send reads to. We can see this by comparing the following two graphs. The number of read requests that a coordinator performs locally (“coordinator local reads” – the first graph) and the number of read requests that a coordinator sends to another node (“coordinator remote reads”) are equal all the time:


Moreover, all the nodes do this exactly the same – the yellow line (cold node) and blue and green line (hot nodes) coincide in each of the two graphs. Both types of nodes make the same naive decision on how to distribute the requests they get. In particular, the cold node (yellow line) performs half the work locally (local reads = remote reads) despite knowing that it is overworked. It could have benefitted by doing less work locally, and sending more work to the other two nodes which are what we plan to do in the solution below.
Our solution: Heat-weighted load balancing
As we saw above, different replicas can have a different cache hit ratios. One replica might even be a newly-rebooted node with an almost empty cache and a very low cache hit ratio (a so-called “cold cache”). In this case, dividing read requests equally between the replicas results in the cold-cache node receiving more work than it can handle. This results in lower throughput and increased latency. When a coordinator chooses the replicas to send requests to, it should send fewer requests to the replica with the colder cache. But how much fewer?
It is important to note that the answer is not to completely avoid sending requests to the slower cold node (as Cassandra’s “dynamic snitch” might do). If we do do that, the cold node’s cache will forever remain cold and this node will never be used for read requests.
The reason for the cold node becoming overloaded is that it is getting a lot of cache misses due to its cold cache. Each of those requests requires disk operations and the number that a node can do per second is limited. We will, therefore, approximate the load on each node as the number of cache misses it experiences per second. Our goal is to send requests to each node at a different rate calculated to achieve the same cache miss rate on all nodes. For example, if one node has a colder cache with twice the miss rate (misses/requests) as a second node, we should send the first node half the requests we send to the second node so that the cache miss rate will be the same on both.
In general, if we have N (the replication factor, a.k.a RF) different replicas with hit rates (hits/requests) Hi, with a little algebra it can be shown that the share of requests that we need to send to node i is

The client could have used these probabilities Pi randomly pick a replica or several replicas to send requests to. However, we now have an additional complication because the Cassandra driver does not give the client this level of control. Instead, the client sends the request to a coordinator which is one of the replicas holding the required token. The coordinator is picked by the client at random, uniformly. This coordinator is then responsible to forward the request to one or more replicas, possibly working itself on some of these requests.
One might think that the coordinator should simply use the Pi which we calculated above to randomly decide which node to forward the request to. This would be correct but results in excessive network use. Consider the simplest case where all Pi are equal, 1/N (this happens when all replicas have the same miss rates). Yes, we could have a coordinator forward each request to one of the other replicas with equal probabilities but it would be more efficient to ask the coordinator to perform all the requests it receives locally. The end result will be the same distribution of work with all replicas getting an equal amount of work, but with much less network traffic.
As a generalization of this insight, in each coordinator i, we take the original set of probabilities Pi and modify them to calculate a new set of probabilities Qij that coordinator i should forward a request to replica j. The goals of this modification are:
- All the requests received by the coordinator i must be forwarded to some replica
- With the new probabilities, each replica j should receive exactly the same total number of requests as it did before:

(remember that originally we had N coordinators each sending P j to replica j). - The coordinator should minimize network usage by keeping to itself as many of the requests it is allowed to. If NPi < 1, then the coordinator can only run that number of requests locally (since as we explained above NPi was the amount of work that this node is supposed to do) and needs to and forward the surplus requests to other nodes. On the other hand, if NPi > 1, the coordinator needs to run more requests than it received so it will run all requests locally and will still have a deficit (other nodes need to send it more requests).

It can be proved (and we did, but the margin is too small for the proof) that the above requirements always have a solution: the amount of surplus and deficit described above is equal and there is a simple algorithm to determine how to divide the surplus requests to the nodes with deficits.
Unfortunately, there is one more significant complication to this algorithm. Above we considered an algorithm for the coordinator to pick one replica (the coordinator itself, as much as possible, or one of the others). However, when the desired consistency level CL is more than 1, each request needs to be sent to CL different replicas. Here “different” is the keyword: Even if a coordinator prefers (as we discussed above) to perform most of the requests it receives locally without forwarding them over the network, it will not be able to; It can perform the request at most once locally and then needs to forward the request to at least CL-1 other replicas.
Figuring out the correct forwarding probabilities Qij for this case is significantly more involved. We now have “mixed” nodes which have both surplus requests (have no choice but to forward at least CL-1 requests to other replicas each time) and deficits (the one request the coordinator keeps locally is not enough and it needs other nodes to send us more). Fortunately, we developed an algorithm for solving this case and it is already implemented in ScyllaDB.
After we finally calculate the probabilities Qij that coordinator i should forward a request to replica j, there is still one remaining issue to tackle: How do we draw random subsets of CL different replicas out of the N, which will result in the individual replicas being sent the desired share of the work? The straightforward way to do this taught at schools and provided by various math libraries is this: Pick one item at random using the given probabilities and remove its probability from the list and renormalizing the rest of the probabilities, then going onto pick the next item.
But interestingly, this method is wrong! The items it produces are not actually distributed at the desired probabilities and this was clear in our experiments. Some of the nodes got slightly more requests than we had wanted to send them while other nodes got slightly less. So we had to use a different and somewhat more esoteric sampling technique known as “systematic sampling” which correctly samples combinations of C replicas and reproduces the desired per-replica probabilities exactly.
It is worth noting that when we need to pick CL>1 different replicas, none of the replicas can ever get more than 1/CL of the total work. This means that in some extreme cases, we cannot achieve the desired probabilities. For example, consider a case where we have 3 replicas and CL=2 (so every request needs to be sent to two replicas), one of the replicas is hot with a 90% cache hit ratio but the two other replicas are recently rebooted and have a very low 1% cache hit ratio. We would want the vast majority of the work to be sent to the one hot replica but we can’t. Every time we send one request to the hot replica, we must (because CL=2) send a second copy of this request to one of the other (cold) replicas. So we end up with the hot node receiving only twice the amount of work than the cold nodes.
Our probability calculation code knows that it cannot achieve probabilities higher than 1/CL and “truncates” the probabilities achieving as good as a solution as theoretically possible in this case. In the more usual case where just one node reboots and has an unusually low cache hit ratio, the calculated probabilities are lower than 1/CL anyway, so this truncation is not reached typically.
Heat-weighted load balancing in action
Let’s enable the new algorithm and run the exact same test as we did before. The cache misses graph now looks like this:

In the previous section before the solution, we saw in the same cache-misses graph that immediately after a node is restarted, it experiences around 3 times more cache misses per second than the hot nodes. But here with the solution enabled, we see that restarted node (yellow) and the other nodes (overlapping blue and green) have very close cache miss rate after the restart which was the goal of the algorithm and tells us that the I/O is not overloaded on any of the nodes.
The reason that the yellow, blue, and green lines are close but do not overlap is that the input to the algorithm we use is not the immediate cache hit ratio (it is impossible to know that in a distributed system), but a moving average which introduces some inaccuracy into the algorithm.
If we look at the cache-hit ratio graph, it shows, as expected, that although the heat-weighted load balancing initially sends fewer requests to the cold node, the cold node still performs enough requests for its cache to warm up over time until reaching the steady state that all three nodes have the same cache hit ratios.

In the previous section we saw that without heat-weighted load balancing, all three nodes did half of the work locally and sent the other half to the other nodes. This situation now is more interesting.


We can see that the cold node (yellow line) starts by sending to the other nodes (“remote reads” graph) significantly more requests than it performs locally (“local reads”). This difference can be seen even more clearly in the following graph plotting “replica reads”. In “replica reads”, we plot the amount of work that a node does for a different coordinator (not including work it left for itself).

It can be seen that the initially restarted node serves only read requests sent to itself as a coordinator. No other coordinator sends it requests so the yellow line is at zero. Furthermore, the restarted node receives as a coordinator more requests than it can handle locally so it sends some of them to the other nodes making the blue and green lines initially higher. As the restarted node’s cache becomes warmer, it can handle more requests so the restarted node sends fewer of its requests to the other nodes (so the blue and green lines slowly go down). When the cache is warm enough, the other coordinators start to send it requests as well (so at this point the yellow line starts to go up). Eventually, the cache hit ratios equalize and the blue, green, and yellow lines meet.
Looks great, but did all this work help to improve read latency? It really did. Let’s look at the latency graph again. The blue line marked “before” is the graph we already saw earlier without the new cache-heat load balancing algorithm. The yellow line is the new load balancing algorithm.

As we wanted, now latency remains the same throughout the cache heating process and does not jump when we add the node with the cold cache.
Conclusions
We presented the problem of a ScyllaDB cluster’s latency going up when a node is rebooted and starts with an empty cache. Ironically, the latency increases not when one of the nodes goes down, but when the node comes back up eager to share the load with an empty cache. We presented a solution called heat-weighted load balancing which will be available in ScyllaDB 2.0. With heat-weighted load balancing, rebooting individual nodes no longer affects the cluster’s read latency.
We presented here just enough implementation details to give the reader a taste of some of the difficulties we had to tackle: how much work should we give to each node, how do we do this when CL > 1 requires giving work to more than one node, how can we rebalance the load when the token-aware driver already divides the requests evenly, and how do we do rebalancing without overwhelming the network with forwarded requests. If you’re interested in more of the gory details, check out the ScyllaDB source code or stay tuned for a follow-up document on heat-weighted load balancing. You can also just run ScyllaDB and enjoy its low latency now even after a reboot of a node.