| IMPORTANT: Since the first publication of the Mutant Monitoring System we have made a number of updates to the concepts and code presented in the blog series. You can find the latest version now in ScyllaDB University. Click here to be directed to the new version. |
This is part 14 of a series of blog posts that provides a story arc for ScyllaDB Training.
In the previous post, we went over Materialized Views and showed a few examples of how to create views from the Mutant Monitoring System (MMS) data. Times are getting tough now. Attacks from the mutants are on the rise all over the country and Division 3 has not handled this problem effectively with the monitoring applications. Since the applications were not properly preventing or stopping attacks in a timely manner, Division 3 now wants to dive back into data analytics to learn how to prevent the attacks. In this post, we will go over how to use Apache Spark, Hive, and Superset to analyze and visualize the data from the Mutant Monitoring system.
As our mutant data increases in size over time, we need to be able to quickly analyze it using a cluster of machines and that is where Apache Spark comes in. Apache Spark is a distributed system and unified analytics engine for large-scale data processing. Using Hive, we can query data from a ScyllaDB cluster using SQL syntax. Superset provides a graphical web interface that is used to visualize data from Hive.
To get started with using Spark, Hive, and Superset, we will need to bring up the containers.
Running the ScyllaDB, Spark, and Superset Containers
The first step is to clone the scylla-code-samples repository and change to the Spark directory from the terminal.
git clone https://github.com/scylladb/scylla-code-samples.git
cd scylla-code-samples/mms/spark
Now we can build and run the containers:
docker-compose build
docker-compose up -d
After roughly 60 seconds, the existing MMS data will be automatically imported into ScyllaDB. To make the data and graphs more interesting, we also included our load generator tool which is a simple Node.js application that populates the tracking keyspace with data. By this time, the Spark and Superset containers are running as well. We now need to learn how to set up Spark and Hive so they can communicate with ScyllaDB.
Running Spark and Hive
After Spark is running, we will run the Thrift server inside the container. Thrift is an RPC framework that allows applications to interact with ScyllaDB. In the command below, we tell Thrift to connect to Hive inside the container and use scylla-node1 as the Cassandra connection host:
With the Thrift server started, we will now need to create the Hive table with the following commands:
The output of the command should be:
After this command is run, Hive will know that we are using the tracking keyspace and tracking_data table from the ScyllaDB cluster. With Spark and Hive set up, we can now move on to Superset.
When Superset is run for the first time, you will not be able to log into the web interface because an admin password is not configured. The command below sets the password for the Superset web interface.
Now we can begin to import the Mutant Monitoring data set for Superset to use. Navigate to the scylla-code-samples/mms/spark directory in your terminal and run the following commands:
Using Superset
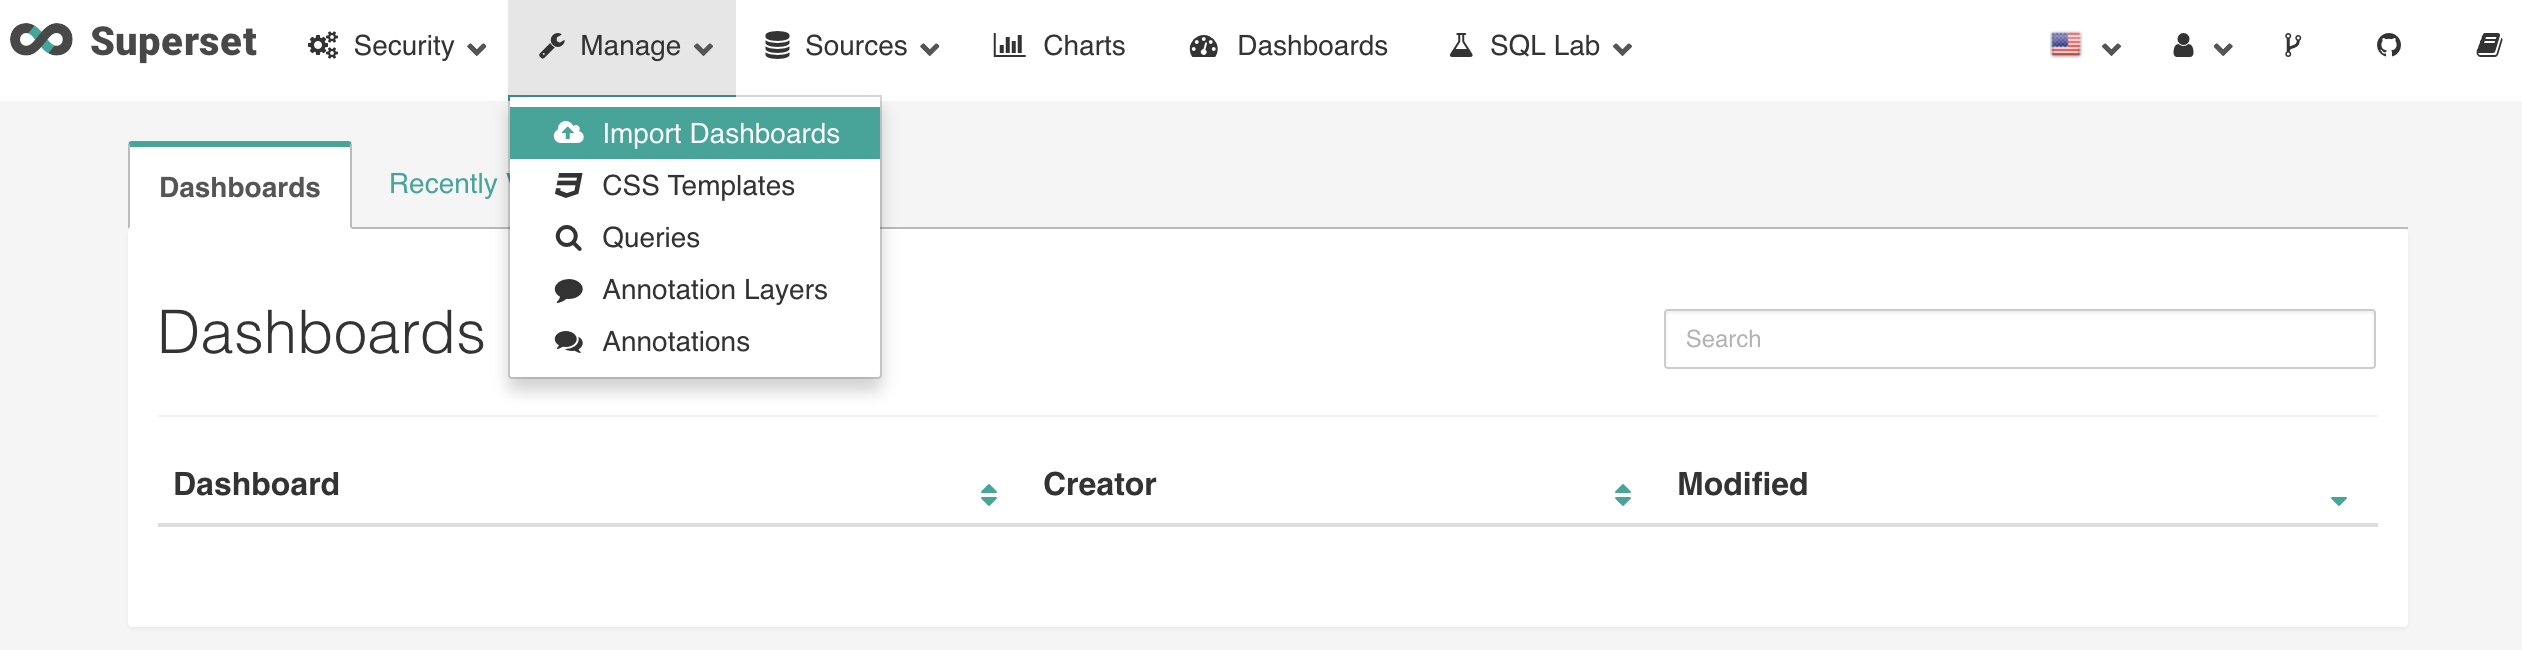
The next step is to log into the Superset web interface located at http://127.0.0.1:8088/ with the username and password of “admin” and import the dashboard.
Import the dashboard.json located in scylla-code-samples/mms/spark:
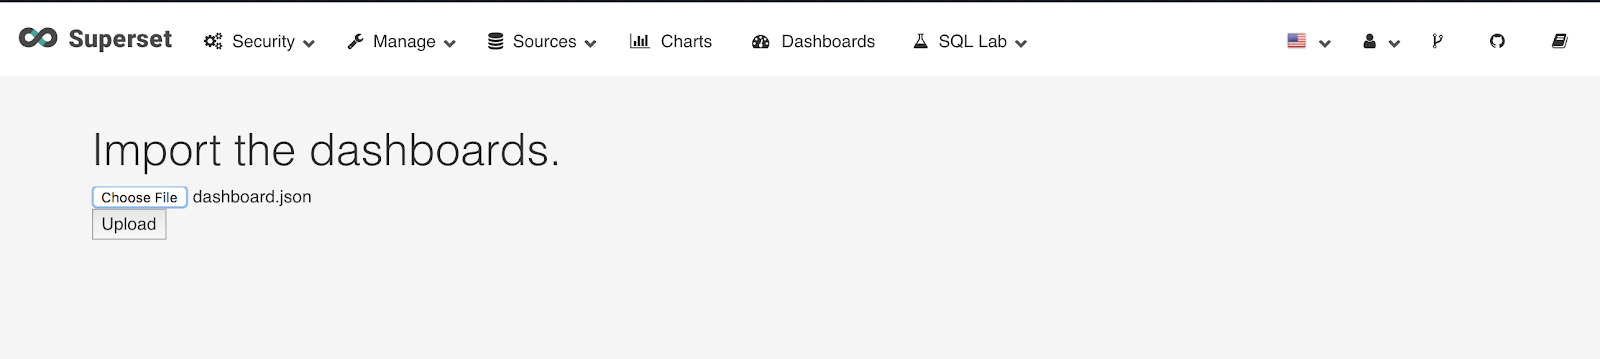
Click Upload.
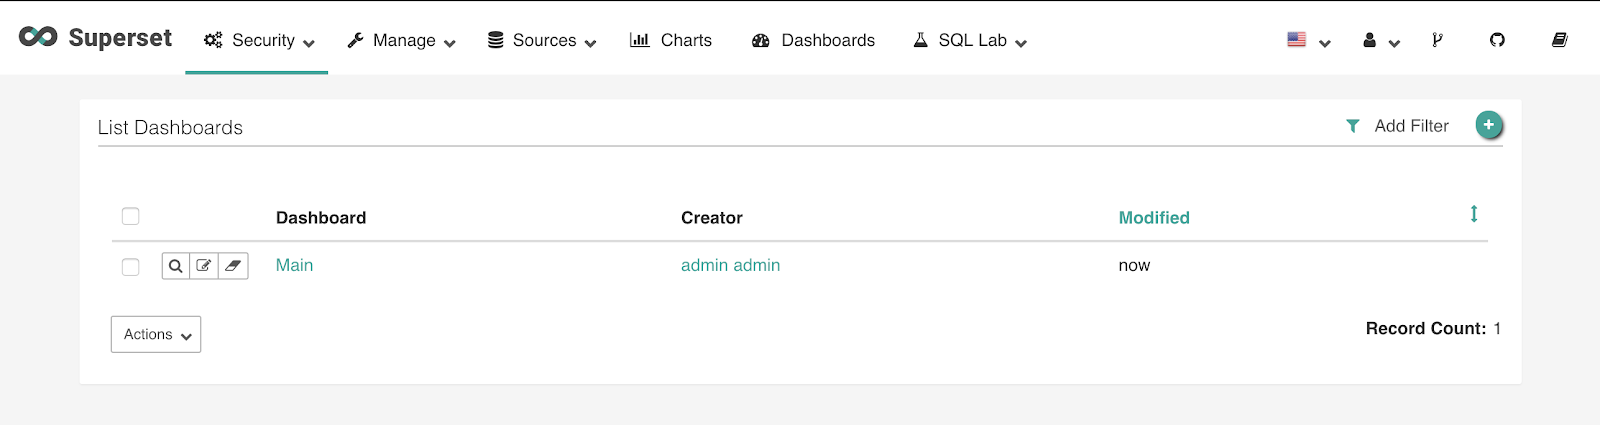
Click on Dashboards on the top of the page followed by clicking on the “Main” dashboard.
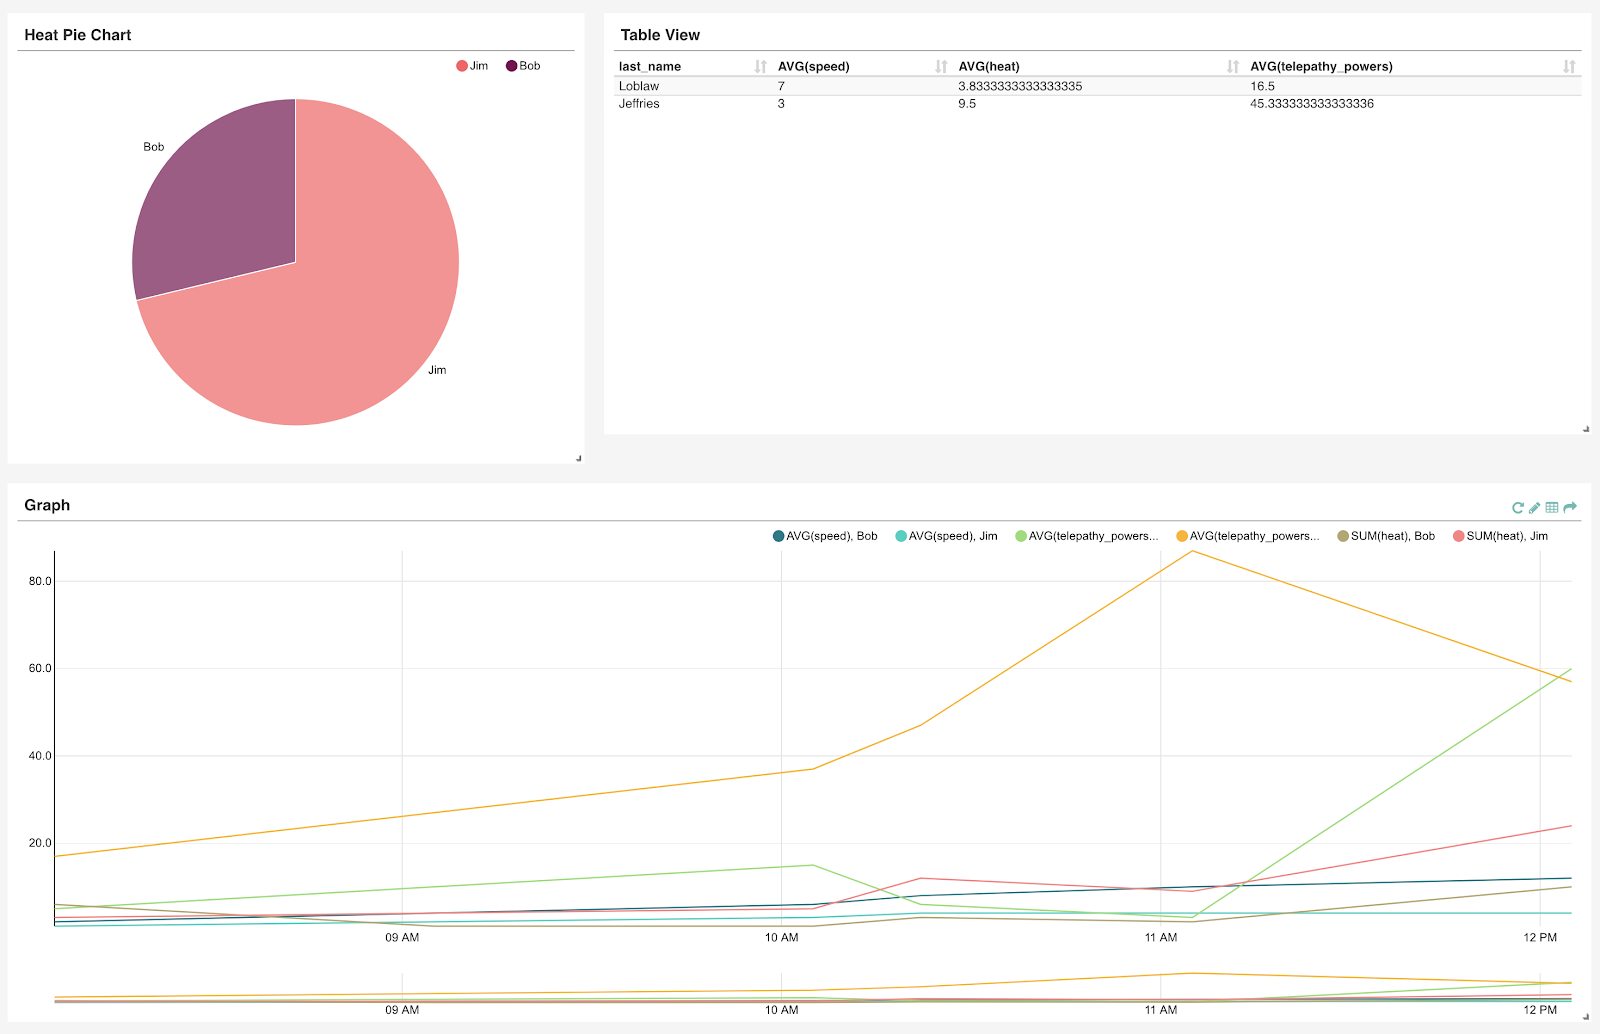
In this dashboard, you will be able to see a heat pie chart that displays the heat signature of each mutant, a table view of the tracking_data keyspace, and a line chart that shows heat, telepathy, and speed over time.
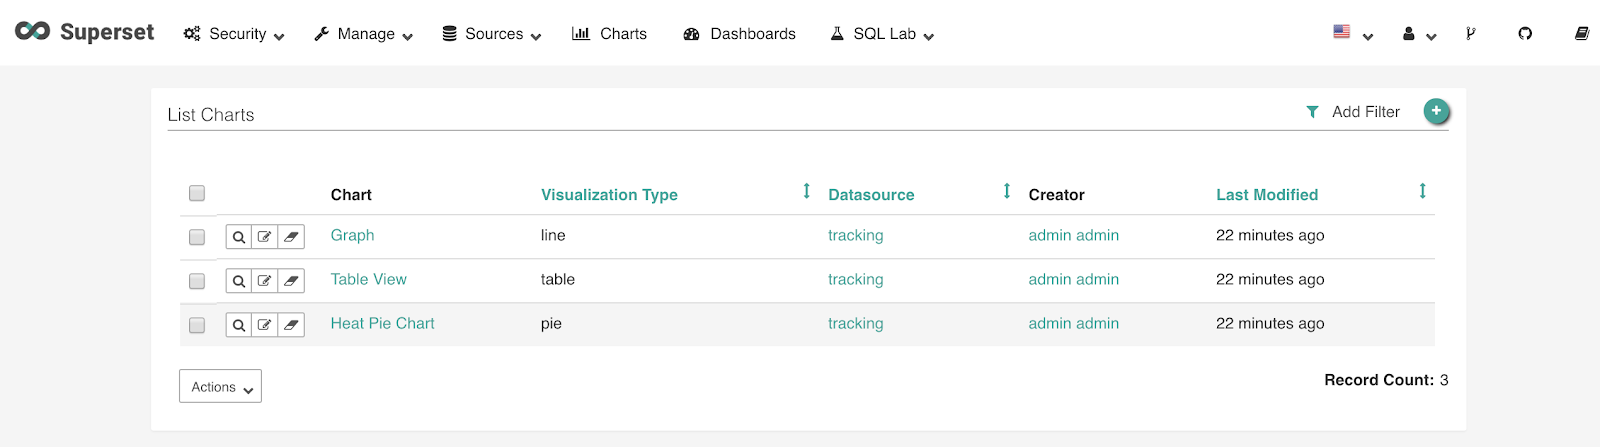
To modify or create your own charts, click on Charts on the top of the screen. From here you can click on the green plus icon to create a new chart or modify an existing one by clicking on the chart. Click on the Graph chart and let’s examine the contents.
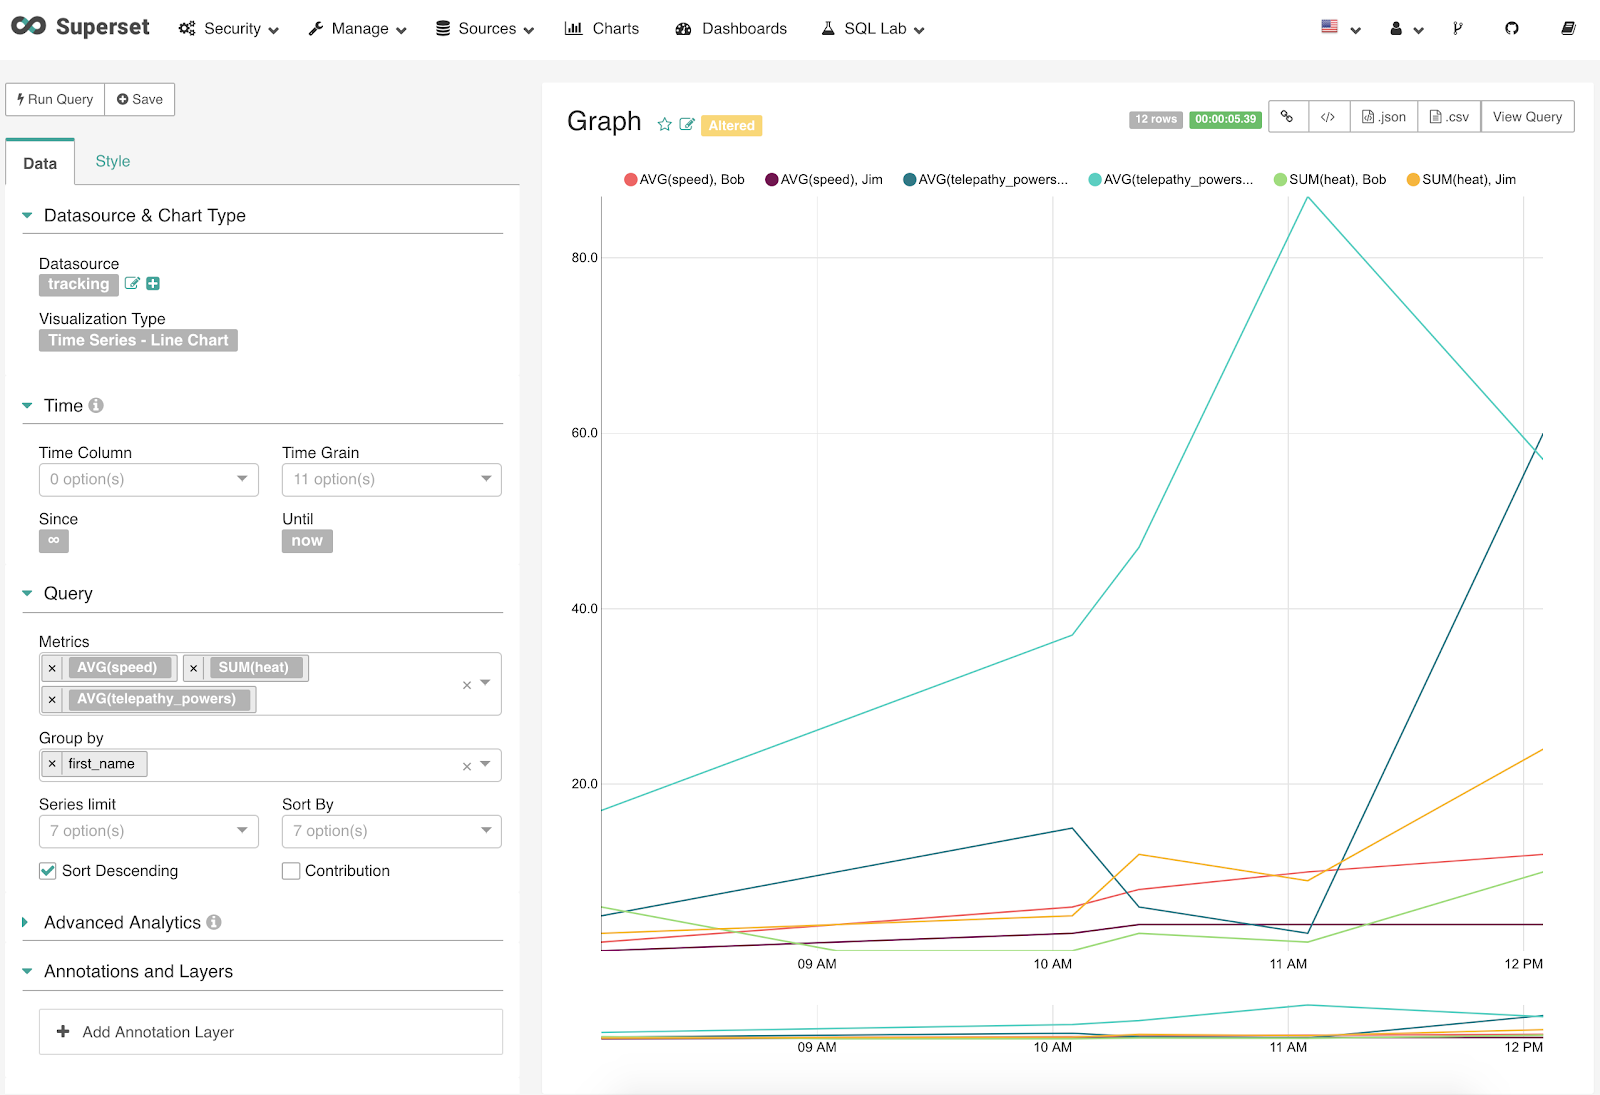
In the image below, you can see how the chart was made and we make changes as needed. In the query box, we are taking data from the tracking keyspace and running queries based on speed, heat, and telepathy powers and grouping the results by the mutants first name. After a change is made, you can click on “Run Query” to see the results and then click save to make the changes permanent.
Conclusion
Division 3 was not taking the proper actions to analyze the Mutant Monitoring data effectively and took action to do better in the future. In this post, we explained how to do data analytics on a ScyllaDB cluster using Apache Spark, Hive, and Superset. Apache Spark is a powerful distributed data analytics system and Hive provides an SQL interface for interacting with data from ScyllaDB. Combined with Superset, Division 3 has a easy and powerful solution to visualize the data from the Mutant Monitoring System. Please be safe out there and continue to monitor the mutants so we can protect as many lives as possible.
Next Steps
- Learn more about ScyllaDB from our product page.
- See what our users are saying about ScyllaDB.
- Download ScyllaDB. Check out our download page to run ScyllaDB on AWS, install it locally in a Virtual Machine, or run it in Docker.